
Abstract
While the Anion Exchange Membrane Fuel Cell (AEMFC) is gaining interest due to high power performance recently achieved with platinum-group-metal (PGM) catalysts, its implementation will require high-performing PGM-free cathodes. FeNC catalysts have shown high activity and stability for the Oxygen Reduction Reaction (ORR) in alkaline electrolyte; however, the production of hydrogen peroxide during ORR can lead to premature degradation of FeNC and ionomer. In order to minimize the amount of peroxide formed on FeNC, α-MnO2, β-MnO2, δ-MnO2 and α-Mn2O3 were investigated as co-catalysts, with the aim of increasing the apparent activity of FeNC-based cathodes for the hydrogen peroxide reduction reaction (HPRR). The specific activity of α-Mn2O3 for the HPRR was distinctly superior to the other Mn-oxides. The four Mn-oxides were mixed with a FeNC catalyst comprising atomically-dispersed FeNx sites, showing higher HPRR activity and higher four-electron ORR selectivity than FeNC alone. The stability of α-Mn2O3/FeNC was studied operando by on-line inductively-coupled plasma mass spectrometry, to evaluate the potential and time dependent leaching of Mn and Fe. Finally, FeNC and α-Mn2O3/FeNC were applied at the cathode of AEMFCs, both achieving similar or higher current density at 0.9 V than a Pt/C commercial cathode, and peak power densities of ca. 1 W·cm−2.
Export citation and abstract BibTeX RIS

This is an open access article distributed under the terms of the Creative Commons Attribution Non-Commercial No Derivatives 4.0 License (CC BY-NC-ND, http://creativecommons.org/licenses/by-nc-nd/4.0/), which permits non-commercial reuse, distribution, and reproduction in any medium, provided the original work is not changed in any way and is properly cited. For permission for commercial reuse, please email: permissions@ioppublishing.org.
This was paper 1671 presented at the Atlanta, Georgia, Meeting of the Society, October 17–15, 2019
The energy-environment nexus calls for the development of renewable energy sources and more efficient machines. Renewable electric power, produced from solar or wind energies for example, can be efficiently converted to hydrogen via water electrolysis, and hydrogen used as a green fuel, on demand.1 To this end, fuel cell devices can efficiently re-convert renewable H2 and O2 from air to electric power with high efficiency. This technology is well positioned to compete, among other applications, with internal combustion engines for automotive application.2 Among different types of fuel cells, Proton Exchange Membrane Fuel Cells (PEMFCs) are currently the ones envisioned and developed by the automotive industry for transportation application, due to their high power density, low internal resistance, low maintenance, long-term durability and fast start-up.3,4 In the long term, however, the main drawback of PEMFCs is tied to the kinetics of the Oxygen Reduction Reaction (ORR) that occurs at the cathode side. The sluggishness of the ORR in the acidic PEMFC forces the use of platinum-based catalysts to minimize the losses in energy efficiency and power density that are associated with the ORR overpotential.5,6 Platinum is a rare and expensive metal that increases the production cost of the device, threatening the large-scale commercialization of PEMFCs and its sustainability.5–8 The need to reduce the amount of platinum (at large, platinum group metals (PGMs), Pt and Pd being the least rare PGMs) in high-performance PEMFCs has led the scientific community involved in electrocatalysis to investigate two separate approaches, one leaning on the improvement of PGM (mostly Pt) catalysts and cathode layers to utilize more efficiently such metals,9–14 and another exploring the synthesis of PGM-free catalysts with activity and durability that must, ultimately, become comparable to those of Pt-based catalysts.
Among the PGM-free catalysts investigated since the early 2000's, a class of MNC catalysts with 3d transition metals (M=Fe and Co, in particular) integrated in a N-doped carbon matrix has hitherto shown the most promising activity and stability in acidic media,15–21 though oxynitrides of transition metals of group 4 and 5 in the periodic table have also been reported with promising activity.22–24 The nature of the most active catalytic sites in MNC catalysts obtained via pyrolysis has been controversial since their emergence. However, recent studies from several groups are now converging to the same conclusion that, in acidic medium, the most active and stable sites in MNC catalysts are atomically-dispersed MNx moieties.25–34 This conclusion could be reached with the preparation of model MNC materials, exclusively comprising single-metal-atom structures and no metal clusters (to the detection limit of X-ray absorption and 57Fe Mössbauer spectroscopies as well as scanning transmission electron microscopy). Combined theoretical and experimental interpretation of the spectroscopic response of such model MNC catalysts prepared from different precursors are also converging to the picture of FeNx and CoNx moieties (x ≤ 4) embedded in the carbon matrix as porphyrinic MN4C12 or pyridinic MN4C10 structures, with the transition metal in a +II or +III oxidation state and in different spin states.17,26,27,35–38 Binuclear Fe2N5 sites have also been proposed and could be a minority site in FeNC catalysts, but possibly with higher turnover frequency.39
Besides the need to further improve the activity of MNC catalysts for matching the high PEMFC performance currently obtained with Pt-based catalysts, the main bottleneck for the industrial application of MNC catalysts in PEMFC is presently their limited durability during PEMFC operation. Their degradation mechanisms have been intensively explored in rotating disk electrode (RDE), PEMFC and ex situ with non-electrochemical Fenton tests.19,34,40–50 While some MNC catalysts have shown high stability when load-cycled in deaerated acidic electrolytes,34,42 similar load-cycling O2-saturated electrolytes has resulted in irreversible ORR activity loss, assigned to reactive oxygen species formed during ORR, such as hydrogen peroxide, triggering unexpected carbon corrosion at such low potential and the transformation of FeNx sites to iron oxide.51 All MNC catalysts can also be expected to suffer from carbon corrosion during startup/shutdown accelerated stress tests, leading to the destruction of MNx sites and the leaching of the metal cations.34,52 Such transient events can be mitigated at system level and are therefore less critical than the degradation occurring during normal PEMFC cathode operation.
Highly microporous FeNC catalysts, often prepared via NH3 pyrolysis, are the most active MNC catalysts in acidic media, but they are also the least stable in operating PEMFCs.16,18,40,53,54 Recent studies by Dodelet's group and also our group have shown that NH3-pyrolyzed microporous FeNC materials show distinctly faster Fe leaching rates in acidic medium than FeNC catalysts similarly prepared but pyrolyzed in inert gas.43,55 Our study reported that the leaching rate of iron in O2-saturated acid electrolyte during a linear scan between 1 and 0 V vs RHE was circa 10 times higher for a microporous FeNC catalyst (prepared via a first pyrolysis in Ar and a second pyrolysis in ammonia, labelled Fe0.5–NH3) relative to the FeNC catalyst prepared identically except that it was not subjected to the second pyrolysis in ammonia (labelled Fe0.5–Ar).43 Furthermore, the online and operando measurement identified that the Fe leaching rate increased when the potential was decreased from 1 to 0 V vs RHE, with an onset potential at ca. 0.75 V vs RHE and a peak of dissolution rate at 0.2–0.3 V vs RHE. It was also shown that both the Fe0.5–NH3 and Fe0.5–Ar catalysts are exclusively comprised of FeNx sites. Thus, the distinctly lower stability of FeNx sites in Fe0.5–NH3 in acidic electrolyte could be assigned to either the higher microporosity of Fe0.5–NH3, or to weaker Fe–N bonds in acidic medium. These new insights must also be connected with previous studies from Dodelet's group where it was shown that NH3 pyrolysis results in nitrogen-groups with high pKa values, and the high initial activity in acid medium was proposed to be due to the protonation of such N-groups in acidic medium, and their fast deactivation due to subsequent anion adsorption on positively-charged NH groups.56 Combined together, those results can be interpreted as the coordination of Fe cations with highly basic N-ligands in Fe0.5–NH3, with the Metal-N coordination leading to high ORR activity but low stability in acid media due to the competition between Fe cations and protons for such highly basic N-groups. Strongly supporting this hypothesis, Fe0.5–NH3 was as stable as Fe0.5-Ar in alkaline electrolyte, both from the perspective of the operando-measured Fe leaching rate in O2-saturated electrolyte and from the measured ORR activity before and after 5,000 load cycles.43 The mass activity of Fe0.5–NH3 at 0.9 V vs RHE in 0.1 M KOH was 4.6 A·g−1, among the highest reported mass activities for MNC catalysts thus far.57–60
The high activity combined with high stability in alkaline medium of the most active FeNC catalysts prepared via ammonia pyrolysis is thus promising for their application in Anion Exchange Membrane Fuel Cells (AEMFCs). AEMFCs have recently received significant attention as a possibly much lower cost alternative to PEMFCs,61–66 particularly since the emergence of very high performing and stable cells over the past two years.67–71 However, essentially all modern AEMFCs are operated with PGM-based catalysts despite the fact that the highly touted low cost of future AEMFCs relies on the development of highly active and stable PGM-free catalysts for both the cathode and anode. At the cathode, production of hydrogen peroxide during AEMFC operation on FeN4 sites or on the N-doped carbon surface might limit device lifetime.72,73 Hydrogen peroxide, a reaction intermediate produced by the 2 + 2e− ORR pathway, is a strong oxidizer, which, at low pH and, in the presence of 3d transition metal cations, undergoes Fenton's reaction, producing reactive oxygen species (ROS) such as ·OH and ·OOH.45,74 In high-pH environment, rather than ·OH and ·OOH, it is the superoxide radical (O2−) that is expected from Fenton reactions between hydrogen peroxide and 3d metal cations, or as an ORR intermediate. The superoxide radical has recently been shown to be positively correlated with the decrease in ion-exchange capacity and conductivity of AEMs in an operating AEMFC with in situ fluorescence spectroscopy.72,73 In contrast, Fenton reactions between FeNC catalysts and hydrogen peroxide have recently been shown to lead to strong ORR deactivation when occurring in acid electrolyte, but to no ORR deactivation when occurring in alkaline electrolyte.45 Nevertheless, HO2− might strongly bind on the Fe-based active sites and, if not electro-reduced to water sufficiently quickly, might poison the FeN4 active sites. This effect would be exacerbated in the confined environment of micropores, where both the O2 access and removal of formed peroxide are limited.45 The formation of hydrogen peroxide from 2e− ORR is also unwanted in AEMFCs because it lowers the achievable efficiency and power density.
For those reasons, the aim of this work is to identify a stable and active PGM-free electrocatalyst for the 2e− reduction of HO2− to OH− in alkaline electrolyte, and to study such a catalyst in combination with the highly active and stable Fe0.5–NH3 catalyst mentioned previously. With such a composite catalyst, we aim to decrease the amount of peroxide produced during ORR in alkaline electrolyte below the level observed on Fe0.5–NH3. It is important to remind here that, in contrast to the case in acidic medium, the ORR activity of metal-free N-doped carbons in alkaline medium is not negligible.75–77 Thus, metal-free nitrogen functional groups can significantly contribute to the ORR in parallel with FeNx sites, in any FeNC catalyst. Such metal-free N-groups typically catalyse the 2e- ORR to HO2−. The role of a co-catalyst that is selected for its high activity toward hydrogen peroxide reduction reaction (HPRR) is thus to scavenge hydrogen peroxide produced either at FeNx or metal-free N-sites, in alkaline electrolyte. Manganese oxides have been well-known for decades for their high heterogeneous catalytic activity toward H2O2 disproportionation, which has been investigated in particular for propulsion of space and undersea vehicles.78,79 Surprisingly, however, while various transition-metal-oxides have previously been shown to work in tandem with carbon catalysts (carbon catalysing O2 electro-reduction to HO2− and metal-oxides catalysing the HPRR),80–82 the investigation of the specific HPRR activity of different Mn-oxide polymorphs has only recently been investigated by Ryabova et al.83,84 Among the different Mn-oxide polymorphs that were investigated (α-Mn2O3, LaMnO3, β-MnO2, α-MnOOH and Mn3O4), α-Mn2O3 was identified as the initially most active one, followed by β-MnO2. Structure-Activity correlations were established, identifying the MnIV/MnIII redox potential as a key descriptor to predict the onset potential for HPRR.
From these previous works, we selected four Mn-oxide polymorphs, i.e. three allotropes of MnO2, namely α-MnO2, β-MnO2 and δ-MnO2, and one Mn-oxide with a different stoichiometry, i.e. Mn2O3, which showed to be the most active for HPRR in Ref. 83 The stability of the same four MnOx materials was recently investigated by us in a parallel work using a scanning flow cell coupled to inductively coupled mass spectroscopy (SFC/ICP-MS).85 That work evidenced higher leaching rates of manganese during electrochemical load-cycling conditions in O2-saturated 0.1 M NaOH electrolyte than in N2-saturated electrolyte. By following the Mn leaching rate upon controlled addition of hydrogen peroxide in the electrolyte, we could demonstrate that the increased Mn leaching during ORR is triggered by hydrogen peroxide produced during the ORR. We also evidenced that α-Mn2O3 was the most stable Mn-oxide in this series in the ORR potential range, with lowest dissolution rate of manganese.
The objective of the present work is to investigate the HPRR activity in alkaline electrolyte of α-MnO2, β-MnO2, δ-MnO2, and α-Mn2O3, and to investigate the effect of the Mn-oxides on the ORR activity, selectivity and HPRR activity of composite catalysts prepared from a mix of Fe0.5–NH3 and each one of these oxides. The HPRR activity was studied in a RDE setup while the ORR activity and selectivity were measured with a Rotating Ring Disk Electrode (RRDE) setup. The activity and performance of both Fe0.5-NH3 and α-Mn2O3/Fe0.5–NH3 cathodes were also investigated in operating AEMFCs.
Experimental
Synthesis of manganese oxides
The synthesis of pure α‒, β‒, δ‒MnO2 and α‒Mn2O3 phases was performed according to literature reports, and as detailed in our recent study.85 A brief description is given here for each phase. The α‒MnO2 phase was obtained by reducing KMnO4 in ultrapure water (18 MΩ) and fumaric acid at room temperature. The resulting gel was filtered, washed with ultrapure water and dried.25 δ‒MnO2 was obtained via the reduction of KMnO4 in a mixture of water, H2SO4 and ethanol, also at room temperature.86 To obtain β‒MnO2, the dried δ‒MnO2 powder was calcined at 450 °C. For preparing α‒Mn2O3, γ-MnOOH was prepared in a first step, and then calcined at 550 °C for 12 h.87 For the first step, γ-MnOOH was synthesized dissolving Mn(CH3COO)2·4 H2O and KMnO4 in deionized water, the solution refluxed for 12 h and then washed with water and dried.88
Synthesis of Fe0.5-NH3
Fe0.5-NH3 was prepared via the sacrificial metal-organic framework method.43 Commercial ZIF-8 (Basolite® Z1200, Sigma Aldrich), 1,10-phenantroline (≥99%, Sigma Aldrich) and iron (II) acetate (≥99.99%, Sigma Aldrich) were mixed in weight ratios of 4/1 for ZIF-8/phenanthroline and 0.5 wt% of iron in the complete catalyst precursor, using planetary ball milling (400 rpm, four cycles of 30 min milling with 5 min pause between each cycle). The catalyst precursor powder was then collected from the jar, transferred in a quartz boat and inserted in a quartz tube. For the first pyrolysis, the oven was pre-equilibrated at 1050 °C for 2 h while a continuous flow of Ar passed through the tube, with the quartz boat and catalyst precursor inside the tube but outside the heating zone. After 2 h, the quartz boat was pushed in the heating zone in three steps of 30 s ("flash pyrolysis"), with the help of an outer magnet and a quartz rod with magnet attached at one end, located inside the tube. The catalyst precursor was pyrolysed in Ar at 1050 °C for exactly 1 h, then the split-hinge oven opened and the tube removed and let to cooldown for 20 min, still under Ar flow. A second pyrolysis was then performed, following the above-mentioned procedure, but using pure NH3 instead of Ar, an oven temperature of 950 °C and a pyrolysis duration of 5 min. The final product is collected directly from the quartz boat (Fe0.5–NH3).
Preparation of MnOx/Vulcan and MnOx/Fe0.5–NH3 composites
Each Mn-oxide phase was mixed with Vulcan carbon black in a weight ratio of 1/4 by manual grinding. The Mn-oxides were mixed with Fe0.5-NH3 with the same procedure and weight ratio.
Physical and morphological characterization
The crystalline structure of the four manganese oxides was verified using X-ray Powder Diffraction (XRPD) with PANAlytical X'pert diffractometer in Bragg-Brentano configuration, using a CuKα source (λ = 1.5406 Å) in a 2θ range of 5°–80° with a step size of 0.035°. The most intense peaks were compared to the literature using PANalytical X'Pert Highscore Plus (version 3.0e). To analyse the morphology of the Mn-oxides, Fe0.5-NH3 and α-Mn2O3/Fe0.5-NH3, scanning electron microscopy (SEM) was applied (Hitachi S4800). Specific surface area of the four Mn-oxides was determined using the Brunauer–Emmett–Teller (BET) method, cleaning previously the sample with flowing nitrogen at 200 °C for 5 h and then measuring the sorption of nitrogen at 77 K (Micromeritics ASAP 2020). Elemental distribution in the α-Mn2O3/Fe0.5-NH3 composite was analysed with SEM (ZEISS EVO HD15) coupled with Energy-dispersive X-ray spectroscopy (EDX, Oxford Instruments X-Max N SDD Detector).
Electrochemical characterization
The ORR activity and HO2− production during ORR were measured with a RRDE setup (Pine Instruments) in 0.1 M KOH, using a three-electrode configuration. The reference electrode was a Pt-wire immersed in a H2-saturated electrolyte separated from the main compartment by a fritted glass, acting as a reversible hydrogen electrode (RHE). The counter electrode was a graphite rod immersed in the electrolyte, at a fixed distance from the working electrode. The latter was a glassy carbon tip (5.6 mm of diameter) where the catalyst is deposited. The peroxide produced at the working electrode was detected at the Pt ring. The HPRR activity was measured in a RDE setup (Pine instruments) in the same conditions (glassy carbon tip of 5 mm diameter). The inks were prepared adding in sequence 54 μl of Nafion® (5% perfluorinated resin solution), 744 μl of ethanol and 92 μl of ultrapure water to 5 mg of FeNC, 20%-MnOx/C or 20%-MnOx/FeNC. The mixture was then sonicated for 1 h for homogenization. Then, 8.8 μl of the dispersion was deposited on the RRDE-GC tip, while 7 μl are drop cast on RDE-GC tip, and dried in air at room temperature, to obtain a total catalyst loading of 0.2 mg·cm−2. For measuring the ORR activity of the Vulcan carbon black (used for Mn-oxides), an aliquot of 7.0 μl was drop cast on the RRDE-tip and 5.6 μl on the RDE-tip, in order to reach a loading of 0.16 mg cm−2. This corresponds to the loading of Vulcan in the active layers of 20%-MnOx/C. The electrochemical surface area of the Mn-oxides was assessed on 20%-MnOx/C composite layers in N2-saturated electrolyte by cycling at 10 mV mV·s−1 and under 1600 rpm rotation the potential between 0.45 and 1 V vs RHE (SP-300, BioLogic Potentiostat). The lower range potential of 0.45 V was chosen to minimize Mn leaching.85 To measure the ORR activity and selectivity, the solution was saturated with O2 and the potential scanned in the range 0−1 V vs RHE with a scan rate of 1 mV s−1, while the potential of 1.2 V vs RHE was applied to the Pt ring. To measure the activity toward HPRR, a RDE configuration was used, and the measurement performed in N2-saturated 0.1 M KOH with 2 mM H2O2, scanning the potential at 1 mV·s−1 in the range 0.45–1.0 V vs RHE. During ORR and HPRR measurements, the scan rate of 1 mV·s−1 was sufficiently low to neglect non-Faradaic currents.
Operando scanning flow cell—inductively coupled plasma mass spectroscopy
To evaluate the stability of the α-Mn2O3/Fe0.5–NH3 catalyst, a custom made polycarbonate SFC coupled with ICP-MS (Perkin Elmer, NexION 350X) is used to measure in situ the dissolution of manganese and iron during electrochemical protocols. Electrochemical measurements have been carried out in a three electrode configuration using a graphite counter electrode, Ag/AgCl reference electrode (Metrohm) and glassy carbon as working electrode. Electrochemistry is applied with a Potentiostat (Gamry, Reference 600) in 0.05 M NaOH (Merck, Certipur), reaching a controlled pH (Mettler Toledo, SevenExcellence) of 12.7, used to convert the potentials of the Ag/AgCl to the RHE.
AEMFC testing
The catalytic inks were prepared following the procedure described in Omasta et al., manually grinding the catalyst and ETFE (ethylene tetrafluoroethylene) powder ionomer,89 and then dispersing the solids in a mixed solvent of H2O and 1-propanol (10 vol% H2O). All anodes were prepared from a 60% PtRu/C commercial catalyst (Johnson Matthey, 2:1 Pt:Ru mass ratio), mixed with Vulcan to reach 40 wt% PtRu/C. 150 mg of 40 wt% PtRu/C and 37.53 mg of ETFE were weighed to prepare the anode ink (ionomer/carbon ratio 0.41). Pt/C cathodes were prepared from a 60 wt% Pt/C commercial catalyst (Johnson Matthey) mixed with Vulcan to reach 40 wt% Pt/C. The catalyst and AEI mass were the same as used for the anode ink. For Fe0.5–NH3 cathodes, 82.59 mg of catalyst was mixed with 17.35 mg ETFE AEI (ionomer/carbon ratio 0.21). For α-Mn2O3/ Fe0.5–NH3 cathodes, 20.91 mg α-Mn2O3, 82.59 mg Fe0.5–NH3 and 17.35 mg ETFE were mixed together. The dispersion was then sonicated in an ice bath for 1 h and then sprayed on a gas diffusion layer (Toray 60, 5 wt% PTFE wet-proofing) using an airbrush (Iwata Eclipse HP CS). The obtained gas diffusion electrodes and ETFE membrane (50 μm thick in fully swollen conditions) were then soaked for 20 min in 1 M KOH, and this was repeated two times. The electrodes and membrane were combined to create Membrane Electrode Assemblies (MEAs) without prior hot-pressing in single-cell Scribner fuel cell hardware using Teflon gaskets, with the gasket thickness chosen to reach 25% compression. The AEMFC was operated using a Scribner 850e Fuel cell test system, flowing H2/O2 at 1.0 l min−1 with a cell temperature of 60 °C. No back pressure was applied on anode and cathode sides. The break-in was performed at 0.5 V, adjusting the relative humidity (RH) at both electrodes.34,35 AEMFC tests were carried out with three different cathodes: (a) 40 wt%Pt/C, with a loading of 0.45 mgPt cm−2 (total catalyst loading of 1.125 mg cm−2); (b) Fe0.5–NH3; and c) α-Mn2O3/Fe0.5–NH3 (20 wt% α-Mn2O3). Both (b) and (c) had a total catalyst loading of 1.5 mg cm−2. All AEMFC experiments were carried out using 40 wt%[PtRu]/C at the anode side (Pt:Ru 2:1 mass ratio) with a loading of 0.9 mgPGM cm−2.
Results and Discussion
Physical and morphological characterization of Mn-oxides
The XRPD patterns shown in Fig. 1a demonstrate the formation of pure or almost pure Mn-oxide phases. All diffraction peaks could be assigned to the targeted oxide phase (Fig. S1 is available online at stacks.iop.org/JES/167/134505/mmedia), except for the α-Mn2O3 pattern which also shows minor peaks that can be assigned to α-MnO2 (5% of α-MnO2 was estimated,85). Figure 1a also underlines the higher crystallite dimension of α-Mn2O3 compared to MnO2 structures. The δ-MnO2 phase, especially, shows broad peaks indicating small crystallite. The high crystallinity of the present α-Mn2O3 material may be related to the high temperature of 550 °C at which it was formed (see Experimental section), while the higher crystallinity of β-MnO2 relative to δ-MnO2 may also be explained from the viewpoint of the synthesis temperature, namely room temperature for δ-MnO2 and then calcination at 450 °C to obtain β-MnO2. Figure 1b shows the N2 adsorption isotherms of the Mn-oxide materials, revealing the coexistence of micro and mesopores. The isotherm of δ-MnO2 shows the highest amount of N2 adsorbed, especially at low P/P0 and also a strong hysteresis closing at P/P0 of ca. 0.4. The shape of the isotherms of β-MnO2 and α-MnO2 are similar up to P/P0 = 0.7, with the one for β-MnO2 vertically translated by ca. +10 cm3·g−1 due to a higher amount of N2 adsorbed at low P/P0. The adsorption isotherm for α-Mn2O3 clearly shows a much lower amount of N2 adsorbed relative to all others, as well as little hysteresis, suggesting it is mostly non-porous. The BET specific surface areas are, in increasing order, 14 (α-Mn2O3), 98 (α-MnO2), 136 (β-MnO2) and 214 (δ-MnO2) m2·g−1. In line with the very different BET areas, SEM micrographs provide evidence of substantial morphological differences. Macroscopically, δ-MnO2 and β-MnO2 share a common particle morphology, with a size in the range of 300–600 nm (Figs. 2a, 2c), in line with the fact that β-MnO2 was simply derived from δ-MnO2 via calcination. However, the high resolution SEM micrographs show that the δ-MnO2 surface has a higher roughness, with a sand-rose morphology and chambers of 30–60 nm, which partially collapsed in the case of the β-MnO2 particles (Figs. 2b, 2d). The macroscopic morphology of α-MnO2 is different, with large chunks that are several μm in size, composed of numerous well-defined rod-shaped sub-structures with ∼130–300 nm length and 30–60 nm width, and also of even smaller objects with less-defined particle-like morphology (Figs. 2e, 2f). Last, α-Mn2O3 has an molten-like, interconnected particle morphology with a smooth surface and an average particle dimension of ∼150 nm (Figs. 2g, 2h), in line with the higher temperature of 550 °C used for its synthesis. The BET area ranking can be reasonably well explained from the surface roughness as identified by the higher magnification SEM images. The highest BET area was measured for δ-MnO2 (214 m2·g−1) with highest surface roughness (Fig. 2b), then slightly decreased BET area of 136 m2·g−1 for β-MnO2 due to partial collapse of surface tortuosity (Fig. 2d), still a high surface area of 98 m2·g−1 for α-MnO2 with smooth but small rod substructures (Fig. 2f) and, last, drastically lowered BET area of 14 m2·g−1 for α-Mn2O3 due to interconnected and molten particles morphology (Fig. 2h).
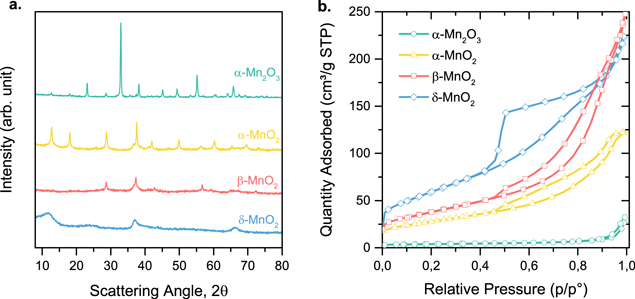
Figure 1. Physical characterization of the four Mn-oxides with (a) XRPD and (b) N2 physisorption isotherms. The match with the calculated diffraction peaks for the targeted Mn-oxide structures can be seen in Fig. S1.
Download figure:
Standard image High-resolution image
Figure 2. SEM micrographs of the different Mn-oxide polymorphs, in two different magnifications. (a)–(b) δ-MnO2, (c)–(d) β-MnO2, (e)–(f) α-MnO2, (g)–(h) α-Mn2O3.
Download figure:
Standard image High-resolution imageTo further verify the apparent correlation between surface roughness and BET area, we calculated the expected size of Mn-oxide nanostructures from their measured BET areas and assuming either a slab, rod, or spherical geometry (depending on samples) for the non-porous oxide substructures assumed to contribute mainly to the surface area of the Mn-oxides (Table I). For δ-MnO2 and β-MnO2, the assumed slab geometry results in an estimated slab thickness of ca. 3 nm, in line with the very thin walls of the sand rose morphology observed by SEM.
Table I. Measured BET areas of the Mn-oxides and estimated object size of the oxide nanostructures forming the BET area. A slab geometry was assumed for δ-MnO2 and β-MnO2 and spherical geometry for α-Mn2O3.
| Oxide | BET (m2·g−1) | Density (g·cm−3) | Theor. specific surface area | Calculated object size/nm |
|---|---|---|---|---|
| δ-MnO2 | 214 | 3.00 | 2/(ρ·t) (slab) | 3.1 |
| β-MnO2 | 136 | 5.03 | 2/(ρ·t) (slab) | 2.9 |
| α-MnO2 | 98 | 4.36 | 4/(ρ·d) (rod) | 9.4 |
| α-Mn2O3 | 14 | 4.50 | 6/(ρ·d) (sphere) | 95.2 |
For α-MnO2, the assumed rod morphology results in ca. 9 nm diameter for the rods, which is significantly smaller than observed by SEM. Therefore, the surface of α-MnO2 seems to result from a contribution of the observed rods but also from the smaller and less defined objects seen in the SEM images (Fig. 2f). Last, for α-Mn2O3, the estimated particle size of ca. 95 nm is in line with the smooth particles observed in SEM images (Fig. 2h). Due to these large morphological differences, the apparent activity that will be measured for a given loading of Mn-Oxides during RDE measurements needs to be normalized to the active area, which will be approximated by the BET area.
Electrochemical characterization of Mn-oxides
The HPRR activity of the four Mn-oxide polymorphs mixed either with Vulcan (Fig. 3a) or Fe0.5-NH3 (Fig. 3b) was investigated by RDE in deaerated 0.1 M KOH with 2 mM HO2−. The polarization curves seen in Figs. 3a–3b show a cathodic branch that can mainly be assigned to HPRR (Eq. 1), and an anodic branch that can be assigned to the hydrogen peroxide oxidation reaction (HPOR) (Eq. 2). In addition, a minor fraction of the cathodic current might also be related to the ORR, with O2 being produced in situ via non-electrochemical disproportionation of peroxide on the Mn-oxide surface (Eq. 3).


Figure 3. Activity toward HPRR. (a) Polarization curves of the four Mn-oxides mixed with Vulcan (20 wt% MnOx/C), (b) polarization curves of the four Mn-oxides supported on Fe0.5-NH3 (20 wt% MnOx/Fe0.5-NH3 ), (c) polarisation curves of MnOx/C normalized by the area of the Mn-oxides, (d) histograms reporting the slope near j = 0 obtained from the BET-normalized polarization curves in (c). All experiments were carried out in 2 mM HO2− + 0.1 M KOH, with a three-electrode RDE configuration at a rotation rate of 1600 rpm, scan rate of 1 mV·s−1 and a total catalyst loading of 0.2 mg cm−2.
Download figure:
Standard image High-resolution imageConsidering the electrochemical reactions, it is important to note that reaction 2 is not the reverse of reaction 1, and the HPRR and HPOR have therefore very different equilibrium potentials, at pH 13 (see the equations above).90 This expresses that, in the entire potential region between 0.72 and 1.73 V vs RHE, HO2− should be highly unstable and could, theoretically, be at the same time electro-oxidized to O2 and electro-reduced to OH−. In practice, however, a net oxidation current is generally observed at potentials above 0.8–0.9 V, depending on the electrocatalyst investigated, and assigned to HPOR.83,91 The oxidation reaction (2) may be kinetically much faster than the reduction reaction (1), explaining why a net positive current is observed on all types of catalysts in that potential region. A net reduction current is observed for MnOx/Vulcan only when the HPOR becomes thermodynamically unfavored, i.e. at potentials lower than 0.83–0.85 V vs RHE (Fig. 3a). At those conditions, peroxide anions at the electrode surface can no longer be oxidized, and become available for HPRR. No clear redox process associated with Mn-oxides is observed near the open circuit potential of 0.83–0.85 V vs RHE, except for δ-MnO2, as shown by cyclic voltammetry in a N2-saturated electrolyte free of peroxide (Fig. S2). Therefore, the experimental values of open circuit potential (OCP) should be close to the equilibrium potential of reaction (2). With 2 mM HO2− in the electrolyte and assuming an activity of 1 for O2 (i.e. assuming that reaction 3 can saturate with O2 in a very thin layer of electrolyte near the catalyst surface), one can calculate from the Nernst equation that the equilibrium potential for reaction (2) should be 0.801 V vs RHE, assuming a pH of 13. This is close to the experimentally observed values of OCP, ranging from 0.83 to 0.85 V vs RHE for δ-MnO2, β-MnO2, α-MnO2 and α-Mn2O3, in the order of increasing OCP values. Looking at the cathodic branch, assigned mainly to HPRR, the current density reaches different values of plateau depending on the Mn-oxide considered (Fig. 3a), which is in contradiction with a same diffusion-limited current density expected for the two-electron HPRR. During the HPRR, the current density plateau is highest for α-Mn2O3, followed by β-MnO2 and δ-MnO2, and lowest for α-MnO2. It was shown by Ryabova et al. that this limiting current density can be assigned entirely to a rate-determining chemical step in the HPRR on Mn3O4 and MnOOH (with the limiting current density showing no variation with the rotation rate), while β-MnO2 was in an intermediate situation in which the limiting current density slightly varied with rotation rate, but much less than expected from the Levich equation.83 In contrast, the limiting current density of HPRR on α-Mn2O3 obeyed the Levich equation and increased proportionally with the square root of the electrode rotation rate. The authors concluded that for MnOOH and Mn3O4 (as well as β-MnO2, partially) the rate of the HPRR at low potential is not controlled by the diffusion of HO2− species toward the electrode, but by a slow chemical step. The latter was proposed to be the chemical dissociation of the O–O bond of an adsorbed HO2− on a MnIII site. Our experimental results are in line with this, showing that other MnO2 allotropes behave similarly to β-MnO2 (Fig. 3a). In the anodic branch (where the HPOR dominates), in contrast, no such effect was reported by Ryabova et al., and the HPOR was limited by peroxide diffusion at potentials above 1 V vs RHE for both α-Mn2O3 and β-MnO2.83 A similar observation is made here for oxidation current densities at 1 V vs RHE on the present set of Mn-oxides mixed with Vulcan, though the anodic branches at this potential have not yet reached their plateau. This may be due to the lower OH− concentration used in our work compared to Ref. 83, 0.1 and 1.0 M respectively. As one can see from reaction (2), the HPOR involves OH− as a reactant, and this could therefore impact the HPOR reaction rate.
As discussed in the previous section, the different Mn-oxides possess very different BET areas, α-Mn2O3 in particular having a lower BET area than the other materials. To assess their intrinsic activity for HPRR/HPOR, we normalized the geometric current density by the surface area of the oxides in the active layer (from the known loading and the known BET area of each oxide). Since Vulcan has negligible activity for HPRR/HPOR (Fig. 3a, black diamonds), this normalization should correctly represent the intrinsic specific surface activity of the Mn-oxides in a three-electrode environment where the liquid electrolyte should wet the entire surface of all of the catalysts. Figure 3c highlights the superior intrinsic activity of α-Mn2O3 compared to the three MnO2 allotropes. In this graph, α-Mn2O3 not only reaches higher reduction currents at low potential (due to non-limitation by a slow chemical step) but also higher oxidation and reduction currents near OCP, i.e. faster intrinsic electrochemical kinetics. To quantify the latter, we fitted the polarization curves in the region close to OCP (−30/+50 mV) with a straight line and report the derivative dj/dE (units of mA cmoxide−2 V−1) in Fig. 3d. The figure shows a seven-fold higher intrinsic activity for α-Mn2O3 compared to β- and α-MnO2, and fourteen-fold higher intrinsic activity compared to δ-MnO2. These results are in line with the five-fold higher kinetic rate constants k2 and k3 for Mn2O3 vs β-MnO2 reported in Ref.83, and describing the kinetics of reaction (2). In conclusion, α-Mn2O3 is shown to be intrinsically more active toward HPRR and HPOR than the other Mn-oxides. Furthermore, our recent study showed that Mn2O3 is also more stable than the other Mn-oxides in the ORR region, even after normalization for the oxide area.85 Therefore, both from activity and stability viewpoints, α-Mn2O3 is clearly identified as the most promising Mn-oxide material for scavenging peroxide species produced during ORR. The full potential of α-Mn2O3 vs other Mn-oxides is, however, challenged by its generally lower BET area, related to the high temperature calcination usually required to form this phase.92–94
In the next step, the Mn-oxides were mixed with Fe0.5-NH3, in the same weight ratio as was used for Vulcan, i.e. 20 wt% Mn-oxide on Fe0.5-NH3. A SEM image of Fe0.5-NH3 is shown in Fig. S3a, showing an alveolar structure in that region of the catalyst. Due to the commensurate sizes of the Fe0.5-NH3 and MnOx particles materials (Fig. 2), distinguishing the two phases is difficult in SEM images of the composite catalysts. As an example, Figs. S3b–S3c show SEM images of α-Mn2O3/Fe0.5-NH3, where some particles, due to their different morphology can likely be assigned to α-Mn2O3. Table SI reports the elemental contents determined by SEM-EDX on different regions of α-Mn2O3/Fe0.5-NH3, revealing areas with Mn and Fe weight contents close to those expected for a homogeneous distribution of Mn2O3 on Fe0.5-NH3, as well as areas with lower-than-expected Mn contents. The HPRR and HPOR polarization curves of Fe0.5-NH3 and of the four composite materials are shown in Fig. 3b, confirming the previously discussed feature of cathode limiting current density but also revealing a new feature with respect to trends in the OCP values. The Fe0.5-NH3 catalyst alone, while showing a much higher OCP value (ca. 0.94 V vs RHE) compared to all MnOx/Vulcan, has poor HPRR and HPOR kinetics, as visible from its lower dj/dE near OCP and lower absolute value of cathodic current density at low potential (Figs. 3a–3b). The poor HPRR and HPOR activity of Fe0.5-NH3 is a general phenomenon for FeNC catalysts, observed in both alkaline and acid electrolytes.95–101 The maximum HPOR and HPRR current densities for Fe0.5-NH3 in the potential range 0.5–1.0 V vs RHE are ca. 0.2 and 0.4 mA cm−2, respectively (Fig. 3b). These values are significantly increased for the MnOx/Fe0.5-NH3 composites. In the cathodic region, the limiting current density increases in the same order than for the MnOx/Vulcan catalysts, i.e. α-MnO2 < δ-MnO2 = β-MnO2 < α-Mn2O3, demonstrating the role of Mn-oxides in increasing the HPRR activity of MnOx/Fe0.5-NH3 composites. In the anodic region of 0.95–1.0 V vs RHE, the HPOR current density is also higher for all MnOx/Fe0.5-NH3 composites relative to Fe0.5-NH3 (Fig. 3b). The composites MnOx/Fe0.5-NH3 also show higher OCP values than the corresponding MnOx/Vulcan layers, with OCP values of 0.86 and 0.91 V vs RHE for α-MnO2/Fe0.5-NH3 and α-Mn2O3/Fe0.5-NH3, respectively. This shift of OCP toward higher values seems driven by the even higher OCP of Fe0.5-NH3 (0.94 V vs RHE). In fact, due to the negligible activity of Vulcan in MnOx/Vulcan layers, and the comparable loading of Fe0.5-NH3 in the pure Fe0.5-NH3 layer and in the composite MnOx/Fe0.5-NH3 layers (0.20 and 0.16 mg cm−2, respectively), one may expect the polarization curves of MnOx/Fe0.5-NH3 layers to behave, in first approximation, as the linear superposition of the polarization curves of MnOx/Vulcan and Fe0.5-NH3.
Overall, the results confirm the higher HPRR activity of α-Mn2O3/Fe0.5-NH3 relative to Fe0.5-NH3 itself, at potentials of 0.50–0.85 V vs RHE. At the cathode of an AEMFC, peroxide may be produced in this potential region due to high current density and relatively low selectivity of metal-free N-doped sites (along with some peroxide produced from FeNx sites).
The demonstration of the concept of scavenging HO2− formed during ORR with the addition of Mn-oxides to Fe0.5-NH3 requires RRDE measurements in O2-saturated electrolyte. Figures 4a–4c shows, for reference, the ORR selectivity, activity, and Tafel plots of MnOx/Vulcan layers, respectively. The ORR onset of MnOx/Vulcan layers is ca. 0.9 V vs RHE for α-Mn2O3, α- and β-MnO2 and ca. 20 mV lower for δ-MnO2. The ORR polarization curves show otherwise a similar shape and reach comparable O2-diffusion-limited current densities (Fig. 4b). The latter are close to the value expected for an overall apparent four-electron ORR, correlated by low% HO2− detected at the ring (Fig. 4a). A closer detail at the% HO2− reveals fine differences, with decreasing% HO2− in the order α-MnO2, δ-MnO2, β-MnO2, α-Mn2O3. This is in the exact same order as the absolute value of limiting current density observed on MnOx/C layers in the HPRR measurement (Fig. 3a). This suggests that ORR on these MnOx proceeds via a 2e + 2e pathway (subsequent 2 electron reduction on same MnOx sites) and/or via 2 electron pathway to peroxide followed by catalytic HO2− decomposition (reaction 3), which could also lead to apparent overall near four-electron ORR.

Figure 4. ORR selectivity, polarisation curves and Tafel plots for the four Mn-oxides supported on Vulcan carbon (20 wt% MnOx/Vulcan). The total catalyst loading is 0.2 mg·cm−2, except for Vulcan alone, with a carbon loading of 0.16 mg·cm−2 mimicking the amount of Vulcan deposited with the MnOx/Vulcan active layers. All experiments were carried out in O2 saturated 0.1 M KOH electrolyte, with a three-electrode RRDE configuration at a rotation rate of 1600 rpm and a scan rate of 1 mV·s−1. No correction was made for the Ohmic drop.
Download figure:
Standard image High-resolution imageThen, the ORR selectivity, polarization curves and Tafel plots were recorded for Fe0.5-NH3 and the four MnOx/Fe0.5-NH3 composite layers (Figs. 5a–5c). Fe0.5-NH3 alone shows high ORR activity of ca. 1 mA·cm−2 at 0.9 V vs RHE (Fig. 5c), i.e. a mass activity of ca. 5 A·g−1, similar to our recent study on Fe0.5-NH3 in alkaline electrolyte.43 The ORR activity (in mA per cm2 geometric area of electrode) at 0.9 V of the four MnOx/Fe0.5-NH3 composite layers is ca. 30% lower (Fig. 5c), as expected from the slightly lower loading of Fe0.5-NH3 in the composite cathodes(only 0.16 mgFeNC cm−2, while the reference Fe0.5-NH3 layer has 0.2 mgFeNC cm−2). Last but not least, Fig. 5a demonstrates higher selectivity for all MnOx/Fe0.5-NH3 composite layers relative to Fe0.5-NH3. This result can be interpreted as a bifunctional effect of the composite layers, the FeNx sites mainly driving the ORR to water, with minute amount of peroxide produced (either on some FeNx sites, or on the N-C surface), and the MnOx particles mainly acting as electrochemical scavengers of the minute amount of peroxide produced.

Figure 5. ORR selectivity, polarisation curves and Tafel plots for the four Mn-oxides supported on Fe0.5-NH3 (20 wt% MnOx/Fe0.5-NH3). The total catalyst loading is 0.2 mg cm−2 (i.e. 0.2 mgFeNC cm−2 for the pure layer, and only 0.16 mgFeNC cm−2 for the composite layers). All experiments were carried out in O2 saturated 0.1 M KOH electrolyte, with a three-electrode RRDE configuration at a rotation rate of 1600 rpm and a scan rate of 1 mV·s−1. No correction was made for Ohmic drop.
Download figure:
Standard image High-resolution imageThen, the stability of the composite catalyst α-Mn2O3/Fe0.5-NH3 was evaluated in operando SFC-ICP/MS. α-Mn2O3 was selected for the composite catalyst due its higher oxide-surface-normalized HPRR activity, as shown in this study and previously, as well as its slightly higher stability among this set of four oxides, as recently reported by Speck et al.85
Figure 6a (middle panel) in the region from 0 to ca. 500 s shows similarly low Mn dissolution rates (<ca. 0.1 ng·cm−2·s−1) for the composite α-Mn2O3/Fe0.5-NH3 catalyst in both Ar- and O2-saturated electrolytes when the potential is cycled for the first time between 1 and 0.6 V vs RHE. This is due to the relative thermodynamic stability of α-Mn2O3 in that restricted potential range. In contrast, when the potential is cycled between 1 and 0 V (time between 500 and 1500 s in Fig. 6a, middle panel), the Mn leaching rates increased when compared to the 1–0.6 V cycling and a higher Mn leaching rate is observed in O2-saturated electrolyte vs Ar-saturated electrolyte. This trend is similar to that observed for α-Mn2O3/C.85 An accelerated stress test protocol showed that the overall dissolution of manganese in O2-saturated electrolyte is higher than in Ar-saturated electrolyte (Fig. 6b, middle panel), which is explained by the presence of hydrogen peroxide produced in O2-saturated solution, as already reported by us.85 Concerning Fe dissolution, the catalyst does not show evident dissolution peaks during the first slow scan between 1 and 0 V in O2-saturated electrolyte (Fig. 6b, bottom panel). The dissolution rate of Fe is 0.05–0.08 ng cm−2·s−1, comparable to the Fe leaching rate observed for Fe0.5-NH3 and previously reported by us.43 Fig. 6b (middle panel) shows that the Mn dissolution rate from α-Mn2O3/Fe0.5-NH3 is comparable to the dissolution rate previously reported for the same Mn-oxide supported on Vulcan,85 with maximum leaching rates of 0.15–0.30 ng·cm−2·s−1 in O2-saturated electrolyte during the slow-scan from 1 to 0 V vs RHE.

Figure 6. Operando SFC-ICP/MS of the composite catalyst 20% α-Mn2O3/80%Fe0.5-NH3 in alkaline electrolyte saturated with Ar (blue curve) or O2 (red curve). (a) Relation between the potential and the dissolution of manganese (middle graph) or iron (bottom graph) during low-load CVs (1–0.6 V vs RHE) and high-load CVs (1–0 V vs RHE) in either Ar- (blue curve) or O2-saturated (red curve) electrolyte. (b) Durability test comprising an initial high-load CV followed by fast CVs and a final high-load CV to evaluate the leaching of manganese (middle plot) and iron (bottom plot) in either Ar- (blue curve) or O2-saturated (red curve) electrolyte.
Download figure:
Standard image High-resolution imageFinally, Fe0.5-NH3 and α-Mn2O3/Fe0.5-NH3 were evaluated as cathode catalysts in operating AEMFCs and compared to Pt/C (Fig. 7a). The initial activity at 0.9 V of the PGM-free cathodes is comparable with that of Pt/C. Fe0.5-NH3 shows a higher current density at 0.9 V (65 mA·cm−2) than the composite catalyst, which shows 52 mA·cm−2, almost identical to Pt/C (55 mA·cm−2) (Fig. 7b). At lower cell voltages, the PGM-free cathodes do not perform as well as the Pt/C cathode, due to mass transport issues. The latter may be assigned to a more difficult path for oxygen to reach the active centers in such cathodes (possibly due to the microporous nature of the carbon in Fe0.5-NH3), but also to local O2 starvation due to the much lower site density in Fe0.5-NH3 (ca. 1.6 wt% Fe only)43 compared to Pt/C (40 wt% Pt). Nevertheless, the absolute performance obtained with these PGM-free cathodes is promising: the Fe0.5-NH3 and α-Mn2O3/Fe0.5-NH3 cathodes are able to support a current density of 1.43 A·cm−2 and 1.25 A·cm−2 at 0.6 V, respectively. This corresponds to 59 and 52% of the current density at 0.6 V obtained with 0.45 mgPt·cm−2 (2.41 A·cm−2). The peak power density is 1.04 W·cm−2 for Fe0.5-NH3 and 0.98 W·cm−2 for the α-Mn2O3/Fe0.5-NH3 composite, compared to 1.53 W·cm−2 for Pt/C (Fig. 7c). The higher current density at low potential (below 0.4 V) obtained using the composite α-Mn2O3/Fe0.5-NH3 cathode relative to Fe0.5-NH3 can be attributed either to the effect of the Mn-oxide helping in reducing peroxide into water at those potentials, or to the slightly lower loading of Fe0.5-NH3 in the composite cathode (80% the loading compared to that in the Fe0.5-NH3 layer), helping the mass-transport of oxygen.

Figure 7. AEMFC polarization curves measured for Pt/C, Fe0.5-NH3 and α-Mn2O3/Fe0.5-NH3 cathodes using ETFE membrane and ETFE ionomer at a cell temperature of 60 °C and using H2 and O2 flow rates of 1 l min−1. The anode was always PtRu/C with 0.9 mgPtRu cm−2. The polarization curve was acquired at a scan rate of 10 mV·s−1 and the data recorded in the negative-going scan is shown. The cathode loading was 0.45 mgPt·cm−2 for Pt/C, 1.5 mgFeNC·cm−2 for Fe0.5-NH3, and 0.3 mg α-Mn2O3·cm−2 and 1.2 mgFeNC·cm−2 for α-Mn2O3/Fe0.5-NH3. No correction was made for Ohmic drop.
Download figure:
Standard image High-resolution image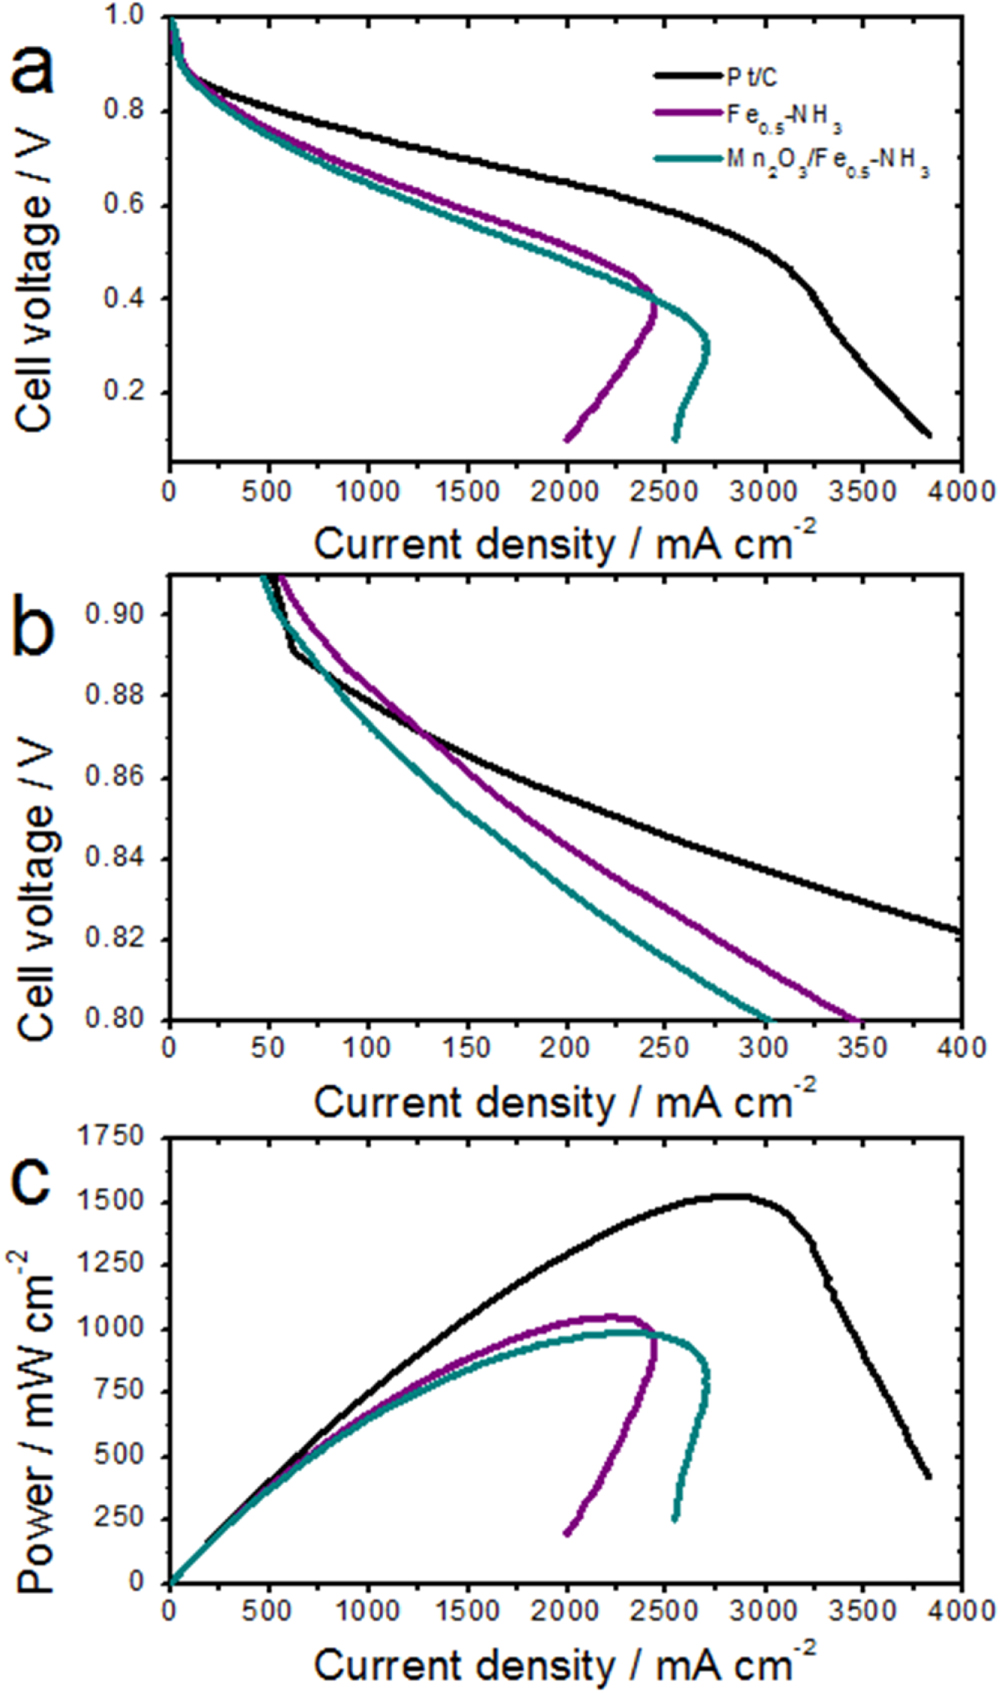
Table SII gives an overview of AEMFC performance previously reported in H2 and O2 conditions with PGM-free cathodes, indicating three key metrics corresponding to pure kinetic control (current density at 0.9 V), mixed kinetic and mass-transport control (current density at 0.6 V) and mainly mass-transport control (peak power density) of the cell performance. From Table SII, it can be seen that the current densities reached at 0.9 V with the present Fe0.5-NH3 and α-Mn2O3/Fe0.5-NH3 cathodes (52–65 mA·cm−2) are significantly above those reported for PGM-free metal oxides (≤15 mA·cm−2)102–106 and other FeNC catalysts with atomically-dispersed FeNx sites (≤25 mA·cm−2),107–111 with the exception of the material labelled Fe-S-Phen/CNT in Ref. 112 and that resulted in a current density of ca. 120 mA·cm−2. The latter was however reached at a cell temperature of 80 °C, significantly above 60 °C used in the present study. The current density at 0.6 V is an important operating point of fuel cells, often resulting in a balanced compromise between energy efficiency (proportional to the ratio of operating to thermodynamic cell voltage) and power density. The current density obtained with Fe0.5-NH3 and α-Mn2O3/Fe0.5-NH3 cathodes (1430 and 1250 mA·cm−2) are above those reported for other FeNC cathodes (190–977 mA·cm−2),107,108,110–112 with two exceptions. The first, is a FeCoPc/C material in Ref., 109 that achieved 1670 mA·cm−2 at 0.6 V, though this was obtained at a higher cell temperature (80 °C vs 60 °C here) and with a thinner AEM (15 μm, vs 50 μm here). Both factors are known to significantly improve the cell performance, due to lower Ohmic resistance but also improved water management. The second exception was by our team using a similar FeNC material to Fe0.5-NH3,113 where a current density of 1830 mA·cm−2 was achieved at 65 °C and 0.6 V. However, the data reported there was taken with a much higher IEC, thinner AEM based on high density polyethylene.114
The current density obtained with Fe0.5-NH3 and α-Mn2O3/Fe0.5-NH3 cathodes at 0.6 V (1430 and 1250 mA·cm−2) are also above those reported recently for CoO and Co3O4 (320 and 520 mA cm−2),105,106 and comparable to those reported for CoOx or cobalt ferrite (1330 and 1560 mA cm−2)103 and MnCo2O4 spinel (970 mA cm−2 at 60 °C).104 The CoOx and cobalt ferrite were tested in the same cell housing and with the same FC test bench as in the present study, although at slightly higher cell temperatures of 65 and 70 °C (Table SII). Thus, in spite of a much higher ORR activity at 0.9 V for the present cathodes based on Fe0.5-NH3 vs those based on cobalt-rich oxides, similar current densities are hitherto observed at 0.6 V. This reveals that mass-transport must be further optimized in Fe0.5-NH3 cathodes, in order to improve the catalyst utilization at high current density. This could be achieved with improved water management (thinner membrane, optimized cell and O2 gas temperature and RH) or improved layer structure (pore size distribution, ionomer content and distribution, optimized catalyst loading). Finally, the peak power densities achieved with PGM-free cathodes are also reported in Table SII. A graph of peak power density vs current density at 0.6 V of the data shown in Table SII would reveal a straight proportional relationship, such that a separate discussion is not necessary for the peak power density. A similar linear relationship is also visible in Fig. 7b of Ref. 108
Overall, this overview of recent AEMFC data with PGM-free cathodes highlights the kinetic advantage of the present Fe0.5-NH3 and α-Mn2O3/Fe0.5-NH3 cathodes over other PGM-free cathodes, and its state-of-the-art power density. Compared to the 2022 milestone of initial AEMFC performance recently defined by the U.S. Department of Energy (≥ 1000 mA cm−2 at 0.65 V on H2/O2, T ≥80 °C and total PGM loading ≤0.2 mg cm−2, see Table II in Ref. 8), the cell performance achieved at 60 °C and at 0.65 V in the present work (1110 mA cm−2) already slightly exceeds this milestone with a PGM-free cathode, but with a higher PGM loading than targeted in the MEA (i.e. at the anode). Improved cathode and cell performance by operating to higher temperature and with optimized conditions should, in the near future, leverage the reduction of the PGM loading at the anode while maintaining the same overall cell performance. The investigation of the durability of FeNC layers during AEMFC operation and their optimization for operation with air (CO2-free) feed are the next important steps for increased maturity of FeNC-based AEMFC cathodes.
Conclusions
This study demonstrates that the addition of Mn-oxides to FeNC helps in scavenging hydrogen peroxide formed during ORR. The lower yields of hydrogen peroxide observed with MnOx/Fe0.5-NH3 layers compared to Fe0.5-NH3 alone derives from the high HPRR kinetics of the four Mn-oxides. α-Mn2O3 was shown to have higher HPRR activity than the other three Mn-oxide polymorphs, once normalized per oxide surface area. The present α-Mn2O3 material has however lower BET area than the other Mn-oxides, and further progress could thus be made by synthesizing α-Mn2O3 powders with higher BET area. α-Mn2O3 was selected for stability study in operando SFC-ICP/MS. The results show similar dissolution rates for Mn and Fe from the mixed layer 20 wt% α-Mn2O3/ 80 wt% Fe0.5-NH3 when compared to 20 wt% α-Mn2O3/C and Fe0.5-NH3, respectively. Thus, no synergy effect is observed regarding the metal leaching rates. The results also show similar trends as for the separate materials with respect to the saturating gas, with higher Mn dissolution rates in O2 vs Ar-saturated electrolytes, due the production of hydrogen peroxide that triggers the Mn leaching. Finally the mixed layer α-Mn2O3/Fe0.5-NH3 was tested at the cathode of an AEMFC, showing comparable activity at 0.9 V to the Fe0.5-NH3 cathode. The activity at 0.9 V in AEMFC is comparable to that achieved with a Pt/C cathode and significantly higher than that reported hitherto for cathodes based on cobalt-rich oxides. At 0.6 V cell voltage, current densities close to 1000 mA·cm−2 were achieved with α-Mn2O3/Fe0.5-NH3 and Fe0.5-NH3 cathodes at 60 °C in H2/O2 conditions. This is comparable to the best results recently reported with cathodes based on cobalt-rich oxides. Further optimization of the mass-transport is necessary to increase the catalyst utilization at high current density, in order to fully exploit the kinetic advantage of FeNC vs other PGM-based and PGM-free cathodes.
Acknowledgments
This work was supported by the European Union's Horizon 2020 research and innovation programme under grant agreement CREATE [721065]. We are grateful to Prof. John R. Varcoe (Univ. Surrey, UK) for providing the ETFE ionomer and membrane.