
Abstract
Ionomer distribution in catalyst layers (CLs) of polymer electrolyte fuel cells has garnered much attention because it affects proton and gas transfer. In this study, a novel visualization method of the overall through-plane ionomer and platinum-supported carbon (Pt/C) distributions in the CLs using two-stage ion-beam processing is proposed. The first stage is the formation of a flat and smooth cross-section using a broad ion beam. The second stage is the selective removal of the materials in the CL by a focused-ion beam. Scanning ion microscopic images were obtained after the first and second stages. The ionomer and Pt/C distributions were then obtained by image processing. CLs were prepared with the ionomer-to-carbon (I/C) ratio varied from 0.5 to 3.0. The effect of the dispersion process on the structure of the CL was also studied. With increasing I/C ratio, a thin ionomer layer was formed at the interface with the polymer electrolyte membrane. This behavior is attributed to deposition of ionomer during solvent evaporation. Ionomer thickness, agglomerate size of Pt/C, and pore size were evaluated. The agglomerate size of Pt/C was found to be affected by both I/C ratio and the dispersion process.
Export citation and abstract BibTeX RIS

This is an open access article distributed under the terms of the Creative Commons Attribution 4.0 License (CC BY, http://creativecommons.org/licenses/by/4.0/), which permits unrestricted reuse of the work in any medium, provided the original work is properly cited.
Polymer electrolyte fuel cells (PEFCs) are important potential energy devices for future applications in automobiles. A porous electrode, which is called a catalyst layer (CL), plays a key role in achieving high cell performance in PEFCs. The structure and resultant mass transport properties of the CLs used in PEFCs strongly affect cell performance.1–5 The structure of a typical CL consists of catalyst-supported carbon, an ionomer, and pores, which form paths for electrons, protons, and reactant gas molecules, respectively. All reactant substances are transported to the catalyst particles, and generated water is transferred from the catalyst. Fundamental understanding of the multiscale structure of CLs is required to evaluate their mass transfer properties. Therefore, numerous investigators have carried out structural characterizations to achieve a fundamental understanding of the transport phenomena in CLs. Electron microscopy has been widely used for visualization. Transmission electron microscopy (TEM) can visualize material structure, including that of catalyst particles at the sub-nanometer scale. Scanning electron microscopy (SEM) is one of the most common methods used to characterize porous structures. The pore size distribution has been evaluated using mercury intrusion porosimetry or nitrogen physisorption measurements.6 Recently, three-dimensional reconstruction methods of the porous structure have been developed and applied to the analysis of the microscopic structure of CLs. Nano X-ray computed tomography (CT) is one of the most promising methods for non-destructive inspection.7–9 A combined apparatus of focused-ion beam (FIB) and SEM, known as FIB-SEM, is another candidate method.10–14 Single-nanoscale resolution has been realized by SEM although this method is a destructive inspection.
An ionomer is used as a proton-conducting material in CLs, while it prevents gas transfer. The ionomer-to-carbon (I/C) ratio strongly affects the porosity of the CLs and cell performance.15 From a microscopic viewpoint, ionomer thickness and distribution can affect proton conductivity in CLs.16 Ionomer thickness on the catalyst particles affects gas transfer.17 Ionomer distribution has conventionally been regarded as being uniform, especially in numerical simulations. Iden et al. reported the average thickness of ionomer in CLs, giving the specific surface area of carbon materials and the coverage and uniform distribution of ionomer.18 However, this presumption lacks empirical evidence. For instance, an SEM image shows an inhomogeneous ionomer distribution, as shown in Fig. 1. Some of the ionomer covers Pt/C agglomerates in the lower-left region of the image. Some of the ionomer is like a string bridging the agglomerates. Park et al. have suggested that the carbon type affects the ionomer distribution.19 Inoue et al., on the basis of structural analysis by FIB-SEM, gas permeability tests, and numerical simulation, investigated the effects of nonuniform ionomer distribution on gas diffusion in CLs.20,21 Not only the local distribution but also the through-plane gradual ionomer distribution can affect cell performance, which has been reported by some numerical approaches.22–24
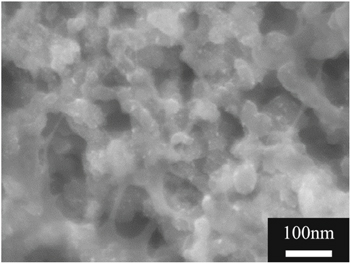
Figure 1. A scanning electron microscopic image of a catalyst layer.
Download figure:
Standard image High-resolution imageThis ionomer thickness and distribution in CLs have therefore attracted much attention. Some authors have suggested methods to analyze the ionomer thickness and distribution. More et al. used TEM to image an ionomer film in single-nanometer thickness covering a Pt/C surface.25 Guétaz, Lopez-Haro and co-workers conducted three-dimensional (3D) TEM imaging of carbon black covered by an ionomer.26,27 Rather than a Pt/C surface, they used bare carbon black to avoid the high contrast of Pt nanoparticles, which disturbs the 3D ionomer film reconstruction. Additionally, they stained the ionic domains with cesium ions (Cs+). They also presented elemental mapping images of fluorine in the CLs using high-speed X-ray energy-dispersive spectroscopy (X-EDS). Babu et al. conducted ionomer thin-film imaging in CLs of non-platinum-group metals by X-ray absorption contrast using a lab-scale nano-CT system8; they also stained their samples using Cs+. Cetinbas et al. fabricated an artificial CL structure including ionomer distribution on the basis of synchrotron-based nano-CT and multiple other characterization techniques.28 They imaged the 3D porous structure and ionomer distribution in a conventional CL using a combination of absorption contrast and Zernike phase contrast imaging modes of X-ray CT with the assistance of Cs+ staining.9,29 The voxel size was 12.5 nm. Morawietz et al. conducted material-sensitive and conductive AFM and reported the ionomer distribution and a histogram of the ionomer thickness.30–32 Susac et al. developed a method of ionomer imaging in a CL using scanning transmission X-ray microscopy (STXM).33 They prepared thin samples sliced to thicknesses of 100–300 nm and characterized the ionomer distribution, which was averaged in the thickness direction. Recently, Wu et al. reported a 3D ionomer distribution using STXM with a spatial resolution of ∼90 nm.34 Ionomer distribution imaging by soft X-ray spectro-ptychography was also reported by the same group to have a higher spatial resolution.35 Thus far, a two-dimensional spatial resolution better than 15 nm has been achieved.
TEM and AFM can image ionomer films with thicknesses ranging from the single-nanometer scale to tens of nanometers, although quantitative validation through overall CL is still in the discussion because the observation area is substantially smaller than the electrode thickness scale. TEM and X-ray CT techniques require Cs+ staining to achieve sufficient contrast of the ionomer. Synchrotron-based X-ray techniques can achieve the 3D reconstruction of micrometer-sized samples with the resolution greater than 10 nm. However, these techniques are subject to the restriction of machine time. In addition, reducing the damage to the ionomer by electron beams or X-rays is still an important challenge in electron- and X-ray-based techniques.
From the viewpoint of mass transfer, the overall through-plane ionomer distribution is important, as well as the microscopic distribution. In the present study, a novel visualization method of the overall through-plane ionomer distribution in the CLs using two-stage ion-beam processing (TS-IBP) is proposed. The first stage is the formation of a flat and smooth cross-section using a broad ion beam. The second stage is the selective removal of the materials in the CL by FIB. Scanning ion microscopic images were obtained after the first and second stages. The ionomer and Pt/C distributions were then obtained by image processing. In this technique, a relatively wide cross-section of the CLs is formed by a broad ion beam.15 The ionomer is then removed selectively by FIB. In general, ionomer damage caused by electron beams or X-rays is a problem to be avoided. By contrast, the beam-induced damage is put to practical use in our technique. In addition, all apparatuses used in this technique are lab-scale and general-purpose equipment. The objective of this study is to demonstrate the concept of ionomer distribution mapping using the TS-IBP technique through analysis of the CLs with different ionomer contents.
Experimental
Fabrication of catalyst-coated membranes
Platinum-supported carbon (Pt/C, TEC10E50E, Tanaka Kikinzoku Kogyo), Nafion dispersion (DE2020, Sigma-Aldrich), 1-propanol, and water were blended to form a catalyst ink. The carbon and alcohol weight fractions to disperse media were kept constant at 4 wt% and 44 wt%, respectively. The ink was dispersed for 30 min by a planetary centrifugal mixer (ARE-250, Thinky), and then additional dispersion was induced with an ultrasonic homogenizer (Q125, QSonica) with an amplitude of approximately 110 μm with intermittent operation. 1 s of sonification and 5 s of rest was repeated for 3 h in a cooling bath to prevent the rise of temperature of the catalyst ink. The dispersed ink was applied onto a polytetrafluoroethylene (PTFE) film by doctor blading and then dried on a hot plate at 60 °C. Fabricated CLs were decal-transferred onto a polymer electrolyte membrane (PEM, Nafion 212, DuPont) by hot pressing to form a catalyst-coated membrane (CCM). The fabrication process is detailed elsewhere.4 The CLs were fabricated with various I/C ratios and various dispersion processes. The I/C ratio was 0.5, 1.0, and 3.0. A CL was fabricated from a catalyst ink dispersed by a wet pulverizing and dispersing device (Star Burst Minimo, Sugino Machine) instead of the ultrasonic homogenizer to evaluate the effects of the dispersion process on the structure of the CL. The device pulverizes and then disperses particles in the dispersion medium by collision with a ceramic ball under high-pressure conditions. This novel dispersion method has recently applied to the dispersion of materials in various fields including PEFCs.36 This method can affect not only particle size but also a surface function of particles by adding surface functional groups in a wet high-pressure environment. However, the effects of this dispersion method on Pt/C and ionomer in catalyst inks are not clear. In the present study, structural analysis of the CL fabricated from a catalyst ink dispersed by the wet pulverizing and dispersing device was conducted and discussed the effects on the porous structure. The ink was processed two times at 180 MPa. The process was taken only a few minutes.
Two-stage ion-beam processing and image processing
A schematic of the TS-IBP is shown in Fig. 2. The first stage of the TS-IBP is the formation of the flat and smooth cross-section by a broad ion beam of an ion-milling machine (E-3500, Hitachi High Technologies). The milling width was approximately 1 mm (Fig. 2a). The acceleration voltage was 5 kV, and the ion-beam current was approximately 130 μA. The second stage is the selective removal of the materials in the CL by a FIB (SMI2050, Hitachi High-Tech Science). The FIB was incident in a vertical direction to the cross-section of the CCM (Fig. 2b). The acceleration voltage was 30 kV, and the ion-beam current was 10 pA. A typical result of the TS-IBP is indicated in Fig. 2. A flat and smooth cross-section of the CL was obtained after the first stage (Fig. 2c). The second stage was applied to the part of the area treated by the first stage (Fig. 2d). The scanning area to analyze through-plane ionomer distribution was approximately 3 × 10 μm2.

Figure 2. A schematic of two-stage ion-beam processing that consists of (a) a broad ion milling as the first stage and (b) an FIB process as the second stage. (c) and (d) are scanning ion microscopic images of a CL processed by the first and second stages, respectively. A dashed frame indicates the area where the second process was conducted.
Download figure:
Standard image High-resolution imageA preliminary experiment was conducted to characterize the etching properties of Pt/C and the ionomer by the FIB process. Figures 3a and 3b shows top surface and cross-section of Pt/C packed layer, respectively. Notably, this layer does not contain ionomer. A flat area in the center of the cross-section was formed by a high-powered FIB process as a marker to find a processed area. The FIB processed surface is indicated by a dashed square. The surface showed less damage by the FIB process, although 30 min of the process was conducted. Figures 3c and 3d shows the top surface and cross-section, respectively, of the ionomer layer formed by a spin-coater. The thickness of the layer was ca. 3 μm. The film was completely removed by 10 min of the FIB process. The etching rate of ionomer is much greater than that of the Pt/C; therefore, the ionomer is selectively removed from the CLs by the FIB process in TS-IBP.

Figure 3. (a) Top surface and (b) cross-section of Pt/C packed layer processed by FIB in 30 min (c) Top surface and (d) cross-section of an ionomer layer processed by FIB in 10 min.
Download figure:
Standard image High-resolution imageScanning ion microscopy (SIM) images were obtained after the first stage and every 5 min during the second stage. The ion-beam current for the SIM observation was 1 pA to avoid damage of the specimen by the ion beam during the observation. A smoothing filter was applied to the obtained SIM images. Binary image processing was conducted to ensure adequate materials and pores distributions. All of the SIM images in the second stage were binarized for evaluation of the solid volume fraction. The processing time was determined to ensure that volume fraction of the binarized image corresponds to the set value shown in Table I. The binarized image after the second stage corresponds to the Pt/C distribution map. The SIM image after the first stage was combined with the image after the second stage to improve the reliability of the binarization process. The combined image was then binarized to obtain an overall solid and pore distribution map. The threshold was determined by the percentile of the pore area to the area of the other regions, which is known in advance. Finally, the ionomer distribution map was obtained by subtracting the carbon distribution map from the overall solid distribution map.
Table I. The volume fraction of materials and pores of CLs with the variation of I/C corrected by primary pore volume.
| I/C | Pt/C + Primary pores | Ionomer | Secondary pores |
|---|---|---|---|
| 0.5 | 0.45 | 0.08 | 0.47 |
| 1.0 | 0.49 | 0.17 | 0.34 |
| 3.0 | 0.48 | 0.50 | 0.02 |
In this study, the pixel resolution of the SIM images was 20 nm. Ideally, a pixel that contains ionomer in more than half of the pixel area, which corresponds to 10 nm in thickness, is interpreted as an ionomer area during image processing. On the other hand, a pixel that contains ionomer in less than half of the pixel area is interpreted as a pore area or Pt/C area during image processing. The distributions of ionomer thickness, tionomer, and the coverage by ionomer thicker than 10 nm were analyzed using an in-house program. Its procedure is as follows.
Step 1: Search Pt/C pixels that contact ionomer pixels.
Step 2: Search the nearest pore pixel from a Pt/C pixel found in Step 1.
Step 3: If all pixels that contact with a line segment of centers of the Pt/C and pore pixels are ionomer pixels, then the ionomer thickness is the line segment. The line segment was determined by Bresenham's line algorithm.37 Otherwise, repeat from Step 2.
Step 4: Repeat Step 2 and Step 3 for all Pt/C pixels found in Step 1.
Ionomer coverage was defined as the ratio of the number of ionomer pixels to all pixels with the exclusion of Pt/C pixels in eight pixels around a Pt/C pixel as shown in Fig. 4. The coverage of all pixels of Pt/C that contact with the pixels of ionomer was evaluated and shown as a coverage level distribution.

Figure 4. A schematic of analysis of ionomer thickness and ionomer coverage.
Download figure:
Standard image High-resolution imageThe agglomerate size distribution of the Pt/C and the secondary pore size distribution were analyzed using the ImageJ program and its plugin BoneJ,38 which defines the size at a point as the diameter of the greatest sphere that fits within the structure and which contains the point.39,40
Results and Discussion
Evaluation of thickness and porosity of the CLs with various I/C
Catalyst inks with various I/C ratios were applied by the doctor blading with the gap of 150 μm to fabricate CLs. Relatively thicker CLs were fabricated to make an analysis by the TS-IBP method easy. The porosity of the CLs with various I/C ratios was obtained by the weight measurement method.15 The actual thickness of the CL, tCL, was measured from the cross-sectional image. The superficial thickness (assuming zero porosity), tcompact, was calculated from the loading of carbon, platinum, and ionomer using the following equation:

where mC, mPt, and mI are the loading weights per unit area of carbon, platinum, and ionomer, respectively, and ρC, ρPt, and ρI are the densities of carbon, platinum, and ionomer, respectively. These densities were assumed to be 1.8, 21.45, and 2.0 g cm−3, respectively. The porosity from the weight measurement, εall, is then obtained by the following equation:

Here, the carbon black (Ketjenblack EC300J, Lion Specialty Chemicals Co., Ltd.) used for Pt/C has a porosity of 60% itself as primary pores (The specification was provided by the manufacturer). The primary pores are, therefore, contained in the carbon distribution map as the carbon part in the TS-IBP method. Table I shows the volume fraction of materials and pores of CLs with the variation of I/C from 0.5 to 3.0. The volume fraction of the primary pores, which is between 25% and 30%, was included in the category of Pt/C. The volume fraction of Pt/C including primary pores is almost constant in all CLs, which is between 45% and 50%.
Two-stage ion-beam processing of the CLs with various I/C
The ionomer distribution of the CLs with the variation of I/C was analyzed as shown in Fig. 5. The cross-sections of the CL after the first stage and after the second stage (the first and second images from the left in Fig. 5, respectively) show substantially different structures. The bottom edge of each image is the interface between the CL and a PEM. The etching rate of ionomer in the second stage was lower than that of the ionomer layer shown in Fig. 3. Existent of Pt/C, adsorption of ionomer on Pt/C and thermal conductivity of the CLs can affect the etching rate. Additionally, excess processing in FIB leads to significant damage to Pt/C and shrink of the porous structure. Therefore, we conducted a time-lapse analysis and determined an optimum processing time. The processing time of the second stage was varied from 15 to 40 min depending on ionomer content to ensure that the volume fraction of the binarized image corresponds to the set value shown in Table I. The ionomer was assumed to be completely removed, leaving Pt/C in the second stage of the TS-IBP. Thus, the SIM image after the second stage was then image-processed to make a binary image and a Pt/C distribution map was obtained. Here, Pt/C particles polished by ion beam in the first stage showed flat and smooth surface and looked different from the original spherical particles. However, a simple binarize process was unable to segregate the particles that are not on the real cross-section from the images. Therefore, such particles were manually removed from the images in advance. The threshold to separate the Pt/C phase and pore phase was determined to fit with the volume fraction obtained in Table I. A pore distribution map was obtained from a combined image of the SIM images after the first stage and the Pt/C distribution map. The threshold was determined by a percentile method to fit with the set I/C value. The ionomer distribution was extracted from the Pt/C and pore distribution maps. A complex image of Pt/C, ionomer, and pore distribution maps is the third image from the left in Fig. 5. The through-plane one-dimensional profile (right figure in Fig. 5) was also obtained from the distribution maps. The lower side in the figures (at 0 μm in thickness) is the interface with a PEM, and the upper edge is the bottom in the fabrication process (a contact surface with the PTFE film) before the decal-transfer process. The through-plane ionomer, pores, and Pt/C distributions are almost homogeneous in all I/C conditions, although the other fabrication parameters can affect the through-plane distributions. Under the fabrication conditions used in the present study, a thin ionomer layer was formed at the interface with the PEM with increasing I/C ratio. The interface is the drying surface in the fabrication process of the CLs because of deposition of ionomer during solvent evaporation in the fabrication process. Pt/C particles are larger and denser than ionomer; therefore, Pt/C particles could settle faster than the ionomer.41 When the catalyst ink dries, the ionomer concentration increases; some of the ionomer cannot diffuse into the carbon porous network, instead depositing onto the surface.

Figure 5. Two-stage ion-beam-processed images and material distributions. SIM image after the first process and second process, image-processed material mapping and through-plane materials and pores profile from left to right. The I/C ratio of the CLs is 0.5, 1.0, and 3.0 from top to bottom, respectively.
Download figure:
Standard image High-resolution imageIdeally, a larger amount of ionomer is required near the PEM side of a CL for proton transfer considering through-plane proton flux in the CLs.24 The ionomer distribution can be determined by materials and fabrication processes. This developed method can work as an effective method to analyze the through-plane distribution of ionomer.
Effect of I/C on ionomer distribution and Pt/C agglomerate size
The ionomer thickness distribution and the coverage level distribution are shown in Fig. 6. Ionomer thickness increases with increasing I/C ratio. The covered area of Pt/C by an ionomer thicker than 10 nm also increases with increasing I/C ratio. The average thickness of the CLs with I/C ratios of 0.5, 1.0, and 3.0, as obtained by this analysis method, was 23, 29, and 172 nm, respectively. Ionomer thicker than several tens of nanometer surely exist in the CLs. The maximum thickness of the ionomer in the CL with an I/C ratio of 0.5 was 120 nm, whereas that in the CL with an I/C ratio of 1.0 was greater than 200 nm. Here, the coverage of 0% is the most dominant at I/C ratios of 0.5 and 1.0, introducing the possibility that a certain amount of ionomer with a thickness less than 10 nm can exist. However, in the case of I/C 1.0, the coverage of 0% substantially decreased from the case of I/C 0.5 and the other coverage level was increased. Especially, the coverage of 100% showed a substantial increase. The existence of thicker ionomer leads to the increase of oxygen transfer resistance in the catalyst layer because oxygen diffuse in ionomer film to access to Pt particles. In addition, ionomer thicker than 10 nm can affect secondary pores. As the result, effective diffusivity and tortuosity of the CLs can be changed. On the other hand, thicker ionomer can increase proton conductivity. However, further studies and discussion on three-dimensional ionomer distribution and coverage by thinner ionomer are needed. The resolution of SIM images in the present study was not enough to detect single-nanoscale ionomer. FIB systems have the potential to take SIM images with higher resolution. However, taking images avoiding damage of ionomer is a challenge. As the other options, using FIB-SEM or conducting collaborative works with other techniques such as TEM and nano-CT can help to understand both overall ionomer distribution in the CL and single-nanoscale ionomer as well.
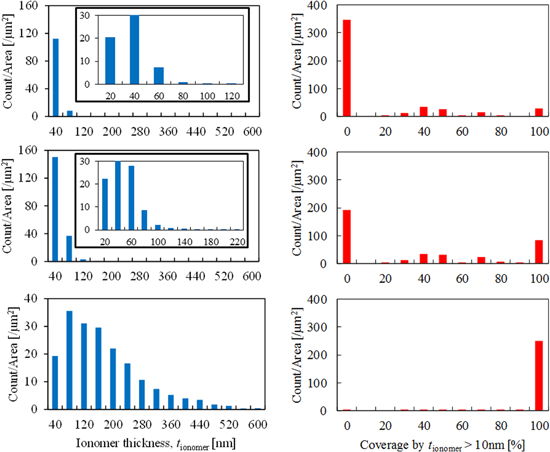
Figure 6. Ionomer thickness distribution and coverage level distribution. The I/C ratio of the CLs is 0.5, 1.0, and 3.0 from top to bottom, respectively.
Download figure:
Standard image High-resolution imageFigure 7 presents the agglomerate size of Pt/C and the secondary pore size distribution. An increase of the particle size and decrease of the pore size are shown as an increase of the I/C. The average particle size corresponding to I/C ratios of 0.5, 1.0, and 3.0 was 170, 200, and 340 nm, respectively. The average pore size corresponding to I/C ratios of 0.5, 1.0, and 3.0 was 120, 90, and 55 nm, respectively. The secondary pores were filled by ionomer, as reported in the previous paper,15 and the average pore size decreased as a result. Almost no pores were observed in the sample with an I/C ratio of 3.0. A depletion effect42 can potentially explain why the agglomerate size increases with increasing I/C ratio. Depletion forces arise from the osmotic pressure between the bulk solution that contains polymer at a certain concentration and the polymer-depleted zone between the two surfaces free of polymer. The forces work as an attractive force among particles, leading to agglomerate formation.
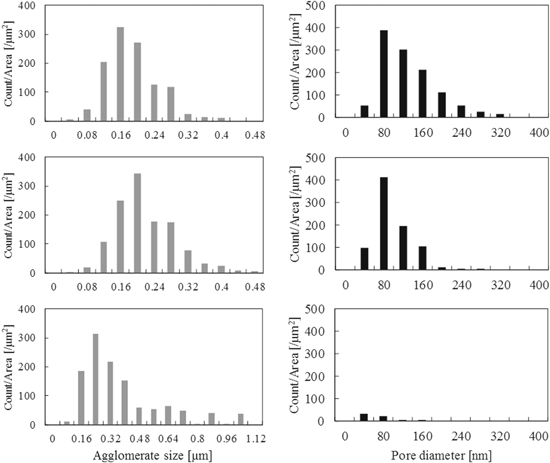
Figure 7. Agglomerate size distribution and pore size distribution. The I/C ratio of the CLs is 0.5, 1.0, and 3.0 from top to bottom, respectively.
Download figure:
Standard image High-resolution imageEffect of dispersion method on ionomer distribution and Pt/C agglomerate size
A CL was fabricated from a catalyst ink dispersed by the wet pulverizing and dispersing device to evaluate effects of dispersion process on the CL structure. The I/C ratio was 1.0. The blading gap was 100 μm, which was two-thirds of that to fabricate the ultrasonicated CLs. The amount of coated CL on a unit area was 0.72 mg cm−2, whereas that of the ultrasonicated CL with I/C 1.0 was 1.1 mg cm−2. The amount of the coated CLs was exactly proportional to the blading gap. In the previous study,2 it was indicated that the thickness of CLs does not affect porosity and pore size distribution. Therefore, the difference of the blading gap does not affect the following discussion. In addition, the thickness of the wet-pulverized CL was 6.4 μm, whereas that of the ultrasonicated CL fabricated by the same blading gap as the wet-pulverized CL was 8.2 μm. This difference resulted in the difference in porosity as follows.
The volume fraction of Pt/C, ionomer, and pores corrected by primary pores were 56, 20, and 24, respectively. In the comparison between the CL dispersed using the ultrasonic homogenizer and the CL dispersed using the wet pulverizing and dispersing device, the thickness and the porosity of the latter CL was lower than those of the former CL.
The Pt/C, ionomer, and pore distributions obtained from TS-IBP, as shown in Fig. 8. The ionomer thin layer observed in the sonicated CLs was not observed on the surface of the CL. Figure 9 presents distributions of ionomer thickness, coverage, agglomerate diameter, and secondary pore diameter. The average ionomer thickness was 30 nm, which is the same as the CL dispersed with the centrifugal mixer and ultrasonic homogenizer. However, the average Pt/C agglomerate diameter was 170 nm, which is smaller than the diameter of the sonicated CL. The wet pulverization and dispersion processes effectively reduced the agglomerate size of Pt/C particles, although the process did not work to substantially reduce the ionomer agglomerate. This decrease of agglomerate size might result in lower thickness and porosity because small agglomerates bury large pores. Actually, the pores larger than 160 nm in diameter substantially decreased in the wet-pulverized CL from the comparison of pore size distribution in Fig. 7 and Fig. 9.
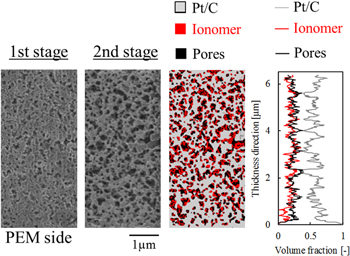
Figure 8. Two-stage ion-beam-processed images and material distributions of the wet-pulverized CL. From left to right: SIM image after the first process and second process, image-processed materials maps, and the through-plane materials and pore profile.
Download figure:
Standard image High-resolution image
Figure 9. (a) Ionomer thickness distribution, (b) coverage level distribution, (c) agglomerate size distribution, and (d) pore size distribution of the wet-pulverized CL.
Download figure:
Standard image High-resolution image
Not only the processing methods but also processing conditions including power, time and throughput are important. The ultrasonication might realize smaller agglomerate size by taking longer processing time and/or larger power. However, the rise in temperature is a problem. Taking the balance of high dispersibility and suppression of the rise in temperature leads to longer processing time. The wet pulverizing and dispersing method can realize higher dispersibility of the slurry in a shorter time.
Decreasing particle diameter strongly affects particle sedimentation during the drying process in the CL fabrication procedure, as indicated by Stokes' law, which expresses the particle settling velocity as a function of the squared particle diameter.43 The smaller the particle diameter, the slower the particles settle.41 This difference changes the balance of diffusion and sedimentation during the drying process, even under the same drying condition. As a result, an ionomer thin layer might not form in the wet-pulverized CL.
Conclusions
The TS-IBP of the CL, which consists of a first stage of a broad ion beam to have a flat cross-section and a second stage in which the FIB is used to remove material selectively, was conducted. The etching rate of ionomer is much greater than that of Pt/C by the FIB in the second stage. SIM images of an overall through-plane cross-section of the CLs were obtained after the first and second stages, respectively. Although the image after the first stage shows a cross-sectional porous structure that consists of Pt/C and ionomer, the image after the second stage shows a porous structure that consists of only Pt/C. The Pt/C, ionomer, and pore distributions were obtained by image processing of the SIM images. The threshold was determined by fitting with volume fractions of the materials and pores, which were obtained from the thickness and weight measurements of the CLs. The CLs with I/C ratios of 0.5, 1.0, and 3.0 were analyzed. Through-plane material distributions were almost homogeneous in all of the CLs. However, with increasing I/C ratio, a thin ionomer layer was observed at the interface with the PEM. This observation can be attributed to ionomer deposition on the drying surface during solvent evaporation during the fabrication process. The drying surface contacted the PEM because the CL was fabricated by the decal-transfer method. The average thickness of the ionomer, which covers Pt/C in the three CLs, was 23, 29, and 172 nm, respectively. The maximum thickness of ionomer increased on the order of several hundreds of nanometers with increasing I/C ratio. The dispersion process, which was ultrasonication or wet-pulverizing with high pressure, did not affect the ionomer distribution and average thickness substantially, whereas the agglomerate size of Pt/C decreased when the wet-pulverizing process was conducted.
The TS-IBP developed in this paper has the potential to clarify through-plane ionomer distribution in the CLs, which can be determined from material and fabrication process parameters via a relatively simple method using lab-scale and general-purpose equipment. Therefore, this processing can be easily applied for the analysis of the CLs with the variation of the fabrication parameters. This approach can aid in understanding the formation mechanism of material distribution in the CL and in the design of high-performance CLs.
Acknowledgments
This work was supported by JSPS KAKENHI [grant numbers 15H03932, 18H01383]. A part of this work was supported by Nanotechnology Platform of MEXT, Grant Number JPMXP09F17OS0019.