
Abstract
The mass electrification of personal and service vehicles is reliant on the ability of battery packs to undergo extreme fast recharging. A central challenge is that the repeated exposure to high currents can trigger and/or accelerate mechanisms of performance degradation, such as lithium deposition, mechanical damage of active material particles, and impedance rise. Here, we investigate whether constraining high-rate charging to limited state-of-charge (SOC) ranges can mitigate these aging processes. Our experiments map the boundaries of lithium plating conditions, and also indicate that permanent losses of electrode capacity appear to be a function of cycle number, but not charging rate. Interestingly, we show that impedance rise appears to depend on charging rate alone, and not on the amount of charge passed at each cycle. This observation suggests that limiting fast charging to a narrow SOC range would only delay cell aging, but not fully prevent it from happening. We identify oxide-particle cracking as the likely mechanism for this impedance rise, suggesting that particle and electrode design are essential to enable fast charging. The findings of this work can inform the development of fast-charging protocols that are less damaging to cell health.
Export citation and abstract BibTeX RIS

This is an open access article distributed under the terms of the Creative Commons Attribution 4.0 License (CC BY, http://creativecommons.org/licenses/by/4.0/), which permits unrestricted reuse of the work in any medium, provided the original work is properly cited.
The development of fast-charging capabilities for Li-ion batteries is vital to achieve wider adoption of electric vehicles (EVs) but expectations for this "refueling" technology have drastically changed in the past few years. The conventional view was that fast charging would have a supportive role in the recharging network, being sparingly utilized and mostly during long distance travel. A recent report studying the refueling habits of current EV owners, however, shows a very different trend.1 Many EV owners around the world, especially ones in areas of high demographic density, have little or no reliable access to conventional low-power charging at their residence or workplace, and rely on currently available forms of rapid charging (∼1 h) as their primary source of energy. Moreover, the deployment of EVs for public transportation and in commercial fleets could be more financially and logistically advantageous if battery packs could be quickly replenished during brief service intervals.2,3 To this end, automotive battery technology needs to better adapt to these demands, becoming resilient to the repeated exposure to high charging currents.
A central challenge imposed by this frequent utilization of fast charging is that it can accelerate battery aging. On a general level, operation at high power can cause large increases in the internal temperature of the cell, which in itself can have detrimental effects on cell longevity.4,5 Additionally, many previous works report that repeated charging at elevated rates can contribute to impedance rise, decreasing the ability of cells to continuously deliver high power.6 Part of this impedance rise has been attributed to the cracking of oxide particles in the cathode, promoted by a non-uniform strain distribution caused by rapid Li+ extraction from the lattice.7,8 This, and other mechanisms, can eventually lead to mechanical failure in localized regions of both electrodes, which become unresponsive to charge.9–12 Moreover, high charging currents will increase polarization of the graphite anode, nudging it towards lithium plating potentials. At high enough currents, the overpotential for direct lithium reduction becomes negative and lithium deposition starts to compete with intercalation for the incoming Li+ flux.13 This plated lithium decreases the inventory of cyclable Li+ in the cell, and chemically reduces surrounding electrolyte species. These latter reactions can release gaseous byproducts,14 which can coalesce into bubbles that will block the Li+ ion flow, possibly inactivating entire portions of the cell.2 In addition to these performance issues, Li plating also deteriorates the safety characteristics of the cell.15 What makes Li deposition especially problematic is that the conditions for its occurrence need not to be fulfilled over the entire area of the graphite anode: non-uniform aging can locally drive the cell into plating conditions. Composite electrodes are inherently heterogeneous reacting media,16 and many of the aging mechanisms discussed above will create even more heterogeneity, which will contribute to additional aging in a self-reinforcing loop. This phenomenon explains why cells can operate for hundreds of cycles before undergoing roll-over failure due to lithium deposition,17 and why certain portions of the electrode can experience higher rates of aging than others.7,18–20
With such a range of consequences, it is not surprising that aging due to fast charging appears to be highly system- and testing- specific. For fast-charged cells containing graphite and Li(NixCoyMnz)O2 (x+y+z = 1), many studies portray the loss of Li+ inventory as the major source of capacity fade upon repeated cycling2,19; other works present electrode inactivation as playing an even more critical role.11 Furthermore, fast charging can lead to permanent charge losses in both electrodes,17 or confined damage to the cathode11 or anode.21,22 In some cases, impedance rise scales with capacity fade,19 but this may not always be the case.11 For the latter, impedance rise has primarily been attributed to solid electrolyte interphase (SEI) growth,23 cathode cracking,24 or gassing.2 In the face of this variance, literature on aging due to fast charging can be instructive in terms of understanding experimental reasoning and approaches, but a direct transference of the findings to different systems and/or test conditions is challenging.
In this study, we investigate how the application of high charging rates (1C to 8C) can contribute to power loss in cells containing Li1.03(Ni0.5Co0.2Mn0.3)0.97O2 (NCM523) and graphite (Gr) electrodes. Accelerated aging tests within constrained ranges of states-of-charge (SOCs) are used to evaluate the effect of high currents on cell impedance. Our experiments show that impedance rise certainly depends on rate, but surprisingly not on SOC range; this observation suggests that limiting the amount of recharging that is done at high rates can postpone impedance rise, but not fully prevent it. We also identify combinations of rate and SOC in which Li plating becomes problematic and show that it can be more severe at moderate rates, when higher states-of-charge can be achieved within the same voltage window. The findings of this study will be used to inform the development of fast-charging protocols, aimed at supporting the U.S. Department of Energy goal of enabling battery recharge in ∼15 min.25
Experimental
Materials
Electrochemical studies were performed using Li1.03(Ni0.5Co0.2Mn0.3)0.97O2 (NCM523) cathodes and graphite (Gr) anodes. The positive electrode contained 90 wt% active oxide (Toda), 5 wt% conductive additive (C45, Timcal) and 5% poly(vinylidene difluoride) binder (PVdF, Solvay 5130), coated on a 20-μm-thick battery-grade Al foil. The cathode was coated to a total loading of 18.6 mg cm−2 and calendered to a final thickness of 71 μm (35.4% porosity). The negative electrode contained 91.8 wt% graphite (Superior Graphite SLC1506T), 2 wt% C45 and 6 wt% PVdF binder (KF-9300, Kureha); 0.2 wt% oxalic acid was added to the slurry to improve adhesion to the 10-μm-thick battery-grade Cu current collector. The total anode loading was 9.9 mg cm−2, corresponding to a calendered thickness of 70 μm at 34.5% porosity. Full-cells assembled with these electrodes have a ratio of negative and positive electrode capacities (N/P ratio) of ∼1.3 at 4.1 V. Electrodes were fabricated at the Cell Analysis, Modeling and Prototyping (CAMP) Facility at Argonne National Laboratory (ANL). Electrodes were cut into 1.58 cm2 discs and dried overnight at 120 oC under dynamic vacuum before use. The electrolyte was a 1.2 mol l−1 solution of LiPF6 in 3:7 w/w ethylene carbonate (EC) and ethyl methyl carbonate (EMC), procured from Tomiyama. All tests were carried out in 2032-type cells, using 2320 Celgard trilayer separator and 40 μl of electrolyte (4 times the total pore volume in the cell).
Electrochemical testing
NCM523//Gr cells were cycled at 30 oC in a Maccor 2300 battery tester. To begin, all cells underwent formation cycles consisting of two cycles at C/10 and one at C/25 (3.0–4.1 V). Subsequently, testing consisted of a series of high-rate pulses, capacity-limited constant-current charges, and slow diagnostic cycles (Fig. 1).

Figure 1. Schematic representation of the test sequence that was repeated until test-termination conditions were met (see Fig. 2). The sequence starts with a C/5 charge to 3.8 V followed by 10 s 3C pulses after 1 h holds at 3.8 V and at 3.65 V, to determine cell impedance. The following two aging cycles comprise a capacity-limited xC charge (x = 1, 2, 4, 6, 8), and a C/5 discharge to 3.0 V until the current decreased below C/100. Periodically, C/25 cycles were conducted to track cell capacity and capacity fade.
Download figure:
Standard image High-resolution imageThe cycles containing the constant-current charge are referred to as aging cycles, while the pulse-current and slow cycles were used to determine cell impedance rise and capacity fade, respectively. Cell discharge before and after the constant-current charge was performed at C/5, with a hold at 3.0 V until the current decreased to C/100. For every constant-current charge, tests included a range of terminal SOCs, as indicated in Fig. 2a. Note that these terminal SOCs are defined in terms of initial capacity rather than cell voltage, leading to accelerated aging: Li+ loss and impedance rise will expose the cathode to higher potentials in subsequent cycles to meet the capacity target (Fig. 2b), magnifying aging mechanisms.

Figure 2. Experiment overview. (a) Likelihood of Li plating at various rates and SOCs (see color code), determined from tests in reference electrode cells. The colored cells indicate conditions that were investigated in the experiments. (b) Evolution of cell voltage cutoff during capacity-limited charge for a cell cycled at 1C to 60% SOC. Steady discharge capacities are sustained by progressively extracting more Li+ from the cathode during charge, increasing full-cell voltage. (c) Termination conditions for cells tested at various combinations of rate and SOC. For example, tests on 8C/30 cells were terminated because their ASI has reached 40 Ω-cm2, tests on 4C/60 cells because cell voltage exceeded 4.8 V during charge, and tests on 1C/60 cells because they completed 100 aging cycles.
Download figure:
Standard image High-resolution imagePulses and diagnostic cycles are performed every two and every twenty charges, respectively. Impedance was measured from voltage changes following the application of 10 s 3C pulses at 3.65 V and 3.8 V; only the data collected during discharge pulses at 3.8 V are shown here, as similar trends were observed at 3.65 V and during the charge pulses. Diagnostic cycles were performed in the 3.0–4.1 V range at a C/25 rate.
This series of current-pulse cycles, fast-charge cycles, and slow cycles was repeated until one of the following conditions were met: (i) the area-specific impedance (ASI) of the full-cell reached 40 Ω cm2 (this is the ASI of NCM523//Gr cells after 400 h of potentiostatic hold at 4.39 V,26 and corresponds to an average ASI increase of ∼75%; (ii) cell voltage exceeded 4.8 V during the constant-current charge to meet the target capacity-limit; or (iii) 100 partial cycles were completed. Partial cycles correspond to the number of aging cycles applied to the cell, as opposed to equivalent full cycles, which are counted in terms of the number of 100% ΔSOC swings that are cumulatively completed by the cells.27 For simplicity, cycle numbers (partial and equivalent) discussed in this manuscript refer to the number of capacity-limited cycles endured by the cell, and do not include the current-pulse and diagnostic steps. 100% SOC was defined as 3.9 mAh (2.47 mAh cm−2), which is the typical initial C/25 cell capacity, and 1C was assumed to be 3.11 mAh (1.97 mAh cm−2); at this current, a fully-charged full-cell will reach the end-of-discharge in 1 h. Cells will be referred to by their test conditions, as in 4C/60 to indicate the cell charged at 4C to 60% SOC during its aging cycle.
Selected cells were disassembled at the end of testing and the "harvested" electrodes were used as-extracted to build half-cells; these electrodes were cycled at C/100 rate to quantify permanent losses of electrode capacity. Cathode and anode half-cells were cycled in the 3.0–4.1 V, and 0–1.5 V ranges, respectively. Cells containing the harvested anodes were delithiated, and those containing the harvested cathodes were relithiated, prior to this C/100 cycle.
Experiments with 3-electrode cells used a custom setup that is described in detail elsewhere.26,28 In brief, the cell contained a 20.3 cm2 cathode and anode, spaced by two layers of Celgard 2320 separator. A thin copper wire (25 μm) with a ∼2 mm exposed tip was positioned in between the separators. A Li micro-reference electrode was formed in situ by extracting Li+ from the cathode and plating it on the Cu wire; the charge transferred during this lithiation process is negligible compared to the total capacity in the cathode.
Results
SOC selection and test characteristics
Figure 2a represents the terminal SOCs studied at each constant-current charging rate. At the highest rates (8C, 6C and 4C), the maximum state-of-charge to which cells can be safely exposed is limited by the likelihood of Li plating. At high enough currents, there is a threshold SOC above which the anode potentials become negative (vs Li/Li+) and deposition of Li metal starts to compete with Li+ intercalation into graphite; the higher the SOC, the more favored the plating reaction is Ref. 28. The color code of Fig. 2a indicates the likelihood of lithium plating according to 3-electrode tests using a Li/Cu micro-reference electrode; red indicates that plating is likely to occur at early cycles, blue that it could become possible after aging, and gray that it is unlikely in the duration of our tests given the initial electrode potentials. These testing conditions are expected to establish clear limits for safe cell operation at high rates, and to reveal trends about how fast charging causes cells to age. A peculiarity of our tests is that cell voltage was allowed to float freely to meet the charge capacity targets. Consequently, side reactions leading to the consumption of Li+ inventory will increase the effective charge cutoff voltage in the following capacity-limited cycles, as formerly untapped Li+ is extracted from the cathode lattice; increased polarization due to ASI rise would cause similar effects. This is clearly seen in Fig. 2b, which shows the C/5 discharge capacities (black) and the charge cutoff voltages (orange) following successive 1C charges to 60% SOC. Cell aging forces the charge cutoff voltage to increase from 3.78 V to 3.83 V to drive a same amount of Li+ to the anode. Thus, in our experiments both aging mechanisms—capacity fade and impedance rise—are expected to expose the cathode to conditions that are progressively more aggressive, making aging effects visible after a relatively small number of cycles.
Given the variety of ways through which fast charging can cause aging, test termination conditions varied widely among the cells (Fig. 2c). Cells tested at moderate rates (1C and 2C) and at lower SOCs were able to complete 100 partial cycles; the ones exposed to the highest SOCs at rates ≥ 4C lost Li+ quickly due to plating, and were terminated due to excessive cell voltage polarization during charge; finally, the 6C/30 and 4C/60 cells were interrupted due to exhibiting large impedance rise.
Capacity fade
Cell capacities measured by the diagnostic cycles (C/25, 3.0–4.1 V) are shown in Fig. 3. In most cases capacity was lost quasi-linearly throughout the test, while certain systems operating at elevated rates and SOCs (8C/30, 6C/40, 4C/80 and 4C/60) transitioned into a precipitous failure. These qualitative traits have been universally reported during aging of Li-ion batteries containing various electrodes and tested at various conditions.17,22,23,29–31 The initial region of quasi-linear fade is generally considered to be dominated by Li+ inventory losses to graphite's SEI, and also bears the contribution from a slow and steady impedance rise in the cells.23,31 The sudden "roll-over" failure, on the other hand, has been associated with high levels of impedance rise (Ref. 32) and/or the initiation of additional mechanisms of capacity fade, such as Li plating.17,19 The possible occurrence of Li deposition in cells tested at the more extreme conditions was anticipated in our experiment design (Fig. 2a), and confirmed by visual inspection of electrodes at the end of the test (Fig. 3f). Although the electrodeposition of lithium during fast charging is a partially reversible phenomenon,23 capacity fade can occur due to the electronic isolation of Li domains (forming "dead" lithium) and due to chemical reduction of electrolyte at the surface of Li nuclei.33 As will be discussed below, cells that entered lithium plating conditions exhibited the highest levels of impedance rise, suggesting that the latter could also be contributing to the capacity fade measured by the diagnostic cycles.
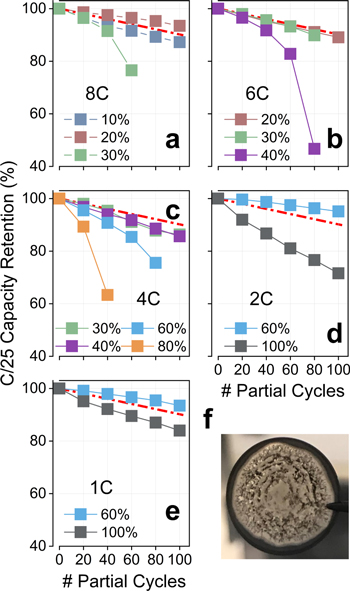
Figure 3. Retention of C/25 discharge capacities (relative to capacities measured during the final formation cycle): Panels a–e present data for cells tested at the indicated rates and terminal SOCs, while panel f shows a photograph of the anode harvested from a cell tested at 6C to 40% SOC. The capacity loss of a baseline cell tested at 0.5C to 100% SOC is indicated by a red line. In the absence of Li plating, cell capacity fades quasi-linearly with cycle number.
Download figure:
Standard image High-resolution imageInterestingly, cells that only exhibited a quasi-linear capacity fade presented similar levels of Li+ loss at the end of the test. This lost capacity was also comparable to that measured for a baseline cell cycled at 0.5C to 100% SOC (red lines in Fig. 3), suggesting that, in these cases, the dominant fade mechanisms were nearly independent of the depth of charge. Clear exceptions to this general behavior were cells tested at 1C/100 and 2C/100, especially the latter. We note that these cells were at the threshold of lithium plating conditions at the beginning of the test (Fig. 2a), and that some Li deposition may have contributed to the observed capacity loss. Nevertheless, unequivocal signs of plating were not present in anodes harvested from these cells.
Impedance rise
Trends observed for impedance rise are exemplified by Figs. 4a, 4b. In general, a quasi-linear increase in ASI as a function of partial cycles was observed when charging was constrained to low SOCs. Some of the cells charged to high SOCs, however, eventually deviated from this linearity, showing a drastic increase in ASI. Systems that exhibited this latter behavior also displayed accelerated capacity fade (Fig. 3), suggesting that this rapid ASI rise could be correlated with Li plating. In our accelerated aging tests, Li+ loss leads to higher cell voltages (and cathode potentials) being accessed in future cycles, as shown in Fig. 2b. With that in mind, the voltage increase of cells undergoing Li plating can be very high, and this sudden spike in cathode potentials can contribute to the observed impedance rise. This becomes clearer in Fig. 5, which contrasts the terminal full-cell voltage during capacity-limited charges (black) with the ASI rise (orange). Figure 5 only shows cells that experienced voltages above 4.3 V during the test, as these were the ones the presented a non-linear impedance variation; in fact, deviations from linearity tended to appear once cells crossed the 4.3 V threshold. The rapid Li+ loss of 8C/30, 6C/40 and 4C/80 led to very high cell voltages at the end of the test, and the corresponding high voltages certainly contributed to the observed impedance rise.
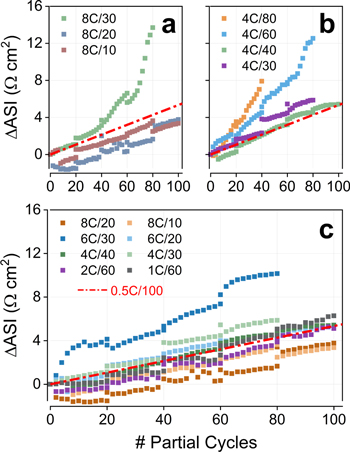
Figure 4. Impedance rise as a function of partial cycles for cells tested at: (a) 8C. (b) 4C. (c) All rates. In panel c only samples that experienced full-cell voltages below 4.3 V are included. The red line indicates the increase in area-specific impedance (ASI) of a baseline cell cycled at 0.5C to 100% SOC. ASI values were measured at 3.8 V using a 10 s 3C discharge pulse.
Download figure:
Standard image High-resolution image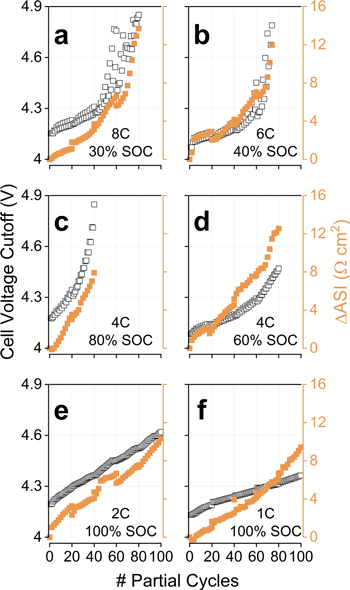
Figure 5. Correlation between full-cell voltage (left-axis, black markers) and impedance rise (right-axis, orange markers) for cells tested at the indicated rates and states-of-charge. These cells eventually experienced voltages above 4.3 V during testing and, in most cases, impedance rise accelerated once past this threshold. ASI values at 3.8 V determined using a 10 s 3C discharge pulse.
Download figure:
Standard image High-resolution imageIn contrast, for cells that remained below 4.3 V throughout the entire test, the increase in ASI continued linearly (Fig. 4c). The rate of this increase was surprisingly very similar for all systems, with the magnitude of ASI rise at the end of the test being similar to the experienced by a baseline cell tested at 0.5C/100 (red line). (6C/30 was a clear outlier, likely due to its high initial impedance rise.) That is, when cell voltage is maintained within "safe" bounds, ASI increases at a similar pace at every partial cycle, regardless of rate or state-of-charge; one cycle at a low rate to a high SOC is just as damaging to the cell as one at a high rate to a low SOC. This observation suggests that higher rates promote a larger impedance rise per 100% SOC variation, which becomes clear when ΔASI is represented as a function of the number of equivalent full cycles (Fig. 6). The ASI rise per equivalent cycle is similar at 8C and 6C (Fig. 6a), which is slightly larger than at 4C (Fig. 6b) and considerably larger than at lower rates (Fig. 6c).
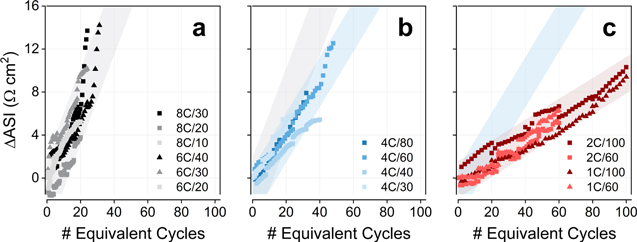
Figure 6. Impedance rise as a function of equivalent full cycles for cells tested at: (a) 8C and 6C. (b) 4C. (c) 2C and 1C. An equivalent full cycle is completed once the accumulated charged SOC reaches 100%. The rate of ASI rise at each panel is approximately constant and independent of the terminal state-of-charge of the capacity-limited charged. ASI values measured at 3.8 V using a discharge pulse.
Download figure:
Standard image High-resolution imageAn interesting feature of Fig. 6 is that, at the rates assembled in each panel, the ASI increase per equivalent full cycle appears to be independent of the SOC range covered in each partial cycle. In other words, at a given charging rate, ASI rise is independent of the limiting SOC of the partial cycles; the "damage" to the cell is a function of rate and rate alone. As will be discussed below, this is extremely significant to the development of fast-charging protocols, as it suggests that limiting the amount of charge that is injected into the cell at higher rates will only postpone the aging mechanisms that cause impedance rise, rather than preventing them from happening.
Electrode damage
Upon completion of the tests described above, electrodes were "harvested" from selected full-cells and re-assembled into half-cells (vs Li metal) to quantify permanent capacity losses. These half-cells were cycled at C/100; at such low rate impedance effects are negligible and most electrode domains still maintaining electronic connectivity should be electrochemically responsive.
Figure 7a shows the C/100 relithiation profiles of the harvested cathode half-cells. All capacities are within 0.1 mAh cm−2 of the measured value for electrodes that just underwent formation cycles (unaged), indicating that a negligible amount of Li+ sites are permanently inactivated during the tests. Half-cells containing electrodes from cells tested under five additional conditions (omitted for brevity) displayed these same trends, in spite of the various levels of ASI rise observed during the experiments. Furthermore, the normalized relithiation profiles (Fig. 7b) indicate that the reaction paths of Li+ sites also remain unchanged.

Figure 7. Cycling profiles of harvested electrodes tested at C/100 rate. (a)–(b) NCM523 cathodes. (c)–(d) graphite anodes. Profiles in panels b and d were normalized to highlight qualitative features. The color code is shown in panel c.
Download figure:
Standard image High-resolution imageHarvested graphite anodes tell a different story. Figure 7c shows that the negative electrode from all analyzed cells exhibit some level of capacity loss, which could be as high as 0.44 mAh cm−2 (∼14% of the electrode capacity). Furthermore, these losses correlate with the number of equivalent full cycles experienced by the various full-cells (Fig. 8a), suggesting that this behavior is simply a response of Gr to successive cycling. Consequently, larger losses were observed at lower rates (1C and 2C) while the severe Li plating noted in some conditions (e.g., 8C/30) did not appear to cause additional loss of the ability of Gr to respond to charge. Inactivation of Gr domains are typically attributed to mechanical damage due to successive cycles of volume change (particularly at edge sites),12,17,22 and severe pore clogging due to the deposition of reduced electrolyte species.34
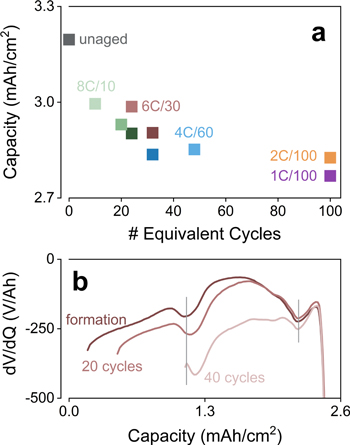
Figure 8. Permanent losses of anode capacity: (a) C/100 delitihiation capacity of harvested graphite electrodes as a function of the total number of equivalent full cycles experienced by the original full-cells. Different rates are shown in different colors, and darker hues denote a higher terminal SOC. (b) Differential voltage curves during C/25 discharges of a cell tested at 4C to 80% SOC. Changes in the distance between adjacent peaks indicate decreased utilization of graphite capacity.
Download figure:
Standard image High-resolution image
Capacity loss of the graphite electrode was also tracked in the full-cells through differential voltage analyses of the C/25 discharge profiles,19 as exemplified in Fig. 8b for 4C/80. In these dV/dQ plots, peaks indicate single-phase regions of Gr, and hence a decrease in the separation between successive peaks denote losses of anode capacity; that is, it indicates that the capacity stored in the plateau in between these two single-phase regions (peaks) has decreased. The dV/dQ analysis generally agrees with the observations in Fig. 8a, which show that capacity loss scales with the number of equivalent full cycles. However, it also indicates that the onset of measurable capacity loss could occur much earlier for cells cycled at higher C-rates; e.g., after 60 equivalent full cycles at 1C/100 and 2C/100, but after only 16 and 18 for 4C/80 and 8C/30, respectively. Thus, although the extent of "damage" to Gr scales with the overall SOC swing experienced by the electrode, capacity loss consistently had an early start in tests at higher rates.
Another interesting feature observed in harvested Gr electrodes is that obvious changes to the staging behavior occurred in one system (4C/80, Fig. 7d). While the graphite domains that remained active presented the expected behavior in all other electrodes,28 the Gr from 4C/80 exhibited interruptions in the two largest plateaus, with a smoother transition to the single-phase segments of the profile. Very interestingly, this distortion in plateaus was not observed when additional cycles at C/100 were performed with the same cell, showing that staging behavior could be restored (Fig. 7d, shown as dashed dark blue line). Our group has observed similar distortions in the past, and they could always be "healed" by a single slow cycle in half-cells. In nearly all cases these distortions occurred in samples that have undergone significant Li plating, suggesting that this is likely a kinetic effect, rather than structural. Given the high levels of capacity fade observed in 4C/80 (Fig. 4c), it is not clear whether the change in plateau could be affecting full-cell operation, nor if a similar "healing" could be achieved in the full-cell itself.
Discussion
The analysis of harvested electrodes indicate that the capacity fade discussed in Fig. 3 arises from three possible sources: decreased Gr activity, impedance rise, and/or losses of Li+ inventory (to SEI or plating). The latter is likely to be playing a dominant role. Differential voltage analysis was unable to detect meaningful loss of anode capacity for cells cycled at milder conditions (lower rate and SOC), and these systems also tended to exhibit very moderate ASI rise (Fig. 4c). This indicates that the linear capacity losses displayed in Fig. 3 can be linked to Li+ consumption by the anode SEI. Moreover, for cells that exhibited Gr damage (Fig. 8a), the overall capacity fade was much larger than the lost by the anode alone, often due to the occurrence of Li plating. In addition to consuming Li+ inventory, the rapid capacity fade caused by Li plating also indirectly decreases the capacity measured in diagnostic cycles due to slippage.35
The cells that exhibited non-linear capacity loss in Fig. 3 appeared to have entered this regime of fade already at the very beginning of the tests, rather than slowly transitioning into a sudden failure. That is, when Li plating was observed, it initiated at very early cycles. From the magnitude of the observed capacity fade, it is possible to conclude that Li deposition is more severe at 4C/80 than at the SOCs explored at 6C and 8C. This confirms the expectation that Li+ reduction is more likely to outcompete Li+ intercalation at high SOCs, even if the cycling rate is lower.28 Our tests clearly define limiting SOCs at high rates, and this knowledge will be useful for future investigations of fast-charging protocol development.
Li plating also appeared to be connected with large increases in ASI. At first glance, it would seem that plating itself could be causing this impedance rise, as the products of chemical reduction of the electrolyte could impair the transport of lithium ions in and out of the anode.36 In a more indirect way, these same reactions could release gaseous byproducts, which aggregate in bubbles that could block the ionic conduction paths in the pores of the electrode and the separator, inactivating domains of the active material.2 Nevertheless, we believe that the impedance rise likely originates at the cathode. Recent works by our group using 3-electrode cells indicated that the impedance of graphite remained invariant after multiple fast charging cycles, even when moderate levels of lithium deposition had occurred.28,37 Furthermore, gas bubbles trapped within pores would likely cause a disproportionate increase of the ohmic contributions to cell impedance, which was not observed in our data. Recall that, in our capacity-limited tests, losses of Li+ inventory are compensated by increasing the cell voltage, extracting additional Li+ from the cathode. Hence, the sudden capacity losses in Fig. 3 cause the increase in cell voltage of Fig. 5, which is in turn followed by a synchronous spike in impedance. Impedance rise is a common consequence of exposing cathodes to high potentials, and is correlated with electrolyte oxidation and/or with the loss of lattice oxygen from sub-surface regions, yielding layers with sluggish Li+ mobility.26 For NCM523, surface reconstruction is certainly possible above ∼4.4 V vs Li/Li+,38,39 and ASI rise can occur continuously at these high potentials.31 This suggests that the high levels of impedance rise noted for some systems could be simply related to the cathode being exposed to high potentials. Our experimental design certainly enhances this effect by forcing a fixed amount of capacity to be extracted from the cathode; in voltage-controlled tests, similar effects could arise due to slippage (Ref. 35) or polarization, but likely at a slower pace.
The cells that did not present a sudden increase in impedance are perhaps even more interesting (Fig. 4c), as their similar pace of aging translates into varying rates of ASI rise per 100% SOC swing (Fig. 6). After a large number of cycles, cells tested at 6C and 8C will have aged more than if they were cycled at lower rates, which is somewhat expected. The surprising observation was that constraining the SOC of each partial cycle did nothing to alter the pace of impedance rise. This suggests that, in these tests in which full-cells never experienced high voltages (i.e., stayed < 4.3 V), there may be an additional mechanism creating this rate-dependency. A natural candidate would be the development of inter-granular cracks in the oxide particles.40 These oxides comprise agglomerates of randomly-oriented primary particles, and the anisotropy of lattice breathing in adjacent grains during successive cycling creates stress.10,41 At high charging currents, non-uniform distribution of states-of-charge within each primary particle can also contribute to this stress, which can eventually be released by the formation of cracks across the grain boundaries.7,8 Electrolyte can permeate through these cracks, reacting with the new surfaces and eventually forming resistive layers.41–43 Hence, higher rates could produce more SOC heterogeneity in the cathode particles, leading to mechanical damage and faster impedance rise due to losses of ionic connectivity among neighboring primary particles. (The invariant capacity of harvested cathodes in Fig. 7a suggests that eventual cracks were unable to completely disrupt the electronic connectivity within secondary particles.) We also note that the SOC range studied here encompasses changes in the NCM523 unit cell volume that are smaller than ∼2%44; within these limits, the mechanical effects imposed by the varying SOCs are possibly superseded by the non-uniform strains imposed by reaction heterogeneity, creating the behavior seen in Fig. 6. Tanim et al. (Ref. 11) recently reported long-term studies using pouch-cells with materials identical to the used here, but with electrodes that were ∼40% thinner. After 400 cycles of fast charging, cracks were clearly visible in cells that experienced rates up to 9C, but not as much when they were limited to 6.8C and below.11 The thicker electrodes used in our study can certainly enhance the non-uniformities in cell operation, causing cracking to become problematic at much lower charging rates. In fact, studies using commercial cells containing electrodes that are presumably even thicker than the ones used here frequently reported cracks at rates below 2C.2,24,27,45 It would then appear that, at high rates, impedance rise due to cracking can only be avoided through engineering particle morphology and electrode design.
These observations are important in the context of fast-charging protocols. The fastest way to recharge a battery is applying very high currents until immediately before entering lithium plating conditions, and then successively decreasing the rate as charging proceeds. Not surprisingly, fast-charging protocols are usually composed of a piecewise combination of charging periods at two or more rates, each contributing to a fraction of the total SOC.6,46 Although such procedures can initially evade Li deposition, they cannot necessarily prevent other mechanisms of aging. Phenomena such as cathode cracking will eventually occur at high rates, increasing the non-uniformity of SOC distribution within the electrode that can "catalyze" the occurrence of additional aging mechanisms, including Li plating. The SOC invariance of ASI increase discussed in Fig. 6 suggests that constraining the amount of charge that is passed at high currents can certainly delay aging, but also that the fate of the cell seems to be inevitable: the same mechanism will continue to slowly cause impedance rise. Minimizing the SOC achieved at high rates to levels much below the recommended to avoid Li plating could be a sensible measure to delay the power fade of Li-ion batteries.
Conclusions
Fast charging protocols are normally composed of initial segments at high rates followed by a progressive decrease in charging current. It is expected that this arrangement can decrease the likelihood of Li plating and minimize cell aging. With that in mind, this study investigated how successive constant-current charges (from 1C to 8C) to varying SOCs (from 10% to 100%) would affect cell health. The trends observed in this work are:
- For most systems, capacity faded quasi-linearly with cycle number and originated primarily from Li+ losses to the SEI. The exception to this behavior stems from conditions in which Li plating occurred. Specifically, for cells that experienced Li deposition, accelerated capacity loss was observed during early cycles suggesting that cells could have entered plating conditions at the start of testing. The combination of moderate rate and high SOC (e.g., 4C/80) was found to be particularly conducive to plating.
- Experiments at C/100 with electrodes harvested from full-cells revealed that the cathode remained mostly unscathed, while permanent capacity loss was observed at the anode. Although these losses appeared to correlate with the number of equivalent full cycles endured by the cells, they became detectable after a lower number of cycles when the rate was higher.
- The anode harvested from the full-cell that experienced the most severe levels of Li deposition (4C/80) presented clearly distorted lithiation plateaus, but these distortions vanished in subsequent slow cycles. This unexpected behavior indicates that plated Li can have ephemeral effects on intercalation kinetics. At this time, it is not clear how such effects would influence full-cell operation.
- Full-cells that experienced voltages higher than ∼4.3 V typically presented high levels of impedance rise that evolved non-linearly with the number of charging cycles. This behavior likely originated from high-voltage-related degradation at the oxide surface. Systems that remained confined to lower voltages generally presented linear impedance rise and a similar pace of aging.
- When impedance rise is adjusted by the number of equivalent full cycles, cells could be sorted into three clusters depending on their charging currents: operation at 8C and 6C will lead to faster aging than at 4C, and much faster than at 2C and 1C. This rate of aging varied little with the terminal SOC of partial cycles, suggesting that over a long-term period, power fade can only be delayed by limiting the charge passed at high rates, but not fully prevented. We propose that the likely mechanism of impedance rise is the development of inter-granular cracking in the oxide particles.
The possible connection between cracking and impedance rise suggests that the non-uniform charge distribution achieved at high rates can be a critical source of aging. We believe that the findings of this study will inspire future work on the deleterious side-effects of SOC heterogeneity and inform the development of fast charging protocols.
Acknowledgments
We are grateful to the U.S. DOE Office of Vehicle Technology Extreme Fast Charge Cell Evaluation of Lithium-Ion Batteries (XCEL) Program managed by Samuel Gillard. The electrodes were fabricated at DOE's CAMP (Cell Analysis, Modeling and Prototyping) Facility, Argonne National Laboratory. The CAMP Facility is fully supported by DOE-VTO. We are grateful to our many XCEL colleagues for their guidance and support during this effort. AR acknowledges support from the U.S. Department of Energy (DOE) Office of Science Graduate Student Research (SCGSR) program. The SCGSR program is administered by the Oak Ridge Institute for Science and Education for the DOE under contract number DE‐SC0014664. This document has been created by UChicago Argonne, LLC, Operator of Argonne National Laboratory ("Argonne"). Argonne, a U.S. Department of Energy Office of Science laboratory, is operated under Contract No. DE-AC02-06CH11357. The U.S. Government retains for itself, and others acting on its behalf, a paid-up nonexclusive, irrevocable worldwide license in said article to reproduce, prepare derivative works, distribute copies to the public, and perform publicly and display publicly, by or on behalf of the Government.