
Abstract
In this study, on-line mass spectrometry is used to determine hydrogen permeation during proton exchange membrane water electrolyzer (PEM-WE) operation for a wide range of current densities (0–6 A cm−2) and operating pressures (1–30 bar, differential pressure). H2 permeation measurements with a permeation cell setup, i.e., without applying a current, show a linear correlation between permeation rate and H2 partial pressure, indicating diffusion as the main crossover mechanism. Measurements with full membrane electrode assemblies (MEAs) during PEM-WE operation reveal a significant increase of the gas permeation rate at high current densities, by up to ≈20-fold at 1 bar H2 and up to ≈1.2-fold at 30 bar H2 (Nafion® 212 or Nafion® 117 membrane; Ir-black (anode) and Pt/C (cathode)). Recently, H2 super-saturation of the ionomer phase in the cathode catalyst layer was shown to be the reason for this increase, and we discuss the impact of this effect for different electrode compositions and operating conditions. Finally, the determined H2 permeation rates and electrolyzer performance are used to discuss the overall PEM-WE efficiency for different membrane thicknesses and it is shown that the formation of an explosive gas mixture in the anode at low current densities requires additional mitigation strategies.
Export citation and abstract BibTeX RIS

This is an open access article distributed under the terms of the Creative Commons Attribution 4.0 License (CC BY, http://creativecommons.org/licenses/by/4.0/), which permits unrestricted reuse of the work in any medium, provided the original work is properly cited.
This was paper 1598 presented at the Cancun, Mexico, Meeting of the Society, September 30-October 4, 2018.
PEM water electrolysis (PEM-WE) could become a key component in a future energy scenario based on renewable energy sources by providing electrolytic hydrogen for energy storage as well as for industrial processes and the mobility sector. Currently, only a small share of the global hydrogen demand is served by PEM-WE due to the relatively high costs associated with this technology.1,2 The overall H2 generation costs depend on the operating costs which are governed by the electricity price and the investment costs for the PEM-WE system. While electricity prices from renewable energies have dropped significantly in recent years, with on-shore wind electricity at ≈0.06 US$/kWh in 2017,3,4 corresponding to electricity costs of ≈3 US$/kgH2 at 70% efficiency (based on the lower heating value), reducing the investment costs for the PEM-WE stack still presents a major challenge. Apart from reducing material costs for stack components,5 increasing the current density can be a way to lower costs by reducing the total cell area required to achieve a given hydrogen production rate. Recent publications show that current densities of 5 A cm−2 and above are feasible,6–8 which is significantly higher than typical values for state-of-the-art systems (1–2 A cm−2).9 However, ohmic losses, which are mostly attributed to the membrane resistance, increase with current density and, consequently, thinner membranes have to be used to retain a high efficiency resulting in low operating costs (cf Results and Discussion section for detailed analysis). On the other hand, thinner membranes typically exhibit an increased gas crossover which presents a big challenge for PEM-WE applications, since H2 is often produced at elevated pressures,10 generally between 20 – 50 bar.5,9 However, since H2 is usually stored and distributed as a compressed gas or in the liquefied form,11 PEM-WE operation at elevated H2 pressure is beneficial to reduce overall system cost.9,10 Permeation of H2 from the cathode through the membrane to the anode compartment not only reduces the faradaic efficiency of the electrolyzer, but can also lead to the formation of explosive gas mixtures in the anode compartment (the lower explosion limit for H2 in O2 is ≈4%),12 since H2 does not oxidize on the iridium oxide based anode catalysts.13 O2 crossover is less critical, since O2 is usually produced at ambient pressure and permeation rates are lower than for H214; furthermore, O2 can reduce to H2O on the cathode catalyst, so that the accumulation of O2 in the cathode compartment is minimal.15
In state-of-the-art PEM-WEs, perfluorosulfonic acid (PFSA) membranes such as Nafion® are used because they are mechanically robust and generally provide a good compromise between ohmic resistance and low gas permeability. Gas permeation rates for Nafion® membranes as a function of temperature, relative humidity, and differential pressure have been studied extensively in the literature using ex situ measurement techniques.16–22 However, recent studies show that permeation rates are different when measured under actual PEM-WE operating conditions and that they exhibit a significant dependence on current density.15,23–25 This phenomenon has been ascribed to a more complex water transport within the membrane during operation,25 generally to a local pressure increase in the catalyst layer or to H2 super-saturation.24 Additionally, the influence of structural properties of the catalyst layer and the porous transport layer (PTL) as well as the impact of different cell hardwares (applying, e.g., different compressive forces on the membrane electrode assembly (MEA)) is not fully understood yet24,26 and further research is required to clarify how these factors influence gas permeation.
In this study, we use on-line mass spectrometry to determine H2 permeation rates during PEM-WE operation for a wide range of current densities (0–6 A cm−2) and operating pressures (1–30 bar, differential pressure) for MEAs with Nafion® 117 (thickness ≈178 μm) and Nafion® 212 (thickness ≈51 μm) membranes. Based on these results, the overall efficiency and the operating range of MEAs with different membrane thicknesses is discussed.
Experimental
Membrane electrode assembly (MEA) preparation and cell assembly
The 5 cm2 active area MEAs used in this study were prepared by a decal transfer method that has been described previously.7 Iridium black (Heraeus Metal Processing, Ltd., Ireland) was used as catalyst for the oxygen evolution reaction (OER) on the anode with loadings of 0.9 ± 0.3 mgIr cm−2, while platinum supported on Vulcan XC72 carbon (45.8 wt% Pt/C; TEC10V50E from Tanaka, Japan) with loadings of 0.3 ± 0.1 mgPt cm−2 was used as a cathode catalyst for the hydrogen evolution reaction (HER). The catalyst inks were prepared with catalyst powder, solvent (2-propanol purity ≥99.9% from Sigma Aldrich, Germany), and Nafion® ionomer solution (20 wt% ionomer; D2021 from IonPower, USA). ZrO2 grinding balls (5 mm diameter) were added for the 24 h mixing procedure on a roller mill. The ink was coated onto a 50 μm thick PTFE foil (from Angst+Pfister, Germany) using a Mayer-rod coating machine. To fabricate the 5 cm2 active area MEAs, the electrodes were cut to size and then hot-pressed onto Nafion® 117/212 membranes (178 μm/51 μm thick; from Quintech, Germany) for 3 min at 155 °C at a pressure of 2.5 MPa. The electrode loadings were calculated from the weight difference of the PTFE decal before and after the transfer step, measured with a microbalance (±15 μg; XPE105DR from Mettler Toledo, Germany). The ionomer content was fixed at 8.9 wt% for the anode while an ionomer to carbon (I/C) mass ratio between 0.6/1–1.2/1 was used for the cathode electrodes.
As porous transport layers (PTLs), sintered titanium (Ti) (from Mott Corporation, USA) with a porosity of ≈50% and a thickness of 280 ± 10 μm on the anode and carbon fiber paper (TGP-H-120 from Toray, no MPL) with a thickness of 370 ± 10 μm on the cathode were used. A 10 μm PTFE sub-gasket was used to prevent the MEA from being cut by the sharp edges of the Ti PTL. The cell was sealed with two 310 ± 10 μm thick PTFE gaskets to achieve a ≈25% compression of the carbon PTL (corresponding to a compression of ≈1.7 MPa), whereby the Ti PTL is assumed to be incompressible.
Electrochemical characterization
All tests were performed on a Greenlight E40 Electrolyzer Test Station equipped with a potentiostat and a booster (Reference 3000 and 30 °A booster, Gamry). The absolute pressure on the cathode was varied between 1.47 and 30.47 bara, while the anode was kept at ambient pressure. Taking into account the vapor pressure of water at 80 °C (0.47 bar) this translates into H2 partial pressures between 1 – 30 bar on the cathode. Note that in the following, all pressure values refer to the H2 partial pressure and not to the total pressure in the cathode compartment. Cell and reactant inlet temperatures were set to 80 °C and DI water was supplied at a flow rate of 10 ml min−1 to the anode. Hydrogen was supplied to the cathode and oxygen to the anode at flow rates between 50 and 200 ml min−1 (note that all gas flow rates are referenced to standard conditions of 0 °C and 1.013 bar). A ≈2 h lasting cell-warmup and a conditioning procedure were performed before the measurements. During the conditioning, the current density was ramped to 1 A cm−2 over 200 s and held for 30 min. Three polarization curves with current densities starting from 0.01 and increasing to 6 A cm-2 were recorded afterwards. Each current density step was held for 5 min followed by an AC impedance measurement in a range of 20 kHz–10 Hz to determine the high frequency resistance (HFR). During the H2 permeation rate measurements the current density was varied between 0–6 A cm−2 with hold times from 90–180 min for each current step. Additional polarization curves were recorded following the permeation measurement at each H2 pressure step as well as at the end of test.
Hydrogen permeation rate
The test setup used in this work to determine the H2 permeation rates is based on the analysis of the H2 volume fraction (on a dry basis) in the O2 exhaust of the anode, using a mass spectrometer (cf Fig. 1). A defined flow of dry H2 gas can be supplied to the cathode inlet of the electrolyzer cell, while defined flows of H2O and O2 gas can be supplied to the anode inlet. The product gas at the anode outlet of the cell is typically a mixture of H2O, O2, and H2 that permeates from the cathode compartment through the membrane into the anode compartment. Water is then separated from the product gas by a heat exchanger and a water separator unit implemented in the test station (E40 from Greenlight, Canada), as shown in Fig. 1). The dry product gas, consisting of a mixture of O2 and H2 is then analyzed by a quadrupole mass spectrometer (Cirrus™3 from MKS). Thorium filaments are used to ensure a sufficient filament lifetime in the highly corrosive O2 environment. The capillary which supplies the gas to be analyzed to the mass spectrometer requires a minimum flow of 20 ml min−1. Consequently, if the O2 production rate during electrolyzer operation is too low (i.e., at low current densities) or for the permeation cell measurements (cf Fig. 2) where no O2 is produced at all, additional O2 gas needs to be supplied in order to ensure sufficient gas flow to the capillary. The amount of O2 supplied to the anode inlet (cf Fig. 1) is regulated by a mass flow controller to achieve a total gas flow at the anode outlet of at least 50 ml min−1. Furthermore, this additional O2 flow prevents the formation of explosive gas mixtures in the anode gas stream (lower explosion limit for H2 in O2: ≈4%12). Of course, the additional O2 flow needs to be considered when calculating the actual H2 in O2 content that would be obtained in a PEM-WE (i.e., in the absence of adding O2 to the anode inlet) that is shown in Fig. 8.

Figure 1. Schematic flow diagram of the test setup used for gas permeation measurements via mass spectrometry. Dry H2 gas can be supplied to the cathode, while H2O and O2 can be supplied to the anode. Water is separated from the product gases at the cell outlet by a heat exchanger and a water separator. The dry product gas on the anode (a mixture of O2 and H2) is analyzed by a mass spectrometer. Measurements are performed at a temperature of 80 °C and at H2 partial pressures of 1–30 bar, while the anode is being kept at ambient pressure.
Download figure:
Standard image High-resolution image
Figure 2. (a) Sketch of the here developed test setup to measure H2 permeation rates by quantifying the H2 content in the O2-rich anode gas using a mass spectrometer. For this, H2 is supplied to the cathode (50 ml min−1), while the anode is supplied with H2O (10 ml min−1) and O2 (50 ml min−1 for pH2 ≤ 10 bar and 100 ml min−1 for pH2 > 10 bar). (b) Sketch of the test setup used for conventional electrochemical H2 permeation rate measurements. H2 (50 ml min−1) is supplied to the cathode, while the anode is supplied with H2O (50 ml min−1) and N2 (50 ml min−1); the limiting current density obtained at a potential of 0.4 V represents the H2 permeation current. (c) H2 permeation rate as a function of H2 partial pressure on the cathode for a Nafion® 117 membrane (red) and a Nafion® 212 membrane (blue) determined with the test setup shown in Fig. 2a. The H2 permeation rate for a Nafion® 212 membrane determined with the electrochemical measurement method presented in Fig. 2b is shown for comparison (green). The H2 partial pressure normalized H2 permeation rate (in units of mA cm−2 bar−1) was determined by a linear regression of the measured permeation rates (dashed lines).
Download figure:
Standard image High-resolution imageDuring the measurements, the anode compartment is kept at ambient pressure, while the H2 partial pressure on the cathode is varied between 1–30 bar. The pressure in the cathode compartment is controlled by a back pressure regulator which requires a continuous gas flow to maintain a constant pressure. Hence, an additional H2 gas flow of 50 ml min−1 is supplied to the cathode inlet during all measurements in order to ensure a sufficient gas flow even at low current densities (i.e., at low H2 production rates) and during the permeation cell measurements (cf Fig. 2). A more detailed description of the MEAs and the transport processes taking place in the cell can be found in the following sections for the respective test setups.
Theory of Gas Permeation
In this section, the mass transport mechanisms which are responsible for H2 gas permeation in a PEM-WE, namely diffusive and convective transport are discussed briefly. For a more detailed discussion of crossover mechanisms we refer to Ref. 27.
Diffusion
In general, diffusion of H2 from the cathode to the anode can occur through the polymer phase as well as the liquid phase in ionomeric membranes.20 For Nafion® membranes the contribution of diffusion through the polymer phase is very small and it is generally assumed that diffusion through the liquid phase is the dominating mechanism21; a quantitative separation of the permeation of various gases through a Nafion® membrane was also given by Mittelsteadt and Liu.20 The diffusive H2 flux according to Fick's law can be expressed as

Here,  represents the H2 concentration gradient between anode and cathode. Assuming a negligible H2 concentration in the anode compartment compared to that in the cathode compartment,
  is directly proportional to the partial pressure of H2 in the cathode compartment.
  is the effective diffusion coefficient of the membrane which is a function of porosity and tortuosity,27 i.e., of the water content of the membrane, while
  represents the membrane thickness. Assuming a constant water content of the membrane, the diffusive H2 flux is expected to scale linearly with the H2 partial pressure on the cathode of the electrolyzer.
Convection
Convective transport of H2 dissolved in liquid water due to a net water transport through the membrane is another possible mechanism of H2 crossover and can be described as27

where  is the velocity of water moving through the membrane and
  is the concentration of dissolved H2 in the water phase. Differential pressure operation is a possible reason for a net water transport and, consequently, a convective H2 flux from cathode to anode. Here, the total pressure difference between cathode and anode,
  would be directly proportional to the H2 permeation rate according to Darcy's law27

where  is the H2 partial pressure on the cathode,
  the membrane thickness, and
  a transport coefficient which depends on the permeability of the membrane, the solubility of H2 in water, and the dynamic viscosity. If the pressure in the anode compartment is much smaller than in the cathode compartment, the partial pressure of H2,
  equals approximately the total pressure difference,
  and the convective H2 permeation should scale quadratically with
Electro-osmotic drag of water is another possible source of convective H2 transport. Here, water is transported from anode to cathode, at a rate which is directly proportional to the amount of protons transported, i.e., to the current density.27

Here,  is the current density and
  the H2 partial pressure on the anode while
  is a transport coefficient which depends on the solubility of H2 in water and the electro-osmotic drag coefficient that describes the ratio of the number of water molecules dragged along per proton. Since convective transport of H2 due to the electro-osmotic drag would occur from anode to cathode, it would actually lead to a lower overall H2 crossover flux from cathode to anode and would only affect it during electrolyzer operation, i.e., when a current is drawn.
Note that in the following, the term "permeation" is used to describe the measured H2 crossover from cathode to anode, even though, strictly speaking, the term permeation would only apply to a partial gradient driven transport (Eq. 1) and not to the convective transport processes. Furthermore, H2 permeation rates are referenced to the dry thickness of the membranes.
Results and Discussion
H2 permeation rates using permeation cell measurements
First, to validate the H2 permeation measurement method based on the quantification of the H2 concentration in the O2 exit stream of the anode compartment of a PEM-WE by mass spectrometric analysis, the H2 permeation rates through Nafion® membranes are measured as a function of the H2 partial pressure. The thus determined H2 permeation rates are then compared with those determined by the well-established electrochemical method to quantify H2 permeabilities, which is based on the electrooxidation of H2 that is permeating through an MEA with the same membrane from a H2-filled compartment into a N2-filled compartment of a fuel cell or electrolyzer cell.18,21
For the here used H2 permeation measurement method that is based on quantifying the H2 concentration in the O2-containing anode compartment, a Nafion® membrane is assembled between the PTLs (Ti sinter on anode and carbon paper on cathode) in the cell hardware (cf Fig. 2a). A mixture of O2 (50 ml min−1 for pH2 ≤ 10 bar and 100 ml min−1 for pH2 > 10 bar) and H2O (10 ml min−1) is supplied to the anode inlet in order to ensure sufficient humidification of the membrane as well as a sufficient gas flow to the mass spectrometer (see Experimental section). On the cathode, H2 gas is supplied at a flow rate of 50 ml min−1 and the H2 partial pressure is varied from 1–30 bar while the anode is kept at ambient pressure. A hold time of 15 min is applied for each pressure step to give the system enough time to stabilize and to obtain a constant signal in the mass spectrometer. Each pressure step is measured twice (once while increasing the pressure and once while decreasing the pressure), and the deviation between the obtained values was always <0.4 mA cm−2 (≈0.02 mmol m-2 s−1). The averaged H2 permeation rates calculated from the mass spectrometer (MS) data are shown in Fig. 2c as a function of H2 partial pressure for a Nafion® 117 (referenced to a dry thickness of ≈178 μm) and a Nafion® 212 (referenced to a dry thickness of ≈51 μm) membrane. For both Nafion® 117 (red symbols/line in Fig. 2c) and Nafion® 212 (blue symbols/line in Fig. 2c), the permeation rate increases linearly with H2 partial pressure. Furthermore, the H2 partial pressure normalized permeation rate (i.e., the slope of the lines in Fig. 2c) of the thin Nafion® 212 membrane (1.10 mA cm−2 bar−1) is a factor ≈3.5 higher compared to the Nafion® 117 membrane (0.31 mA cm−2 bar−1), exactly matching the inverse of the thickness ratio between the two membranes (178 μm/51 μm ≈ 3.5). Both findings indicate that diffusion-driven H2 permeation according to Eq. 1 is the dominating process, since the H2 diffusion rate is directly proportional to the H2 partial pressure and to the inverse of the membrane thickness (cf Eq. 1). If convective transport due to the pressure difference between anode and cathode were to have a significant influence, a quadratic dependency on H2 pressure would be expected (cf Eq. 3), which clearly is not observed in these measurement.
To validate the H2 permeation rates obtained by quantifying the concentration of crossover H2 in O2 with the mass spectrometer setup (cf Fig. 2a), we will now compare them with the results from an electrochemical measurement technique frequently used to determine H2 permeation rates.18,21 The setup for this measurement is described in Fig. 2b. An MEA is fabricated with a Nafion® 212 membrane and carbon supported platinum (Pt/C) electrodes (≈0.3 mgPt cm−2) with a standard ionomer/carbon mass ratio of 0.6/1 on both sides of the MEA. This MEA is then assembled between the Ti sinter and the carbon paper PTLs in the same electrolyzer cell hardware, and N2 gas (50 ml min−1) along with water (5 ml min−1) are supplied to the anode compartment while H2 (50 ml min−1) is supplied to the cathode compartment. A positive potential of 0.4 V is applied to the anode and, consequently, H2 permeating through the membrane to the anode is oxidized to protons at the Pt catalyst (note that the counter reaction in the H2 compartment is the H2 evolution reaction), whereby the measured limiting current density represents the rate of H2 permeation through the membrane. This measurement was performed for H2 partial pressures from 1–30 bar and the results are shown by the green symbols/line in Fig. 2c. The results fit perfectly with the H2 permeation rate obtained for a Nafion® 212 membrane with the mass spectrometer setup (cf Fig. 2a). On account of this excellent agreement between these two methods, we consider our test setup based on a mass spectrometer to analyze the H2 content in the O2-rich anode gas suitable for H2 permeation measurements during operation of a PEM-WE which will be discussed in the next section.
H2 permeation rates during PEM-WE operation
To determine the H2 permeation rate during electrolyzer operation, i.e., as a function of the applied current density, the setup shown in Fig. 3a is used. MEAs are fabricated based on either a Nafion® 212 or a Nafion® 117 membrane. The anode electrode consists of Ir-black (0.9 ± 0.3 mgIr cm−2), while a Pt/C cathode (0.3 ± 0.1 mgPt cm−2) with a standard ionomer/carbon mass ratio of 0.6/1 is used. The MEAs are assembled between Ti sinter (anode) and carbon paper (cathode) PTLs in the cell hardware. After a conditioning procedure described in the Experimental section, H2 permeation rates are measured for different current densities up to 5 A cm−2 for the Nafion® 117 membrane and up to 6 A cm−2 for the Nafion® 212 membrane. The maximum current density is determined by an upper potential limit of 2.4 V. Permeation rates at a current density of zero are recorded while a potential of 1.3 V is applied to the iridium anode. At this potential, the surface of the iridium catalyst is oxidized and, consequently, exhibits a very low HOR activity.13 This is crucial, since H2 oxidation on the anode would reduce the amount of H2 detected at the anode outlet by the MS and, therefore, would lead to an underestimation of the H2 permeation rate. The current measured during the potential hold at 1.3 V is <1 mA cm−2 (<0.05 mmol m−2 s−1), proving that the HOR activity of the iridium catalyst is negligible, which is a prerequisite for the here used H2 permeation rate measurements. Furthermore, the potential hold at 1.3 V ensures that the anode catalyst is never exposed to a reducing atmosphere. This is important since it was shown that frequent cycling between a reducing and an oxidizing atmosphere on the anode can lead to a significant alteration of the catalyst properties, which could also influence H2 permeation measurements.28

Figure 3. (a) Sketch of the test setup used for H2 permeation measurements with a mass spectrometer during PEM-WE operation. For this, H2 is supplied to the cathode (50 ml min-1), while the anode is supplied with H2O (10 ml min-1) and O2 (50 ml min-1 for pH2 ≤ 10 bar and 100 ml min-1 for pH2 > 10 bar). (b) H2 permeation rate as a function of current density for different H2 partial pressures measured with a Nafion® 117 membrane at 80 °C. (c) H2 permeation rate as a function of current density for different H2 partial pressures measured with a Nafion® 212 membrane at 80 °C. Full symbols along with full lines in b) and c) represent the data measured while increasing the current density, whereas open symbols along with dotted lines show the data obtained while decreasing the current density. The electrodes of the MEA consist of iridium black (0.9 ± 0.3 mgIr cm-2) on the anode and of Pt/C (0.3 ± 0.1 mgPt cm-2) with a standard ionomer/carbon mass ratio of 0.6/1 on the cathode. Brown crosses give the H2 permeation rates measured with the permeation cell setup shown in Fig. 2a, i.e., for the membrane without electrodes.
Download figure:
Standard image High-resolution imageThe obtained H2 permeation rates for H2 partial pressures between 1 – 30 bar as a function of current density are shown in Fig. 3b for a Nafion® 117 membrane and in Fig. 3c for a Nafion® 212 membrane. Full symbols along with full lines represent the data measured while increasing the current density, whereas open symbols along with dotted lines show the data obtained while decreasing the current density. The error bars represent an overall error of the H2 permeation measurement based on the accuracy of the mass spectrometer, fluctuations of the operating conditions, as well as uncertainties related to the active area in the cell (a detailed explanation can be found in the Appendix). Brown crosses give the H2 permeation rates measured with the permeation cell setup shown in Fig. 2a. It can be observed that these values very closely match the H2 permeation rates for the Nafion® 212 membrane measured for the setup shown in Fig. 3a during the potential hold at 1.3 V (cf Fig. 3c, comparing the brown crosses and the symbols at 0 A cm−2), while they are up to ≈15% lower for the Nafion® 117 membrane (cf Fig. 3b). A possible explanation for this deviation is an insufficient humidification of the membrane in the permeation cell test setup shown in Fig. 2a, where the membrane was equilibrated with liquid water by supplying 5 mlH2O min−1 to the anode for ≈2 h. However, studies on the water uptake of Nafion® membranes show that an equilibration time of up to 150 h. can be required for a Nafion® 117 membrane at 80 °C.29 For the measurements performed with the test setup shown in Fig. 3a, on the other hand, conditioning of the MEA included a current hold at 1 A cm−2 as well as several polarization curves. This not only results in a longer overall conditioning time, but also the transport of water from anode to cathode due to the electro-osmotic drag during electrolyzer operation is expected to lead to a faster equilibration of the membrane. Since in general a longer equilibration time is expected for a thicker membrane, this could explain why a difference in H2 permeation rates at 0 A cm−2 is observed for the Nafion® 117 membrane (≈15%, cf Fig. 3b), but not for the Nafion® 212 membrane (cf Fig. 3c).
From Figs. 3b and 3c it can be observed that the H2 permeation rate increases with the current density for both membranes. With both membranes, there is a hysteresis in the H2 permeation rates, with the values being lower while increasing the current density (solid symbols/lines) compared to when subsequently decreasing the current density. A possible explanation for this phenomenon is that even though a hold time of 90–180 min was applied at each measurement point, the H2 permeation rate was still not completely constant (i.e., it was still slowly increasing with time), especially for the measurements taken while increasing the current density.
The relative increase of the H2 permeation rate with current density is most pronounced for small H2 partial pressures. For an MEA with the Nafion® 117 membrane, the H2 permeation rate at a pressure of 1 bar reaches a value of 3.3 mA cm−2 at a current density of 5 A cm−2, which is ≈15 times higher than the expected value at this H2 partial pressure that is measured at 0 A cm−2. A similar increase is observed for the Nafion® 212 membrane, where a value of 15.2 mA cm−2 is reached at a current density of 6 A cm-2, ≈20 times higher than the value obtained at 0 A cm−2. For higher operating pressures, the relative increase is smaller, with only ≈16% at 5 A cm−2 and 30 bar for the Nafion® 117 membrane, while the permeation rate can be considered essentially independent of current density (within the range of the measurement error) for the Nafion® 212 membrane at 30 bar. The observed increase of permeation rate with current density has been shown frequently in the literature,23,24,30 albeit to different extents, which indicates a strong influence of the measurement method and/or the cell setup (cell hardware, PTL, MEA, etc.,) on this phenomenon.26 Possible reasons for this current dependency will be discussed briefly in terms of the simple models for H2 transport through the membrane presented in the Theory section. Diffusive flux of H2 according to Eq. 1 only depends on the H2 concentration gradient between cathode and anode,  the membrane thickness,
  and the effective diffusion coefficient,
  i.e., it should not directly depend on the current density. However, if one of the above mentioned parameters were to be affected by the current density, this would indeed lead to a current density dependence of the H2 permeation rate. For example, there are in principle two possibilities to increase the effective H2 concentration at/near the membrane/cathode interface with increasing current densities, which have been discussed in the literature14,23–25: either an increase in the local H2 partial pressure at the membrane/cathode interface due to limited removal rates of the evolved H2 or H2 super-saturation in the ionomer phase at high H2 production rates (i.e., at high current densities). An increased H2 concentration in the ionomer phase at/near the membrane/cathode interface either by an increased pH2 or by H2 super-saturation would directly translate into an increase of the diffusive H2 flow. With regards to the H2 diffusion coefficient,
  there are two possible effects which must be considered: (i)
  is expected to increase with temperature, so that a local temperature increase at the MEA due to the high amount of heat produced at high current densities could lead to an increase of the H2 permeation rate; (ii) a change in the water content of the membrane with current density could also affect
  Due to the electro-osmotic drag water is transported from anode to cathode, which could lead to a more homogeneous water distribution across the membrane at high current densities. However, this may be negatively affected by differential pressure operation and the corresponding hydraulic water transport from cathode to anode. For the conceivable variations in MEA temperature and membrane water content, one would expect, however, that the variation of
  could not account for the above described more than 10-fold increase in the H2 permeation rate.
Convective transport due to a total pressure difference between cathode and anode was shown to be insignificant by the permeation cell measurements presented in the previous section. There, the permeation rate was found to be perfectly first order with respect to pH2 (cf Fig. 2c), as predicted in the absence of a total pressure difference driven flux (as discussed in the Theory section). Another possible effect on H2 permeation could be the convective flux of water due to the electro-osmotic drag that is a function of current density. However, since the electro-osmotic drag of protons goes from the anode to the cathode, dragging along H2O and thus H2 dissolved in H2O, it would lead to a lowering of the overall H2 permeation rate from cathode to anode with increasing current density, i.e., the opposite of what we observe. Hence, the effect of the electro-osmotic drag is either negligible or is compensated by other effects which lead to an increase of H2 permeation rate with current density.
In recent studies, Trinke et al. suggested that H2 super-saturation in the ionomer phase of the cathode catalyst layer is the main reason for the increase of the H2 permeation rate with current density, and that the extent of this increase depends on the mass transport properties of the cathode catalyst layer.31 The authors changed the ionomer content in the cathode and, consequently, the void volume fraction of the catalyst layer; they found that with increasing ionomer content the mass transport overpotential increased similar to what was shown previously by Rheinländer et al.32 Additionally, they observed a stronger increase of the H2 permeation rate with current density for a higher ionomer content.31 While they ascribed this to an increasing degree of H2 super-saturation in the ionomer phase with current density, a partial pressure build-up at/near the membrane/cathode interface could also explain this phenomenon. A similar behavior was observed in the present study when the ionomer/carbon (I/C) mass ratio in the cathode electrode was increased from its standard value of 0.6/1 to higher values of 1.2/1 (cf Fig. 4). By increasing the cathode I/C ratio, the volume fraction of ionomer in the cathode catalyst layer increases while its void volume fraction decreases, as is shown in Fig. 4a. Here, the catalyst volume fraction (Vcat; gray bars) is determined from the measured catalyst loading (Lcat), the average density of the 45.8 wt% Pt/C catalyst (ρcat ≈ 3.1 g cm−3), and the measured cathode layer thickness (tcath), as outlined in detail in Ref. 7 For the calculation of the ionomer volume fraction (Vion, brown bars), swelling of the ionomer due to water uptake is accounted for by considering a water content of λ = 21 (λ being the moles of water per mole of sulfonic acid group) for the applied operating conditions (liquid water at 80 °C),29,33 which leads to a ≈80% volume increase of the ionomer compared to the dry ionomer (for details, see Ref. 7). The void volume fraction (Vvoid) then equates to Vvoid = 100% - Vcat - Vion, which becomes rather small at an I/C mass ratio of 1.2/1 (white bars in Fig. 4a).

Figure 4. (a) Cathode catalyst layer volume fractions for three different ionomer to carbon (I/C) ratios (by mass). Vcat represents the volume fraction of the Pt/C catalyst, Vion the volume fraction of ionomer equilibrated with liquid water at 80 °C, and Vvoid the remaining electrode void volume. These were determined by measuring the thickness and the areal weight of the cathode catalyst layers (see text and reference7). (b) H2 permeation rate as a function of current density for cathode electrodes with different I/C ratios measured with a Nafion® 117 membrane at 80 °C and a H2 partial pressure of 10 bar. Full symbols along with full lines represent the data measured while increasing the current density, whereas open symbols along with dotted lines show the data obtained while decreasing the current; the MEAs are composed of iridium black (0.9 ± 0.3 mgIr cm-2) on the anode and of Pt/C (0.3 ± 0.1 mgPt cm-2) on the cathode. The brown cross marks the H2 permeation rate measured with the permeation cell setup shown in Fig. 2a, i.e., for the membrane without electrodes and without applied current.
Download figure:
Standard image High-resolution imageThis low void volume fraction and the high ionomer volume fraction in cathode electrodes with high I/C ratios has two possible consequences: (i) a low Vvoid will likely impede the removal of the evolved H2 gas, which would lead to a partial pressure build-up at the membrane/cathode interface and thus to an increase of the H2 concentration in the ionomer phase (as predicted by Henry's law), which in turn would increase the H2 permeation rate acc. to Eq. 1; and/or (ii) a high Vion might lead to a restricted transfer of the evolved H2 from the catalyst surface through the ionomer film covering the catalyst surface into the open pore volume, which could lead to H2 super-saturation in the ionomer phase, which in turn again would increase the H2 permeation rate. While Trinke et al. suggest that H2 super-saturation is responsible for the increase of the H2 permeation rate with current density,31 a local H2 pressure build-up was also suggested to cause this effect. Both phenomena would lead to an increase in the H2 permeation rate with increasing current density, which would be expected to be increasingly more pronounced with increasing I/C ratio of the cathode electrode. This is indeed observed for the H2 permeation rate vs current density recorded at 10 bar H2 shown in Fig. 4b: between 0 A cm−2 and 4 A cm−2, the H2 permeation rate increases by a factor of ≈1.4, ≈2.5, and ≈3.3 for cathode electrode I/C ratios of 0.6/1 (green symbols/lines), 0.9/1 (purple symbols/lines), and 1.2/1 (dark red symbols/lines), respectively. If this were simply due to a local H2 partial pressure build-up at the membrane/cathode interface (pH2,local(i)), pH2,local(i) at 4 A cm−2 over that at 0 A cm−2 would have to increase by the same factor. As pH2,local at 0 A cm−2 must correspond to the H2 partial pressure in the cathode compartment (pH2,cathode), the H2 partial pressure difference between the cathode compartment and the membrane/cathode interface at a given current density (Δpcathode(i)) would then correspond to pH2,local(i) - pH2,cathode. Based on this, the increase of the H2 permeation rate between 0 A cm−2 and a given current density would be proportional to Δpcathode(i)/pH2,cathode, which for the observed increase of the H2 permeation rate between 0 and 4 A cm−2 at 10 bar (see above) would amount to Δpcathode(i) ≈ 4 bar, ≈ 15 bar, and ≈ 23 bar, for the cathode electrode I/C ratios of 0.6/1, 0.9/1, and 1.2/1, respectively.
Assuming that Δpcathode(i) produced by a hindered H2 transport through the void volume of the cathode electrode for a given cathode electrode I/C ratio (i.e., for a given Vvoid) were independent of the total H2 pressure in the cathode compartment (pH2,cathode), the relative increase of the H2 permeation rate between 0 A cm−2 and a given current density would again be expected to be proportional to Δpcathode(i)/pH2,cathode, so that it should diminish as pH2,cathode increases. This would be consistent with the observations shown in Fig. 3b and 3c, where the relative current density dependence of the H2 permeation rate diminishes with increasing pH2,cathode. While this local H2 pressure build-up seems to be a reasonable explanation for the increase of the H2 permeation rate with current density, the effect of H2 super-saturation is another possible explanation.
In terms of the practical application of PEM-WEs, a substantial increase of the H2 permeation rate with current density could be problematic, since it would result in a lower faradaic efficiency and could lead to the formation of a sufficiently high H2 concentration in the anode gas even at high current densities, possibly exceeding the explosive limit. To illustrate the extent of an increasing H2 permeation rate with current density, the H2 permeation rates determined for Nafion® 117 MEAs with either the standard cathode electrode I/C ratio of 0.6/1 (solid symbols/lines) or with the highest here examined I/C ratio of 1.2/1 (open symbols, dotted lines) are plotted in Fig. 5a for two different H2 pressures in the cathode compartment (pH2,cathode): (i) for a H2 partial pressure of 1 bar (purple symbols/lines), where the strongest increase of the H2 permeation rate with current density is observed, and (ii) at an application-relevant PEM-WE operating pressure of 30 bar (turquoise symbols/lines). As expected, the increase of the H2 permeation rate with current density is more pronounced for cathode electrodes with the high I/C ratio of 1.2/1 compared to the standard I/C ratio of 0.6/1, both for 1 bar as well as for 30 bar. This clearly demonstrates the importance of designing cathode electrodes with an as low as possible I/C ratio, whereby for the standard cathode electrode I/C ratio of 0.6/1e proton conduction related voltage losses at 80 °C are <10 mV at 3 A cm−2..7 The relative H2 permeation rate at pH2,cathode = 1 bar shown in Fig. 5b increases rather dramatically from 0 to 4 A cm−2, namely by a factor of ≈9 (cathode I/C of 0.6/1) and ≈25 (cathode I/C of 1.2/1), consistent with the strong current density dependence of the H2 permeation rate at 1 bar reported in the literature.24,30 While a similarly high factor at pH2,cathode = 30 bar would lead to very poor if not unacceptable faradaic efficiencies, the relative increase of the H2 permeation rate at 30 bar is fortunately quite small, corresponding to a factor of only ≈1.1 (cathode I/C of 0.6/1) and ≈1.6 (cathode I/C of 1.2/1). This shows that at realistic PEM-WE operating conditions (i.e., at a H2 pressure of 30 bar) and for a cathode electrode which is optimized with regards to its mass transport properties (i.e., with regards to its I/C ratio), the increase of the H2 permeation rate with current density is almost negligible. In the following section, we will discuss the impact of the measured H2 permeation rates on the efficiency and the operating range of a PEM-WE.

Figure 5. (a) H2 permeation rate vs current density for cathode electrodes with a standard I/C ratio of 0.6/1 (solid symbols/lines) and a high I/C ratio of 1.2/1 (open symbols, dotted lines) measured with a Nafion® 117 membrane at 80 °C and H2 partial pressures of either 1 bar (purple) or 30 bar (turquoise). Here, the average value of the data points measured while increasing and decreasing the current is shown. Brown crosses give the H2 permeation rates measured with the permeation cell setup shown in Fig. 2a, i.e., for the membrane without electrodes and without applied current. (b) H2 permeation rates for the same cathode electrodes and operating pressures as in a) normalized by the permeation rates obtained at zero current. The MEAs are composed of iridium black (0.9 ± 0.3 mgIr cm-2) on the anode and of Pt/C (0.3 ± 0.1 mgPt cm-2) on the cathode.
Download figure:
Standard image High-resolution imagePEM-WE efficiency and operating range
In this section, the measured H2 permeation rates will be used to discuss the overall efficiency and the feasible operating range of a PEM-WE for the membranes with different dry thicknesses investigated in this study (Nafion® 117 and Nafion® 212 with ≈178 μm and ≈51 μm, respectively). In today's PEM-WEs, relatively thick membranes (e.g., Nafion® 117) are used, because they are mechanically robust and provide a good compromise between ohmic resistance and low gas permeability.34 However, thinner membranes offer a high potential for reduction of H2 generation costs,1 as will be illustrated in the following.
Figure 6a shows a PEM-WE polarization curve of an MEA with a Nafion® 117 membrane at a temperature of 80 °C and a H2 partial pressure of 30 bar in the cathode compartment (the anode compartment is kept at ambient pressure), which today would be operated at a maximum current density of 1 – 2 A cm−2 in a commercial electrolyzer.9 In general, increasing the current density can be a way to lower H2 generation costs by reducing the total cell area required to achieve a given target H2 production rate, i.e., lowering the capital expenditures. However, at higher current densities the cell voltage increases significantly due to the high ohmic resistance of the thick proton-conducting membrane, leading to a lower efficiency. This is illustrated by the following voltage loss analysis, that was performed analogous to how it was done in our previous work.7 Briefly, the overpotential for the OER (ΔEOER) was determined by a Tafel analysis, based on a Tafel slope of ≈45 mV dec−1 (determined in the 10–100 mA cm−2 region) and a mass activity of ≈63 A gIr−1 (determined at an iR-free cell voltage of 1.5 V) and is represented by the purple shaded areas in Fig. 6. Due to the fast kinetics of the HER, the resulting HER overpotential (ΔEHER) is negligible as shown in our previous studies.7,35 The overpotential due to ohmic losses (ΔEohmic) was determined by multiplying the ohmic resistance with the current density (ΔEohmic = i·RΩ) and is illustrated by the orange shaded areas in Fig. 6. The ohmic resistance (RΩ) represents the sum of the ionic resistance of the membrane (Rmemb) and the electrical resistance (Rel) and is obtained by extracting the high frequency resistance (HFR) from the measured impedance spectra. The remaining overpotential (ΔEtransport), i.e., the difference between the measured cell voltage (Ecell) and the sum of the reversible cell voltage (Erev), the OER overpotentials (ΔEOER), and ohmic losses (ΔEohmic), is attributed to transport phenomena (ΔEtransport = Ecell - (Erev + ΔEOER + ΔEohmic)). This includes voltage losses due to proton transport in the catalyst layers (
 ) as well as mass transport losses (ΔEmt)7 and is represented by the green shaded areas in Fig. 6.

Figure 6. PEM-WE single-cell (5 cm2) polarization curves at a temperature of 80 °C and a H2 partial pressure of 30 bar (the anode compartment is kept at ambient pressure) obtained for MEAs with thick vs thin membranes: (a) with a Nafion® 117 (178 μm dry thickness; red solid line); (b) with Nafion® 212 (51 μm dry thickness; blue solid line). The electrodes of the MEA consist of iridium black (0.9 ± 0.3 mgIr cm-2) on the anode and of Pt/C (0.3 ± 0.1 mgPt cm-2) with a standard ionomer/carbon mass ratio of 0.6/1 on the cathode. The dotted black lines mark the reversible cell voltage at these conditions (1.23 V), while the purple shaded areas represent the OER kinetic overpotential losses (ΔEOER), the orange shaded areas mark the ohmic potential losses (ΔEohmic), and the green shaded areas represent the overpotentials due to proton conduction resistances in the electrodes and mass transport resistances of the evolved gases (ΔEtransport). The dashed black lines represent a voltage efficiency of 70% based on the lower heating value (LHV) of H2, and the current density at which this voltage efficiency is reached is marked for the Nafion® 117 membrane (red) and for the Nafion® 212 membrane (blue) in Fig. 6b (note that the voltage efficiency discussed here does not include the faradaic efficiency which is discussed in the following).
Download figure:
Standard image High-resolution imageThis analysis of the various voltage loss contributions shows that at the highest current density of 5 A cm−2 ≈ 64% of the total voltage loss are due to ohmic losses (ΔEohmic) that are mostly due to the proton conduction resistance of the thick Nafion® 117 membrane (see orange shaded area in Fig. 6a). Since the electrical resistance represents only a small fraction of the ohmic resistance (≈12 mΩcm2 for the setup used in this study7), reducing the ionic membrane resistance offers the largest leverage to improve high current density performance. Figure 6b shows the result of reducing the membrane thickness by a factor of ≈3.5 by using a Nafion® 212 (51 μm dry thickness) instead of the Nafion® 117 (178 μm dry thickness). With the thinner membrane, the ΔEohmic contribution at the highest current density of 5 A cm−2 is lowered by a factor of ≈2, now accounting for only ≈44% of the total voltage loss. Simultaneously, at the frequently used voltage efficiency target of 70% based on the lower heating value (LHV) of H2 (corresponding to ≈1.79 V), the current density increases from 1.6 A cm−2 to 3.5 A cm−2 (see red and blue dashed lines in Fig. 6), i.e., by a factor of ≈2.3 for the MEA with the thinner Nafion® 212 membrane. This increase of the stack's H2 output translates directly into a stack cost reduction by a factor of ≈2.3 while the same voltage efficiency is retained. From this example, it becomes clear that minimizing the membrane thickness offers great potential for cost reduction.
While the voltage efficiency of a thin Nafion® 212 membrane is quite superior, it obviously exhibits a higher H2 permeation rate which results in a lower faradaic efficiency, especially if the electrolyzer is operated at elevated pressure. In general, however, pressurized electrolysis is beneficial compared to ambient pressure operation, because it reduces the energy demand for subsequent mechanical compression as well as the effort for gas drying due to the lower water content at higher pressure.1,36 Typical operating pressures of commercial PEM-WEs are in a range of 20–50 bar,9,37 and a H2 partial pressure of 30 bar is chosen here for the following analysis. The overall efficiency taking into account the voltage efficiency as well as the faradaic efficiency is presented in Fig. 7a for MEAs based on a Nafion® 117 membrane (red lines in Fig. 7a) and a Nafion® 212 membrane (blue lines). The voltage efficiency based on the LHV of H2,  can be calculated by dividing the reaction enthalpy for water in its gaseous state,
  (−242 kJ mol−1, corresponding to an LHV-equivalent voltage of 1.25 V) by the actual electrical energy input determined from the operating cell potential,

The dashed lines in Fig. 7a show the voltage efficiency,  at a H2 partial pressure of 30 bar, at ambient anode compartment pressure, and at a temperature of 80 °C, as determined from the measured polarization curves in Fig. 6 in combination with Eq. 5. Obviously, the MEA with the thin Nafion® 212 membrane (blue line) exhibits a higher voltage efficiency than that with the thick Nafion® 117 membrane, especially at high current densities, due to the lower ohmic resistance as already discussed in Fig. 6.
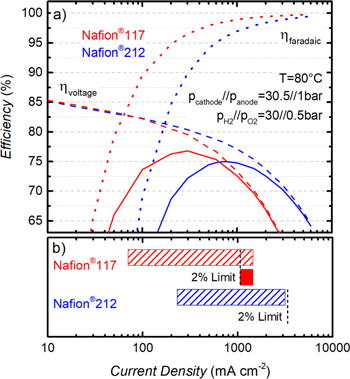
Figure 7. (a) Single-cell (5 cm2) PEM-WE total efficiency vs current density for a Nafion® 117 (red) and a Nafion® 212 (blue) membrane at a temperature of 80 °C, and a H2 partial pressure of 30 bar while the anode compartment is kept at ambient pressure. Dashed lines give the voltage efficiency, ηvoltage, dotted lines give the faradaic efficiency, ηfaradaic, and full lines give the total efficiency (see Eq. 7); note that the contribution of O2 permeation to the faradaic efficiency has been neglected here (see text). (b) Operating range at a total efficiency of ≥70% referenced to the LHV of H2 (with 100% LHV corresponding to 1.25 V) for a Nafion® 117 (red dashed bar) and a Nafion® 212 (blue dashed bar) membrane. The vertical dashed black lines indicate the current density below which the H2 in O2 content in the anode compartment would exceed 2% (derived from Fig. 8). The MEAs are composed of iridium black (0.9 ± 0.3 mgIr cm-2) on the anode and of Pt/C (0.3 ± 0.1 mgPt cm-2) on the cathode.
Download figure:
Standard image High-resolution imageOn the other hand, the faradaic efficiency can be calculated as

where  is the current density at which the cell is operated—corresponding to a certain theoretical H2 production rate—and
  and
and  are the H2 and the O2 permeation current densities in units of mA cm−2. Let us first estimate the relative contribution of
  compared to
  for the here considered PEM-WE operation with
  ≈ 30 bar in the cathode compartment and with ambient pressure in the anode compartment (corresponding to
  ≈ 0.5 bar at 80 °C), first looking into the case where no electrolysis current is applied: even though
  in PFSA membranes is very similar to
  at equal partial pressures of O2 and H2 (note: while the O2 permeability is ≈2 times lower than that of H2,14 each mol of O2 consumes two moles of H2 upon its reaction to H2O on the cathode catalyst), the ≈60-fold higher partial pressure of H2 compared to O2 equates to a ≈60-fold lower
  compared to
  Therefore, under these pressure conditions and at 0 A cm−2,
  is negligible compared to
  On the other hand, under PEM-WE operation at ambient anode compartment pressure, the O2 permeation rate was found to increase by a factor of ≈17 between 0 and 2 A cm−215 (analogous to what is observed for the H2 permeation rate; cf Fig. 5b), so that on the basis of this report the ratio of
  over
over  is projected to change to ≈3/1 at 2 A cm−2. While this would not be entirely negligible anymore, the contribution of
  to the overall faradaic efficiency at >1 A cm−2 can nevertheless be neglected, since the faradaic efficiency is well above 95% at current densities of >1 A cm−2. Therefore, we have neglected
  in the following calculation of the faradaic efficiency that is based only on the current dependent H2 permeation rates taken from Fig. 3 (using the average value of the measurements taken at increasing and decreasing current density), and which is represented by the dotted lines in Fig. 7a. As expected, the faradaic efficiency is higher for the MEA with the thick membrane, especially at <0.5 A cm−2, where the H2 production rate is relatively low compared to the losses due to H2 permeation; again, as argued above, the contribution of
  to the faradaic efficiency is negligible at such low current densities for the here considered PEM-WE operation at a H2 partial pressure of 30 bar and ambient pressure in the anode compartment.
The overall efficiency, taking into account voltage losses as well as losses due to H2 permeation can now be calculated as

and is represented by the full lines in Fig. 7a. An optimum in total efficiency of 77% is achieved for the MEA based on a Nafion® 117 membrane at a current density of ≈0.3 A cm−2. For the Nafion® 212 membrane, a maximum in efficiency of 75% is obtained at a significantly higher current density of ≈0.8 A cm−2. In general, the MEA with the thick Nafion® 117 membrane shows a higher efficiency compared to the thin Nafion® 212 membrane at low current densities, where losses due to H2 permeation are the dominating effect (as discussed above, the contribution by  is projected to be negligible at <1 A cm−2). At high current densities, on the other hand, ohmic losses are dominating the overall efficiency while faradaic losses are almost negligible. Consequently, the MEA with the thin Nafion® 212 membrane exhibits a higher efficiency at current densities above ≈0.7 A cm−2. Considering that operation at high current densities is preferred to reduce the electrolyzer stack costs, a thin membrane would always be favorable in terms of efficiency.
However, besides of the maximum efficiency at a certain operating point, the dynamic operating range, i.e., the range of current densities over which an electrolyzer can be operated, is another important factor for the application of PEM-WEs, especially in the context of an increasing share of renewable energy sources and the resulting intermittent energy output. Defining a minimum total efficiency of 70% (LHV basis) as a target for PEM-WE operation, the MEA with the thick Nafion® 117 membrane could be operated in a range from 0.07 – 1.4 A cm−2 (cf red dashed bar in Fig. 7b) and the MEA with the thin Nafion® 212 membrane in a range from 0.23–3.1 A cm−2 (cf blue dashed bar in Fig. 7b). Translated into a dynamic stack power range (Pstack = Ecell × icell), this corresponds to ≈0.11 – 2.5 W cm−2 and ≈0.36 – 5.5 W cm−2 for Nafion® 117 and Nafion® 212, respectively. This shows that when a minimum efficiency of 70% is the only criteria that is taken into account, a reasonably large dynamic stack power range with a factor of ≈23 (Nafion® 117) and ≈15 (Nafion® 212) can be achieved for both membranes.
For a practical application, however, the lower limit in current density at which an electrolyzer can be operated will not be defined solely by an efficiency requirement, but the H2 concentration in the anode compartment as a result of the H2 permeation through the membrane has also to be considered. Since the HOR activity of iridium-based catalysts is negligible in the relevant anode potentials,13 permeating H2 will only be removed by the exiting anode gas, so that the H2 volume fraction ( ) in the O2-containing anode compartment can simply be calculated from the H2 permeation rates (in terms of
  ) from Fig. 3 and the PEM-WE current (icell) under the assumption that a loss of O2 on the anode due to permeation to the cathode is negligible:

Figure 8 shows the resulting values of  vs current density for different H2 partial pressures for Nafion® 117 (Fig. 8a) and for Nafion® 212 (Fig. 8b). The lower explosive limit for H2 in O2 is ≈4%.12 but in a real system we assume that a safety factor of at least two would be applied, which means that the H2 in O2 volume fraction should not exceed 2%, a value which is marked by the dashed red line in Fig. 8. At a H2 partial pressure of 30 bar and a temperature of 80 °C, this requirement would result in a lower limit for operation of 1.1 A cm-2 for the Nafion® 117 membrane (cf Fig. 8a), while safe operation would not be possible below 3.4 A cm−2 for the Nafion® 212 membrane (cf Fig. 8b). Taking into account the current density range imposed by the efficiency target of 70% LHV (cf Fig. 7) as well as the upper limit for
  of 2%, the MEA with a Nafion® 117 membrane could only be operated in a very small window of current densities from 1.1–1.4 A cm−2, while both criteria cannot be fulfilled simultaneously for the Nafion® 212 based MEA. Therefore, without additional mitigation strategies to lower the H2 concentration in the anode compartment, the desired PEM-WE operating conditions of 30 bar and 80 °C with a reasonable dynamic range would not be possible with MEAs based on either of the two membranes.
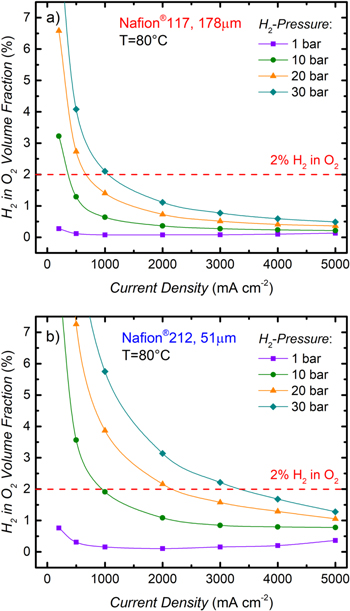
Figure 8. Volume fraction of H2 ( ) in the O2–containing anode gas vs current density for PEM-WE operation at different H2 partial pressures and ambient pressure in the anode compartment at 80°C based on the H2 permeation rates in Fig. 3 (averaged over the values obtained with increasing and decreasing current density) and Eq. 8: (a) for an MEA with a Nafion® 117 membrane (178 μm dry thickness); (b) for an MEA with a Nafion® 212 membrane (51 μm dry thickness). The red dashed lines mark the volume fraction of 2% H2 in O2 which is considered as a safety limit in this work.
Download figure:
Standard image High-resolution imageOn the materials level, this issue could be addressed by using membranes that have a higher proton conductivity to H2 permeability ratio (σH+/PH2 ratio) than PFSA membranes,38 but so far alternative membrane materials such as hydrocarbon (HC) based membranes do not show a more than ≈1.5 – 2 times higher σH+/PH2 ratio than conventional PFSA membranes.38,39 While this would be a benefit, it would still not provide a sufficiently large dynamic power range; furthermore, the durability of HC based membranes still needs to be improved.39 Therefore, other mitigation strategies have currently to be employed in order to prevent the formation of an explosive gas mixture at low current densities in a PEM-WE. A detailed analysis of different mitigation strategies for PEM-WE as well as for alkaline electrolysis can be found in a recent study by Trinke et al.27 The simplest options are to reduce the operating temperature and/or the H2 pressure in order to reduce H2 permeation and to extend the operating range to lower current densities. However, lower temperatures result in higher kinetic overpotentials and lower proton conductivity, i.e., in a lower efficiency, while a lower H2 output pressure translates into a higher energy demand for subsequent mechanical compression. Therefore, for electrolysis at higher pressures, the formation of an explosive gas mixture even at low current densities is generally prevented by the incorporation of a H2/O2 recombination catalyst to react the permeated H2 to water. Typically, a platinum catalyst is used, which can be placed at several locations within the cell. In some instances, it is used in a gas recombiner positioned downstream of the anode gas outlet or it is deposited on the backside of the PTL.30 However, the former approach still leaves the risk of a small volume of potentially explosive gas within the catalyst layer, PTL, and flow-field. Another approach is the incorporation of a recombination catalyst into the membrane, either dispersed within a certain region of the membrane or introduced as an inter-layer, so that permeating H2 and O2 can recombine to water inside the membrane, which was shown to lead to a significant reduction of the H2 in O2 volume fraction in the anode compartment.40–42 Of course, a recombination catalyst will only reduce the risk of the formation of an explosive gas mixture but will not improve the faradaic efficiency. However, as the analysis in Fig. 7b shows, a sufficient dynamic operating range at a high efficiency of ≥70% can be obtained despite of the faradaic losses. Consequently, the implementation of a recombination catalyst is currently the only approach to obtain a reasonable dynamic power operating range for a PEM-WE with PFSA membranes.
Conclusions
In this study, we measured H2 permeation rates during PEM-WE operation at 80°C and various H2 partial pressures for MEAs with a Pt/C catalyst on the cathode, an Ir-black catalyst on the anode, and PFSA membranes with different thicknesses (Nafion® 212 with ≈51 μm and Nafion® 117 with ≈178 μm dry thickness). Based on these results, a detailed analysis of the efficiency as well as the possible operating range of PEM-WEs was presented.
First, in order to validate our test setup based on on-line mass spectrometry, measurements of the H2 permeation rate as a function of H2 partial pressure were performed in a permeation cell setup, i.e., without applying a current. A linear correlation of H2 permeation rate and H2 partial pressure was observed with rates of 0.31 mA cm-2 bar−1 for a Nafion® 117 and 1.10 mA cm-2 bar−1 for a Nafion® 212 membrane, indicating diffusion as the main crossover mechanism. A good correlation of the results with a well-established electrochemical measurement method was observed, confirming the validity of the results measured with the mass spectrometer.
In the second part, H2 permeation rates for MEAs with Nafion® 117 and Nafion® 212 membranes were measured during PEM-WE operation at 80 °C for H2 partial pressures between 1 – 30 bar. Consistent with the literature, a significant increase of the H2 permeation rate with current density was observed. This effect increased with increasing ionomer to carbon (I/C) ratio of the cathode electrode, and the possible causes for this phenomenon were discussed. While the increase of the H2 permeation rate is most pronounced for low H2 partial pressures and high cathode I/C ratios, it can be reduced to a maximum of ≈16% at 5 A cm−2 at a realistic operating pressure of 30 bar by optimizing the I/C ratio of the cathode electrode.
Finally, the impact of the measured H2 permeation rates on the dynamic range of a PEM-WE operated at a H2 partial pressure of 30 bar and an anode compartment pressure of 1 bar at 80 °C was discussed. The current density range over which a total efficiency (i.e., the product of cell voltage and faradaic efficiency) of ≥70% w.r.t. the lower heating value (LHV) of H2 could be achieved was 0.07 – 1.4 A cm−2 for Nafion® 117 based MEAs and 0.23–3.1 A cm−2 with Nafion® 212. This corresponds to a dynamic stack power range of ≈0.11-2.5 W cm−2 (a factor of ≈23) for Nafion® 117 and of ≈0.36-5.5 W cm−2 (a factor of ≈15) for Nafion® 212. To utilize this dynamic range, however, a mitigation strategy to avoid the formation of safety-critical H2 concentrations in the anode gas are required, which currently consists of the application of a H2/O2 recombination catalyst to the membrane, the porous transport layer in the anode, to the stack hardware, or at the anode outlet.
Acknowledgments
This work was funded by the Bavarian Ministry of Economic Affairs and Media, Energy and Technology through the project ZAE-ST (storage technologies) as well as by the German Federal Ministry of Education and Research (BMBF) in the framework of the Kopernikus P2X project (funding number 03SFK2V0). We would like to thank Christian Gebauer (Heraeus Deutschland GmbH & Co. KG) for providing catalyst material as well as Alexandra Weiß and Armin Siebel for the valuable discussions.
Appendix
Appendix. Error calculation
This section briefly explains the assumptions made to determine the measurement error of the H2 permeation rate as displayed by the error bars in Fig. 3 and 4. Three main sources of measurement errors were considered to calculate the overall error of the H2 permeation measurement: (i) For the mass spectrometer a total error  was determined based of the inaccuracy of the calibration curve and fluctuations of the measurement value over time; (ii) An overall error
  was assumed for the components of the test station, i.e., for the inaccuracy of the gas flow determined by the mass flow controllers and the limited accuracy of temperature and pressure regulation; (iii) The largest error is related to an inaccuracy when determining the active area for H2 permeation due to edge effects resulting from the assembly of the MEA along with gaskets and subgaskets in the cell hardware. A schematic drawing of the cell cross section is shown in Fig. A·1. The area of the electrodes,
  is 5 cm2 and is taken into account to calculate the area specific current density. However, to determine the area specific H2 permeation rate an area of 5.76 cm2 was assumed (corresponding to the size of the window in the subgasket,
  i.e., 24 × 24 mm) since H2 permeation can in general occur through the entire subgasket window. If one assumes that the increase in H2 permeation rate with current density is related to H2 super saturation in the catalyst layer as discussed in the previous sections, this effect would of course only occur within the electrode area (5 cm2) and not at the edge between electrode and subgasket. Consequently, assuming an area of 5.76 cm2 to determine the area specific H2 permeation rate would lead to an underestimation of the real value, especially at high current densities where the effect of H2 super saturation is most pronounced. The resulting error which is a function of the current density, i, can be calculated according to


Figure A·1. Schematic drawing of the cell cross section between the flow fields. Edge lengths of the electrodes, subgasket windows, PTLs, and gasket windows are marked.
Download figure:
Standard image High-resolution imageThe first term in Eq. A·1 denotes the difference between the area of the subgasket window,  and the electrode area,
  normalized by
  The second term accounts for the fraction of the H2 permeation rate which is current dependent by subtracting the permeation rate at zero current,
  from the permeation rate at a certain current density,
  normalized by
  For the measured permeation rates shown in Fig. 3 this yields an error of
  depending on current density and pressure. Since this effect would lead to an underestimation of the H2 permeation rate,
  will be considered to determine the error bars in positive direction in Figs. 3 and 4.
On the other hand, while the PTFE gaskets (thickness ≈300 μm) can be assumed as impermeable, the PTFE subgasket is only 10 μm thick and, hence, H2 permeation through the subgasket is not negligible (cf red arrow in Fig. A·1). This additional permeation which is not accounted for in our measurement would lead to an overestimation of the area specific H2 permeation rate. The permeation coefficient for PTFE is about ten times lower than for wet Nafion®21 and the resulting error can be calculated as

Here,  is the area of the gasket window (27 × 27 mm, cf Fig. A·1) and
  is the area of the subgasket window while
  is the membrane thickness and
  the thickness of the subgasket. This yields an error
  for the Nafion® 212 membrane and an error
  for the Nafion® 117 membrane which will be considered to determine the error bars in negative direction in Figs. 3 and 4.
The total error for the H2 permeation rate is then determined according to

This yields total errors  and
and  (Nafion® 212 / Nafion® 117) for the H2 permeation rates which is illustrated by the error bars in Fig. 3 and 4.
Appendix. Repeat experiments
In order to verify that the permeation rate values for different MEAs shown in Fig. 3a and 3b are reproducible, we did conduct a limited number of repeat experiments. The permeation rates obtained from the repeat measurements (open symbols and dashed lines) are compared to the original data (full symbols and full lines) in Fig. A·2.
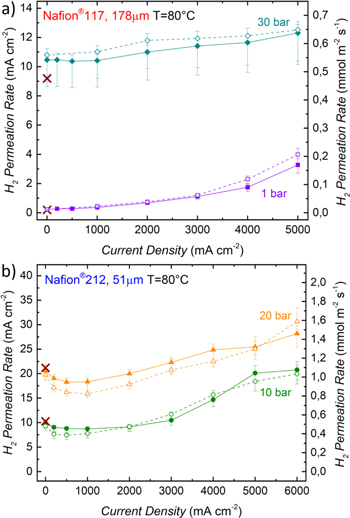
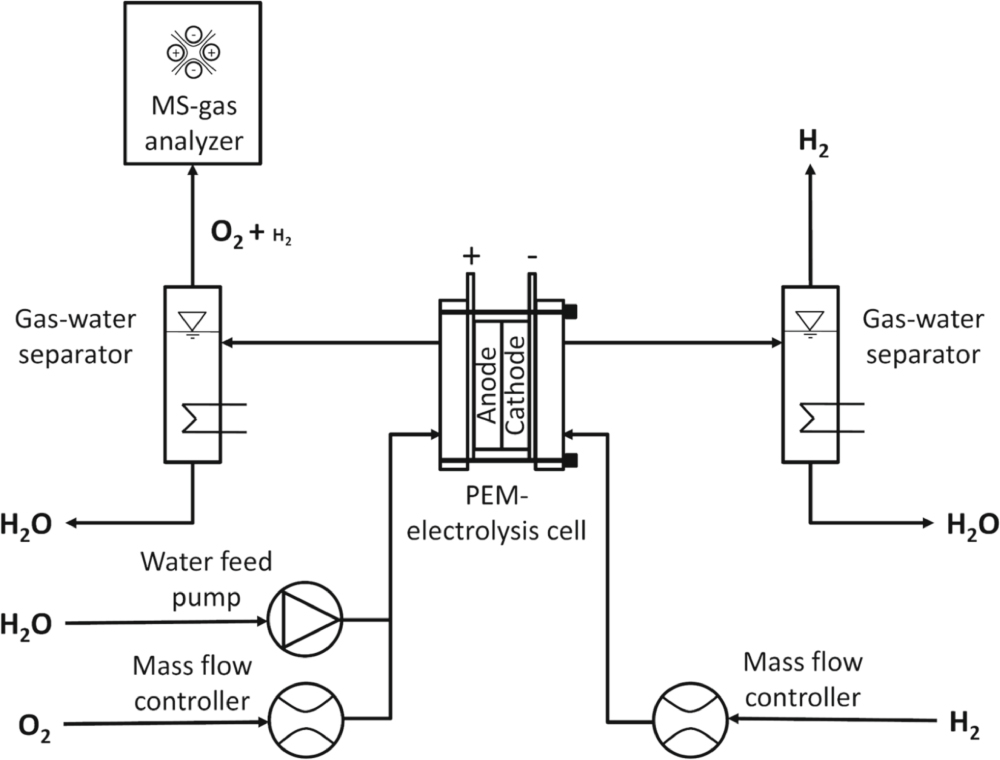
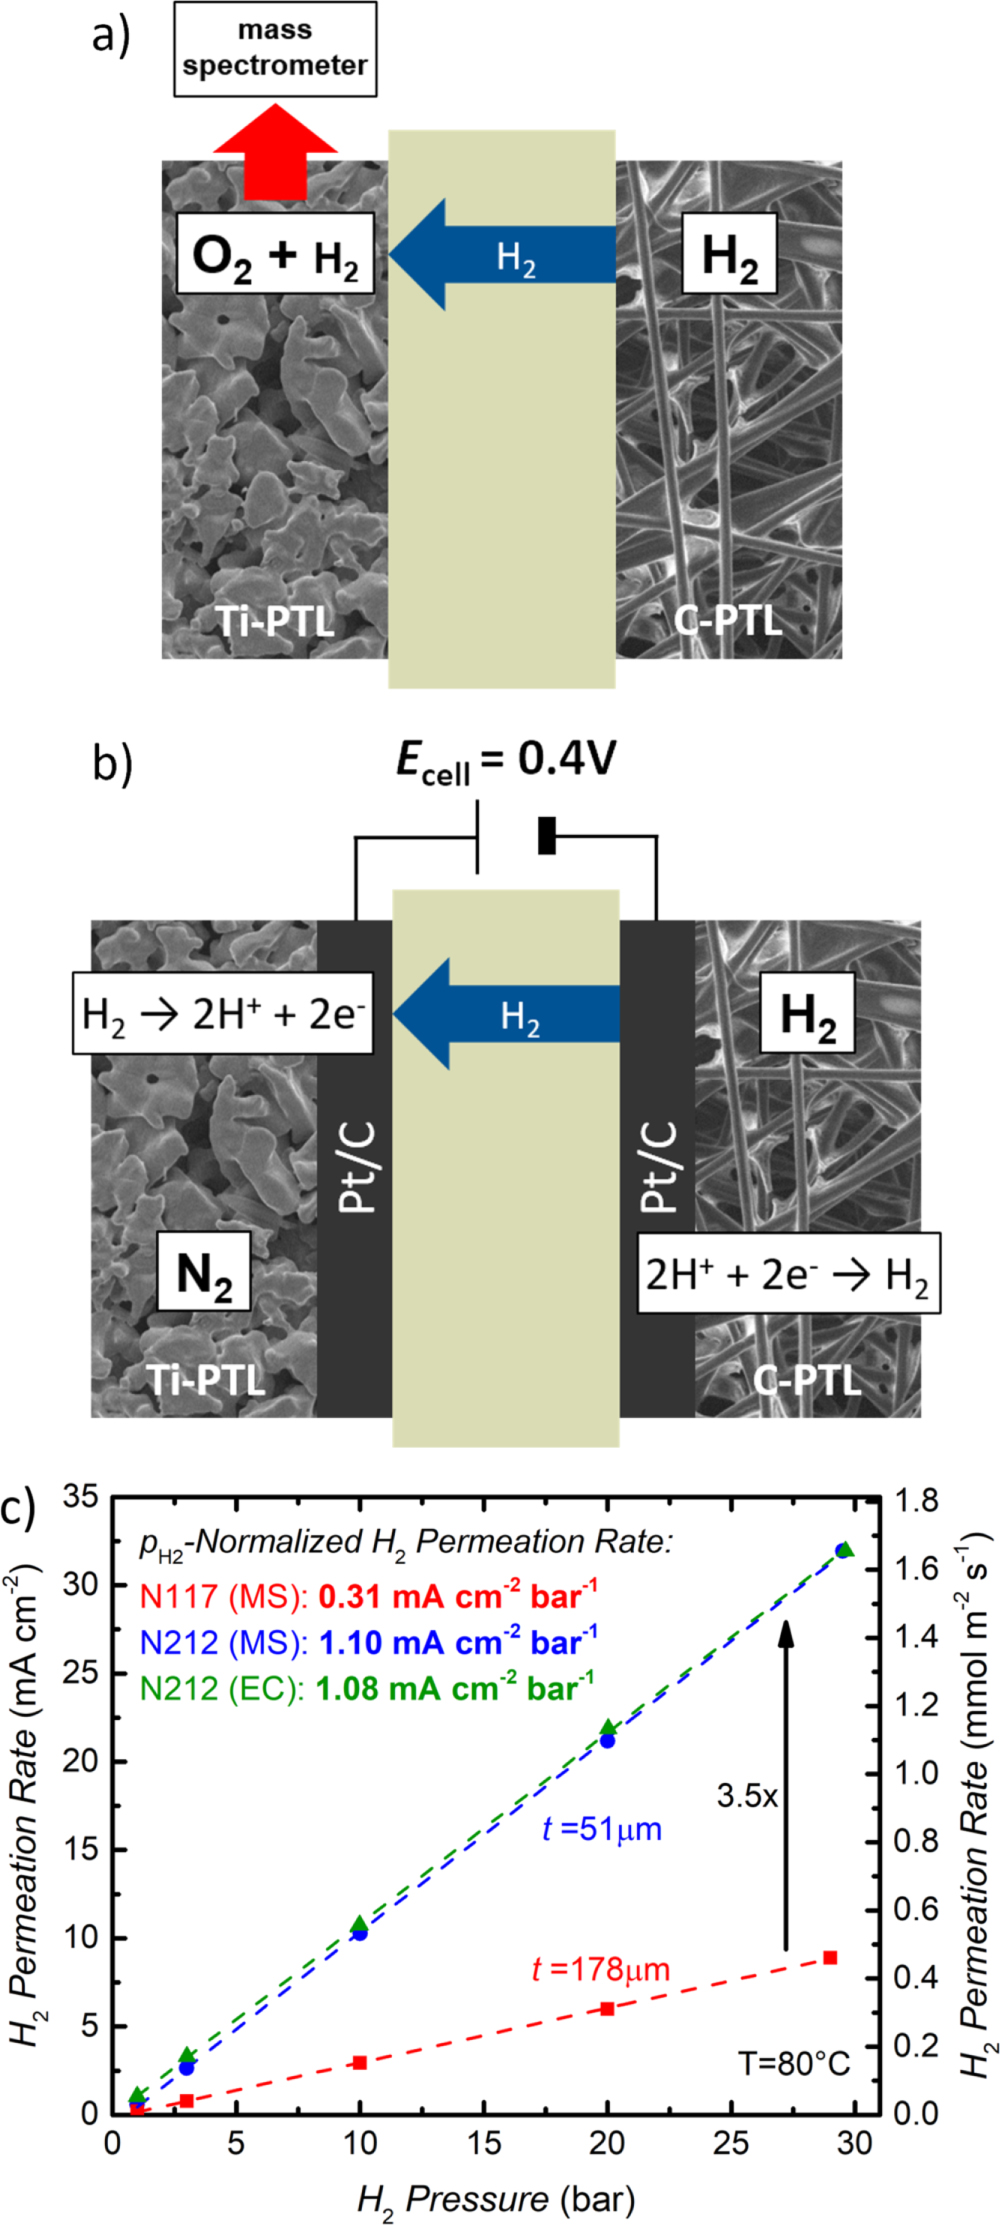
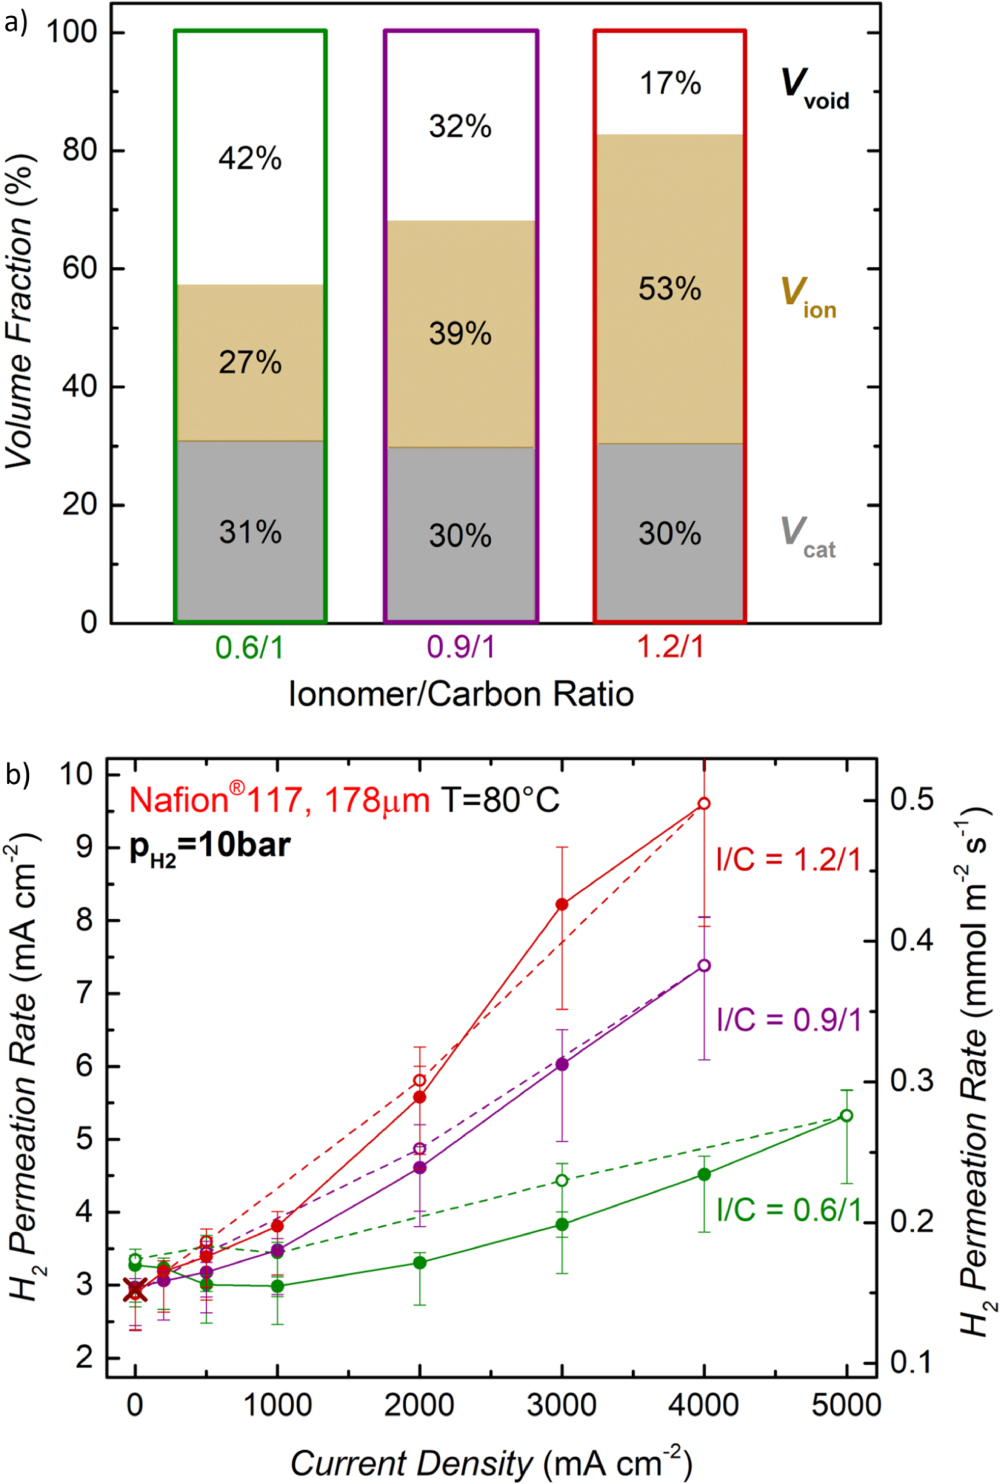
Figure A·2. (a) H2 permeation rate as a function of current density for different H2 partial pressures measured with a Nafion® 117 membrane at 80 °C. (b) H2 permeation rate as a function of current density for different H2 partial pressures measured with a Nafion® 212 membrane at 80 °C. Full symbols along with full lines in represent the original data (shown also in Fig. 3) measured while increasing the current density, whereas open symbols along with dotted lines show the data obtained in the repeat experiment. The electrodes of the MEA consist of iridium black (0.9 ± 0.3 mgIr cm-2) on the anode and of Pt/C (0.3 ± 0.1 mgPt cm-2) with a standard ionomer/carbon mass ratio of 0.6/1 on the cathode. Brown crosses give the H2 permeation rates measured with the permeation cell setup shown in Fig. 2a, i.e., for the membrane without electrodes.
Download figure:
Standard image High-resolution image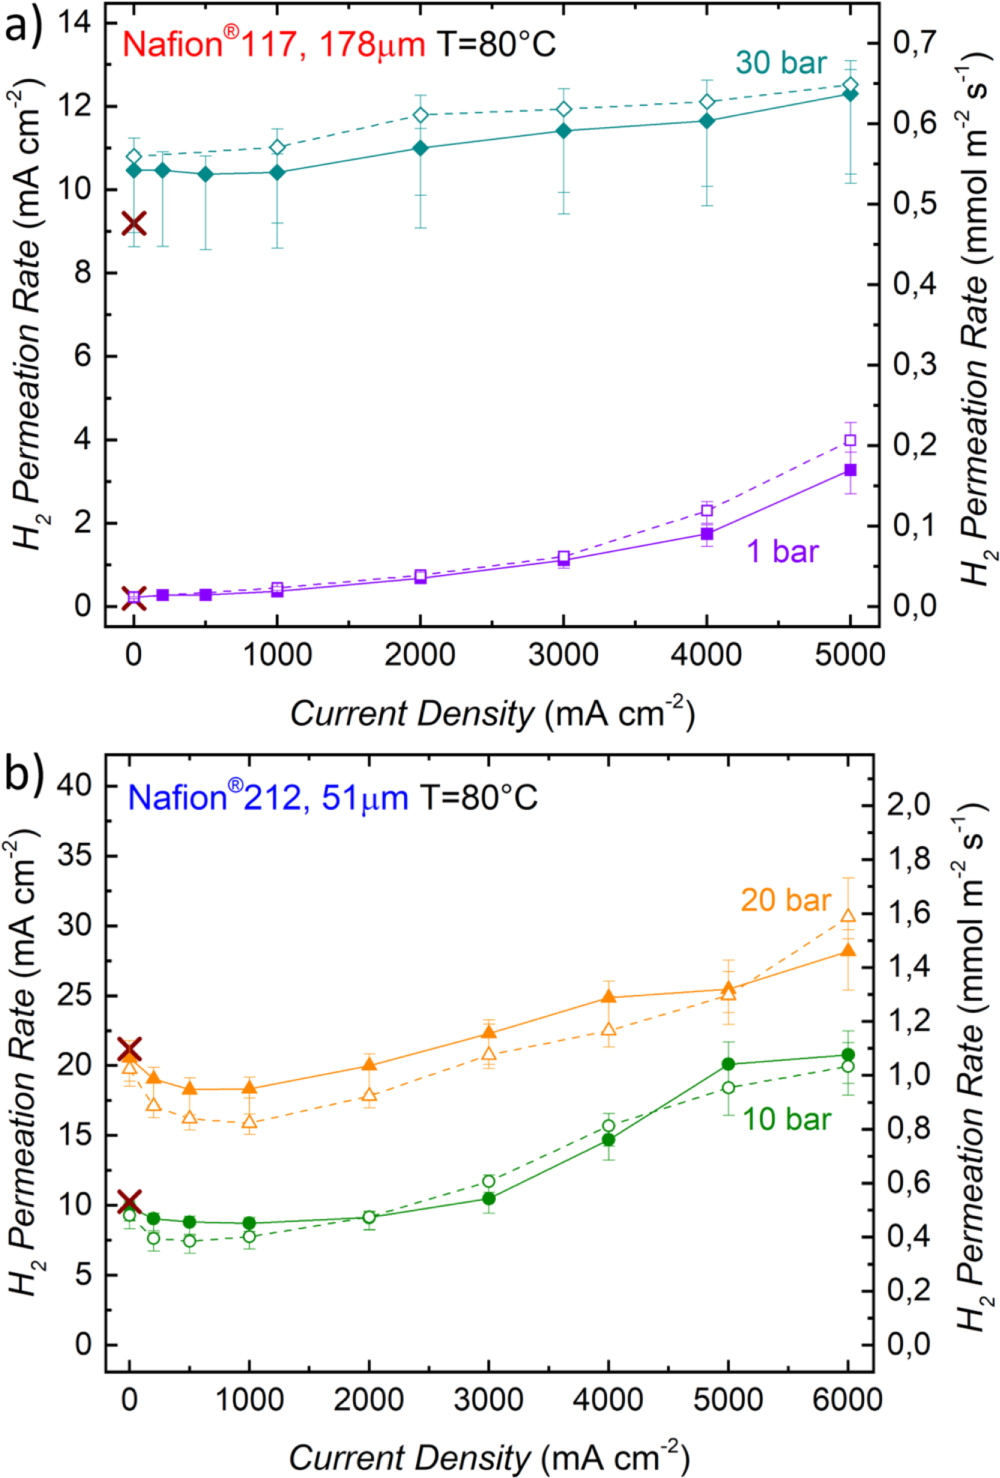