
Abstract
Porous transport layers (PTL) are key components of proton exchange membrane water electrolysis (PEMWE) cells controlling species transport. Further optimization requires better understanding of how PTLs influence overpotentials. In this work, the data from an electrochemical overpotential breakdown is compared to a state-of-the-art model, which includes a Nernstian overpotential description, two-phase Darcian flow and advective-diffusive mass transport. Model parameters are derived from X-ray tomographic measurements, pore-scale calculations, standard models for porous materials and by transferring ex situ measurements from other materials. If the parameter set is available, model results and experimental data match well concerning PTL-related overpotentials at different current densities and operating pressures. Both experimental and modeling results suggest that mass transport through PTLs does not affect a considerable, pressure-independent share of mass transport overpotentials. Both model results and experimental findings conclude that mass transport through the cathode PTL causes overpotentials more than twice as high as through its anode counterpart. Further research opportunities regarding the relationship between PTL bulk properties and experimentally determined mass transport overpotentials are identified.

This is an open access article distributed under the terms of the Creative Commons Attribution 4.0 License (CC BY, http://creativecommons.org/licenses/by/4.0/), which permits unrestricted reuse of the work in any medium, provided the original work is properly cited.
List of symbols
| a | Species' chemical or thermodynamic activity, - |
| c | Molar concentration, mol m−3 |
| d | Pore diameter, μm |
| Dpm | Effective diffusion coefficient, m2 s−1 |
| E | Electric potential, V |
| F | Faraday constant, 96 485.33 C mol−1 |
| g | Gaseous (index) |
| i | Current density, A cm−2 |
| j | Mass flux density, kg s−1 m−2 |
| K | Intrinsic permeability, material-specific flow parameter, m2 |
| KH | Henry volatility coefficient, Pa |
| kr | Relative permeability, material-specific flow parameter, - |
| M | Molar mass, kg mol−1 |
| n | Amount of constituents, mol |
| nd | Electroosmotic drag coefficient, - |
| p | Pressure, Pa |
| pc | Capillary pressure, Pa |
| R | universal gas constant, R = 8.314 J mol−1 K−1 |
| S | Phase saturation, fluid volume divided by pore space volume, m3 m−3 |
| T | Temperature, K |
| l | Liquid (index) |
| x | Through-plane spatial coordinate, m |
| y | In-plane spatial coordinate, transverse to channel axis, m |
| β | Phase subscript, β ∈ {l, g} |
| γ | Surface tension at fluid-fluid interfaces, N m−1 |
| Γ | Boundary of a domain |
| η | Electric overpotential, V |
| θ | Contact angle between liquid and solid at gas interface, ° |
| ϑ | Temperature, °C |
| κ | Species superscript, κ ∈ {H2O, H2, O2} |
| μ | Dynamic viscosity, Pas |
| ρ | Mass density, kg m−3 |
| σ | Thermal conductivity, W m−1 K−1 |
| Σ | (Solution) domain |
| ϕ | Porosity, m3 m−3 |
| χ | Mole fraction, mol mol−1 |
Proton exchange membrane water electrolysis (PEMWE) is an energy conversion technology that can contribute to improved management of renewable resources and ultimately lower greenhouse gas emissions. In PEMWE, porous transport layers (PTL) are used to mechanically support the catalysts and membrane, to collect and distribute electrical current and to enable the transport of reactants and products to and from catalysts. PTLs are often manufactured as sintered powders or felts, but also the use of meshes, perforated plates or foils has been reported.1–3 Generally, titanium is used on the anode side in order to resist the harsh conditions, i.e. relatively high potentials and an acidic milieu. Since the titanium-based PTLs are primarily designed for applications in the filter industry, an optimization of PTL materials is still required for use in electrolysis in order to reduce investment costs and overpotentials.4 It is, however, not fully understood how overpotentials are influenced by PTL properties.
Experimental publications imply several correlations between PTL properties and overpotentials, as briefly summarize below. Investigations suggest an optimal pore size between 9 μm to 20 μm with respect to reducing overpotentials.5–10 However, the optimum might be influenced by the operating conditions and by other cell components' properties. Larger pore diameters were associated with reduced catalyst contact area,2,11 fewer reaction sites3 and lower capillary pressures.2 Concerning capillary pressures, however, there is no consensus as to whether overpotentials increase with smaller capillary pressures.5,6 Typically, a compromise between mass and electrical transport resistances is sought as PTL properties can affect activation, ohmic and mass transport overpotentials in different and even opposite ways.1,5,10,12,13
Mass transport overpotentials are still among the least understood phenomena in electrolysis due to the complexity of the processes and the lack of empirical data. They are quantifiable by a cell voltage breakdown, which includes subtraction of other overpotentials from the measured cell voltage. Ongoing research on cell voltage breakdown consists of revising assumptions of ohmic and activation nature, improving accuracy and linking overpotentials to distinct processes. Being able to attribute overpotentials to transport processes facilitates knowledge-based material optimization.
Some modeling efforts have been made to predict mass transport overpotentials.7,12,14–20 Mass transport overpotentials are predominantly related via the Nernst equation to species concentrations, which are derived from a mass transport model. We refer the reader to Refs. 21–23 for a general overview of mass transport models for PTLs and focus subsequently on approaches applied for overpotential modeling. The majority of these are continuum approaches considering either diffusive15,16,20,24 or advective transport12,19,25,26 of water and oxygen through a PTL. A few models extend or replace the continuum approach with liquid film formation,7 nucleation18,27 and bubble dynamics.27 For almost all published models, calculated cell voltages generally agreed well with polarization measurements or could be calibrated to reach agreement, but neither were deviations from measured data quantified nor actual values for mass transport overpotentials provided.7,12,15,18–20 All models predicted reduced mass transport overpotentials with smaller PTL thickness in through-plane direction, except for a non-continuum model proposed by Nouri-Khorasani et al.27 In addition, mass transport is facilitated either by high effective diffusion coefficients if diffusion based models are used or by large pore sizes in nucleation models. Alternatively, continuum two-phase flow models predict reduced mass transport overpotentials with increasing intrinsic permeability and wettability.12
It should be noted that non-continuum approaches, such as pore scale and pore network models, have been used to reproduce microfluidic experiments mimicking flow through PTLs28 and to describe two-phase flow in gas diffusion layers of PEM fuel cells.29–31 The advantage of these approaches is that no representative elementary volume is required, provided that the pore geometry is given. However, path-connected flow has been observed in the larger part of a model PTL in microfluidic experiments32 and a Darcian behavior was observed for sintered powder and felt PTLs in presence of both liquid and gaseous phases.33 Operando transport visualizations for PTLs have so far only been performed for meshes and perforated foils in which gas bubble dynamics were found to be the predominant transport mechanism.3,34–37 Gas bubble diameters of up to ca. 100 μm were reported under operando conditions for mesh sizes and perforation diameters of at least 100 μm.3,34,35,38 Felts and sintered powders exhibit tortuous pores with diameters generally smaller than 100 μm, which impedes the visualization of transport processes. Neutron radiography saturation field measurements, however, imply partly stationary phase distributions for these materials.39,40
In this work, we intend to provide a better understanding of how PTLs influence mass transport overpotentials. We adopt a multiphase continuum modeling approach for the flow through porous media41 in order to model the mass transport through an extensively characterized sintered powder PTL. The model includes Darcian fluid flux and advective as well as diffusive mass transport. Most adopted model parameters have been previously derived from ex situ X-ray tomographic microscopy structure analyses.6,13 Gaps in the parameter set are herein filled according to capillary flow porosimetry measurements for a similar sintered powder PTL33 and standard parameter models coming from soil sciences. From the modeled fluid states, we further derive mass transport overpotentials via an electrochemical model, which is based on the Nernst equation. Model results are compared to an extensive data set generated by electrochemical measurements for a differential cell setup with identical PTLs used on the cell's anode and cathode sides.13 A cell voltage breakdown method is applied in order to isolate mass transport overpotentials from the measurements. Finally, the influence of several material properties are discussed by means of model-experiment comparisons for two other PTL materials.
Model and Materials
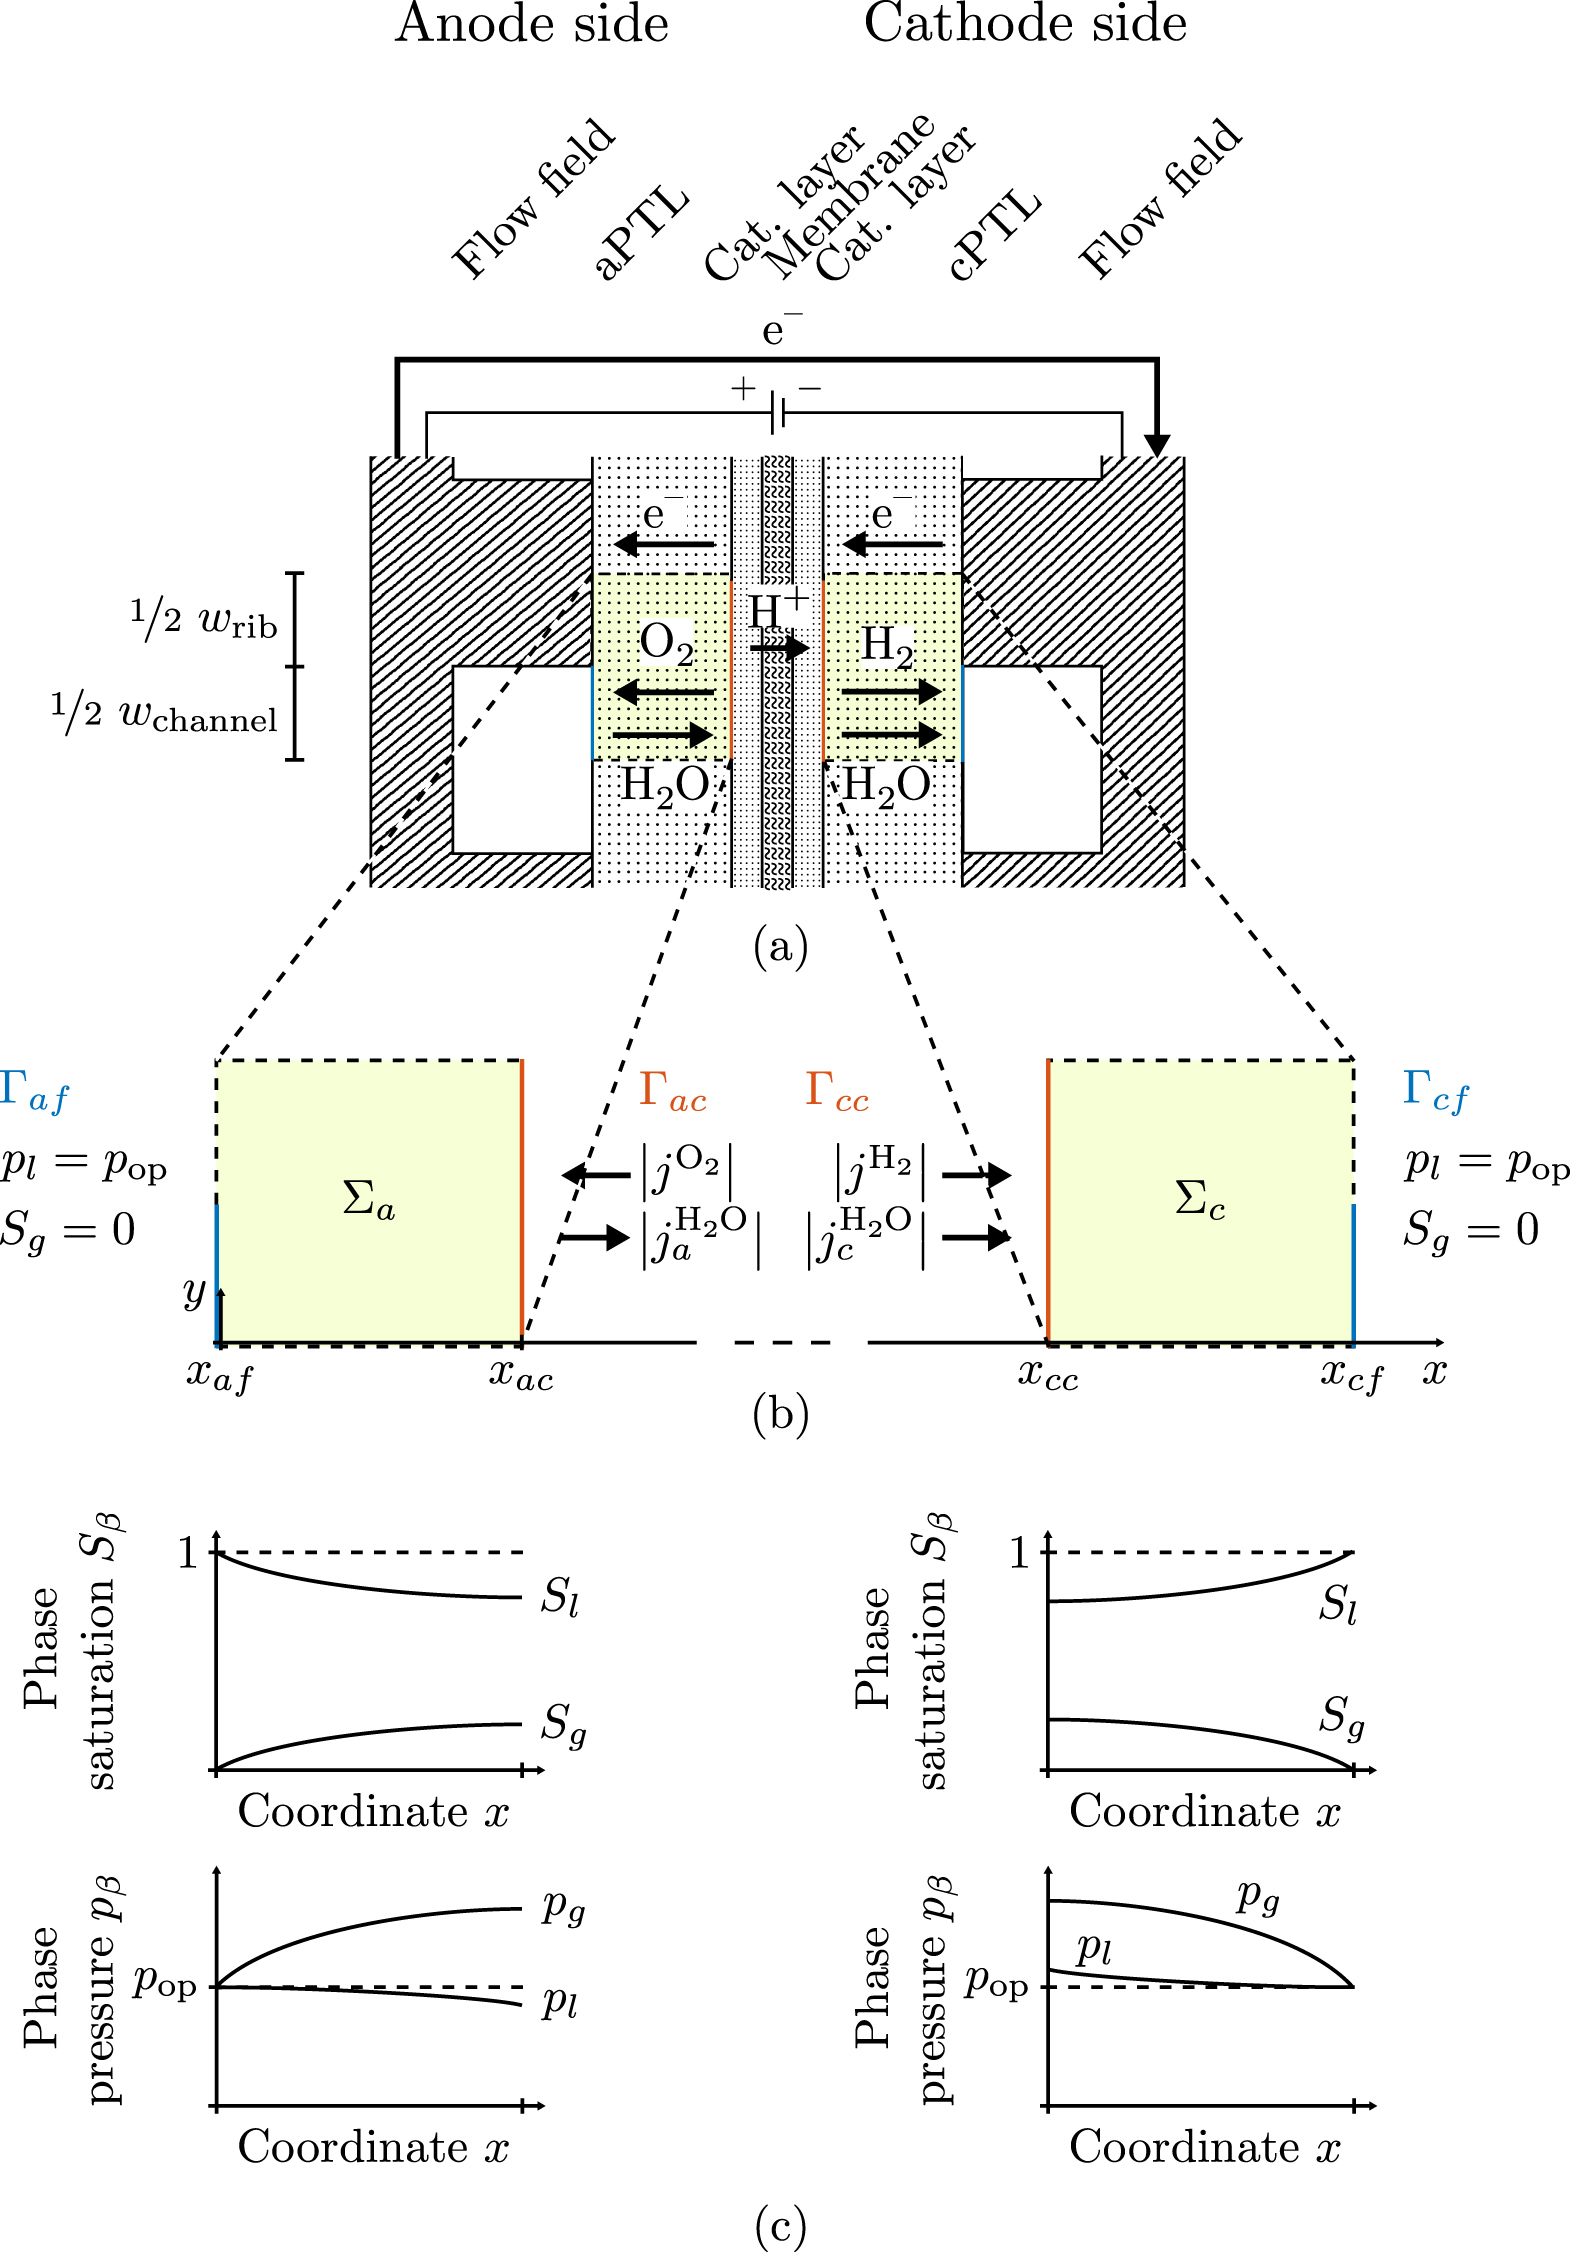
This work focuses on the influence of anode and cathode-side porous transport layers (aPTL and cPTL) on mass transport overpotentials. The PTLs are located within a PEMWE cell as shown in Fig. 1a. The two half reactions of water electrolysis associated with the anode and cathode side, respectively, are the oxygen evolution reaction (OER) and the hydrogen evolution reaction (HER).

Figure 1. A typical PEMWE cell setup and schemata illustrating the used model: (a) anode (left) and cathode (right) cell components as well as basic transport trajectories of species; (b) model domains Σa and Σc (half a channel and half a rib width high; visualized here horizontally stretched) and boundary condition definitions; (c) qualitative phase saturation and phase pressure profiles along the through-plane coordinate x ().

Download figure:
Standard image High-resolution imageWe consider the transport of mass, which consists of the species water H2O, oxygen O2 and hydrogen H2. Their transport trajectories are roughly depicted in Fig. 1a. The molecules O2 and H2 are produced inside or in the vicinity of catalyst layers and move from there to the nearest flow field. Water is supplied to the cell through the anode flow field and either moves from there to the OER reaction sites, where it is consumed, or is transported by an electroosmotic drag to the cathode side.
The herein adopted model for predicting overpotentials from PTL properties consists of two parts, which will be introduced in this section. The first part is the electrochemical model, which describes how overpotentials depend on the conditions at the PTL-catalyst layer interface. The second part describes the mass transport through PTLs. Afterwards, the numerical solution method is briefly introduced and model parameters are presented. At the end of this section, the adopted analysis of electrochemical measurements, i.e. the cell voltage breakdown, is described.
Electrochemical model
The adopted electrochemical model determines the overpotentials related to mass transport through PTLs, ηmt,PTL. Most commonly, mass transport overpotentials are calculated by taking the difference between the half-cell reduction potential E at the transport path's starting point and at its destination. The potential at the starting point corresponds to the hypothetical case in which transport resistances are zero. For the transport through PTLs, the potentials at their surfaces on the flow field and catalyst layer side are evaluated. Figure 1b depicts these surfaces (blue and orange) as well as associated definitions of model boundaries Γ. We sum the mass transport overpotentials of aPTL and cPTL to obtain the total overpotentials ηmt,PTL and calculate the required potentials via the Nernst equation:
The last row in Eq. 1 represents the most common grouping of the logarithmic arguments in the electrochemical community. The subscripts of the species' activities a indicate the model boundary Γ at which they are evaluated. Further quantities in the equation are the universal gas constant R, the temperature T and the Faraday constant F, which can also be found in the list of symbols at the end of this work. Protons' activities are not taken into account, as we assume that they depend only on the proton transport through the catalyst layers and membrane.
We assume that species can be present either in a liquid or gaseous phase and that phase compositions are following Henry's and Rault's laws. In this case, activities correspond to mole fractions,42
where n denotes the amount (expressed in moles) of mixture constituents, i.e. species. We evaluate n over an arbitrary control volume V and obtain the shown notation in molar concentrations, in which c without a superscript denotes the concentration of all constituents regardless of their species. In the general two-phase case, the activities are calculated by
The symbol S in above equation denotes the phase saturation and the subscripts l and g stand for the liquid and gaseous phase, respectively.
Phase composition
The concentrations in Eq. 3 are determined from the phase pressures pg and pl and the following assumptions. We require that both phases are at steady state conditions and neglect nucleation and related supersaturation effects,43 such that thermodynamic equilibrium applies. It follows for the gas phase that the constituents' partial pressures are proportional to their molar fractions according to Rault's law,

We derive the gas density ρg from the ideal gas law, neglecting real gas effects, as compressibility factors for oxygen and hydrogen are in the range of 0.978 to 1.001 at investigated operating conditions .44 If the water vapor's partial pressure is assumed equal to the equilibrium vapor pressure , which can be calculated with standard thermodynamic formulations,45 all mole fractions are known and the species' molar concentrations are obtained via
![${{\vartheta }}_{{\rm{o}}{\rm{p}}}\in [40{}^{\circ }{\rm{C}},60{}^{\circ }{\rm{C}}],\,{{p}}_{{\rm{o}}{\rm{p}}}\in [{{p}}_{{\rm{a}}{\rm{m}}{\rm{b}}{\rm{i}}{\rm{e}}{\rm{n}}{\rm{t}}},50\,{\rm{b}}{\rm{a}}{\rm{r}}]$](https://content.cld.iop.org/journals/1945-7111/167/11/114511/revision2/jesaba5d4ieqn2.gif)


where Mg is the gas phase's mean molar mass. The gas viscosity μg depends on the composition of the gas phase and is calculated according to the Wilke method.44 The composition of the liquid phase is calculated using Henry's law,
The Henry volatility KH as well as the liquid viscosity μl and the liquid water concentration are calculated according to standard thermodynamic formulations.45,46 The dissolved species' influence on μl and is neglected and the solute concentrations are obtained from


Mass transport model
The saturations for Eq. 3 as well as the phase pressures are determined by the mass transport model. The model's domain definition and boundary conditions are chosen according to the experimental setup described by Suermann et al.13 The transport through anode and cathode PTLs is modeled within two distinct solution domains Σa and Σc, as seen in Fig. 1b. The flow field in the experimental setup is comprised of five 20 mm long, straight channels. In such a differential cell setup, gradients of any quantity are negligible along the channels. We therefore neglect transport inside PTLs in this longitudinal direction. Instead of modeling all five channels along the other in-plane direction, we assume the same conditions under each channel and model only one. We make use of symmetry axes by bordering the solution domain along them and defining no-flow conditions on them, as shown by the dashed lines in Fig. 1a. The oxygen and hydrogen evolution reactions (OER and HER, see definitions above) are modeled as mass flux boundary conditions at the interfaces between PTLs and catalyst layers (CL). This corresponds to the assumption that both reactions and nucleation processes take place at the boundaries Γac and Γcc or inside the CLs. At the boundary Γac, the following mass fluxes jκ are prescribed according to Faraday's law:
We denote with i the current density and the signs of fluxes correspond to the through-plane axis x (positive in the anode-to-cathode direction). In addition to the OER, water flux due to electroosmotic drag is also considered by introducing a non-zero drag coefficient,
Equation 9 describes the experimentally observed dependency of the drag coefficient on membrane temperature.47 On the cathode side boundary Γcc, the following mass fluxes are defined:
Mass fluxes other than those in Eqs. 8 and 10, particularly those due to gas crossover, are neglected in the current model.
For Eqs. 8 and 10, an assumption for the current density distribution along the in-plane coordinate y is required. We are not aware of any published or unpublished current density mapping results that differentiate the states under channels and ribs. We have found, however, that varying current densities by ±12.5% around a mean value changes model results for averaged ηmt,PTL by less than ±1% compared to a case with constant current density i(y) = const. (results not shown). Due to the relatively small influence and the fact that no experimental results are available, we have assumed constant current densities for all shown simulations. It should be noted that in this work, we always evaluate ηmt,PTL overpotentials averaged over the y coordinate as we compare model results to integrally measured data without any spatial distribution.
On the domains' flow field sides, outflow boundary conditions are defined at the channels and no-flow boundary conditions are set under the ribs. We assume for the channels that the liquid pressure inside them is known and that all gas is immediately transported away from the PTL surface. The latter assumption is based on the aforementioned differential cell concept and the fact that convection was reported for both anode and cathode flow fields13 and the channel lengths of 20 mm are considered too short to facilitate significant gas accumulation. To this end, we define the following conditions on the boundaries Γaf and Γcf: pl = pop and Sg = 0, as shown in Fig. 1b.
By defining a capillary pressure boundary condition pc > 0 instead of the saturation condition (Sg = 0), it is possible to account for the case when the gas phase requires a higher pressure than pl in order to exit the PTL. As the herein considered PTLs are hydrophilic, the capillary pressure is defined as pc = pg − pl. The said phenomenon was observed in microfluidic experiments at so-called limiting throats.32 It is not known if limiting throats play a role for the herein investigated materials. If so, for the investigated PTL type with the product identification T10, the limiting throat diameter could be approximated as 25.9 μm. This diameter has been associated with bottleneck effects in mercury intrusion porosimetry data for T10.48 A corresponding capillary pressure boundary condition can be calculated via the Young-Laplace equation,

assuming an often reported contact angle of 70° for this kind of materials.12,26,49 Applying this capillary pressure boundary condition on Γaf and Γcf, however, leads to virtually the same model results as the saturation condition Sg = 0 (less than 1% difference in ηmt,PTL for i ≥ 0.1 A cm−2 at default conditions ϑop = 50 °C and pop = pambient, results not shown). Sg = 0 is therefore preferred for T10. The influence of limiting throats could not be estimated for the other investigated materials due to lack of data, which is further discussed in the results section of this work.
In addition to the domain definition and the boundary conditions, the model consists of the governing equation, which is a steady-state mass conservation of the following form:
The governing equation incorporates both component transport and fluid flow, which are assumed to follow Fick's and Darcy's laws:
In Eq. 13, the effective diffusion coefficient Dpm,β is calculated according to the parallel pore model50 and a Millington-Quirk-type tortuosity τ51:

In this equation, ϕ is the PTL's porosity and the phases' diffusion coefficients D are calculated according to Ref. 44. For the material T10, diffusion of dissolved oxygen and hydrogen is negligible at current densities i ≥ 1 mA cm−2 (diffusion's contribution to and is less than 0.05% at default conditions ϑop = 50 °C, pop = pambient, as shown in the appendix), whereas vapor diffusion might play a role at high gas saturations, cf. Eq. 15.


In Eq. 14, the intrinsic and relative permeabilities are K and kr, respectively. The underlying continuum approach behind Eq. 14 assumes each phase to be continuously distributed throughout the whole solution domain.41 It follows from this assumption that the two-phase flow can be parametrized with saturation dependent functions for the capillary pressure pc(Sl) and for the relative permeabilities krl(Sl) and krg(Sl). These parameter functions are assumed to be unique and monotonic. For this reason, the model yields monotonic spatial profiles for both phase saturations and phase pressures, as seen in Fig. 1c, with pressure gradients being generally higher at locations with low phase saturation Sβ. Note that in this work, we focus on cases with balanced operating pressures such that pl is identical on Γaf and Γcf. Accordingly, there is a pressure jump between both sides of the membrane that corresponds to the electroosmotic pressure differential, as shown in Fig. 1c. In this work, the pressure differential results from the PTL models and is not calculated by an electroosmosis model.

Including potential energy in Eq. 14 did not influence simulation results by more than 0.6% at default conditions (ϑop = 50 °C, pop = pambient, results not shown), therefore gravitational effects are neglected in this work. Furthermore, model results are calculated under the assumption of isothermal conditions. This simplification has limited effect on the model results, as discussed in the results section.
To summarize, the presented mass transport model takes the current density i, the operating pressure pop and the operating temperature ϑop as inputs and also needs parameters for the intrinsic permeability K, the porosity ϕ, the capillary pressure function pc(Sl) and the relative permeabilities krβ(Sl). The model's outputs are the phase saturations and phase pressures, the latter of which determine the species concentrations .

The mass transport model is solved using the DuMuX framework.52 The solution of the governing Eq. 12 is found by time integration of its transient form,
from a fully liquid saturated initial state (Sl(t0) = 1 over Σa and Σc) until steady-state conditions are reached. The box method is adopted for spatial discretization and a backward Euler scheme is used for time integration.50 A grid resolution of 80 by 160 elements was employed after performing a grid sensitivity study (based on <1% change in modeled overpotentials when doubling grid resolution in both dimensions). The solution process, furthermore, includes Newton-Raphson iterations in order to treat non-linearities and the coupled nature of solved equations.
Parametrization
The examined PTL materials are three sintered titanium powders from type SIKA T5, T10 and T20 produced by GKN (DE). As the materials were initially manufactured for the filter industry, the numbering corresponds to the maximum particle diameter (in μm) passing the material in through-plane direction. All materials have a nominal thickness of 1 mm and have been analyzed with X-ray tomographic microscopy by Suermann et al.13 The porosities, intrinsic permeabilities and pore size distributions have been derived by flow computations and geometric processing using tomography data. The intrinsic permeabilities have been found to be isotropic.13 The main material properties are listed in Table I.
Table I. Porous media properties of investigated PTL materials according to Ref. 13.
| T5 | T10 | T20 | |
|---|---|---|---|
| Permeability K/(10−12 m2) | 1.4 ± 0.0 | 3.4 ± 0.1 | 7.7 ± 0.2 |
| Thermal conduct. σ/(W m−1 K−1) | 11.6 ± 0.3 | 9.6 ± 0.4 | 11.0 ± 0.7 |
| Porosity ϕ/10−2 | 30 ± 2 | 35 ± 2 | 33 ± 2 |
| Mean pore | 30 | 38 | 57 |

For T10's capillary pressure function pc(Sl), Lettenmeier et al.6 have calculated curve points with the pore morphology method (material named "sintered Ti" therein). We adopt this curve and interpolate between points using cubic hermite splines, see Fig. 2a. For the materials T5 and T20, no such calculations are available and their capillary pressure curves can only be estimated, as discussed later in this work.

Figure 2. Saturation dependent parameters for the T10 and a similar material: (a) T10's capillary pressure curves as calculated with the pore morphology method6; (b) T10's assumed relative permeabilities: krg as measured for the "sample 3" material by Bromberger et al.33 and krl as predicted by the Mualem model.
Download figure:
Standard image High-resolution imagePore scale calculations of the relative permeabilities are not available for the investigated materials. We therefore apply the measured relative gas permeability curve of a sintered powder PTL, which is similar to the herein investigated materials (see material "sample 3" in Ref. 33). The krg values, referred to in the publication as "normalized dry cross-sectional area," were obtained by capillary flow porosimetry with a quasi-static liquid phase. Global saturations were determined by weighing the sample. Global liquid saturations were measured in the range from 0 to 0.75 (upper limit is determined by breakthrough) which are herein linearly scaled to the [0, 1] range in order to obtain local saturations (local liquid saturations at throats, which dictate krg, are generally higher than global saturations, cf.32).
We are not aware of any published or unpublished measurements of liquid permeabilities for sintered powder PTLs and apply a curve obtained with the Mualem model.53 The model is standard in soil sciences and constructs the liquid permeability based on the capillary pressure curve:
Both an alternative standard model by Burdine54 and a constant liquid permeability krl(Sl) = 1 yield virtually the same results as the Mualem model (difference in calculated overpotentials is less than 0.01% at default conditions ϑop = 50 °C, pop = pambient, i ≤ 4 A cm−2, results not shown) and consequently, the model result are found to be negligibly sensitive to krl.
Cell voltage breakdown
The considered PTL materials have also been characterized by operando measurements and a cell voltage breakdown.13 The voltage breakdown yields the overpotential ηmtx which includes all types of mass transport processes, cf. Fig. 3a.

Figure 3. Schematic diagram of the cell voltage breakdown and operating pressure dependency: (a) constituents of the cell voltage; (b) scheme of the experimentally found convergence of ηmtx with balanced operating pressure13,55 (solid curves for i = 1 A cm−2 and dashed curves for i = 3 A cm−2).
Download figure:
Standard image High-resolution imageHere, Ecell represents the measured cell voltage, the thermodynamic cell voltage, ηact the activation overpotential and ηΩ the ohmic overpotential. The ohmic overpotentials are obtained from high frequency resistance (HFR) measurements and activation overpotentials are determined via the Butler-Volmer equation considering the transition state theory and the concept of a rate determining step.56 The ηmtx overpotentials include a number of different loss types, where anodic and cathodic contributions are merged. Such types of losses contain, but are not limited to, mass transport resistances to and from the electrochemical active surface, proton transport resistances within the CL and current density dependent hydrogen and oxygen gas crossover through the membrane. The gas crossover leads to a concentration increase in the ionomer of the CL shifting the thermodynamic equilibrium cell voltage.57 The CL's proton transport resistances are calculated using further experimental data with identical materials using a transmission line model approach.55 According to the presented Nernst-type electrochemical model, proton transport is isolated from considered mass transport overpotentials:


See Table II for an overview of overpotentials.
Table II. Overview of examined overpotential types; in this work, experimental data is available for ηmtx, , ηmt and ηmt,p−dep (as a result of voltage breakdown, mass transport overpotentials may also contain overpotentials due to other unknown processes).

| Overpotential | Related mass transport process |
|---|---|
| ηmtx | All |
| CL proton transport | |
| ηmt | All excluding CL proton transport |
| ηmt,p−ind | pop-independent part of ηmt |
| ηmt,p−dep | pop-dependent share of ηmt |
| ηmt,PTL | Exclusively through bulk PTL |

Variations of operating pressures showed a decrease of mass transport overpotentials with increasing operating pressure, especially for pressure configurations where both the anode and the oxygen sides are pressurized.58 Moreover, ηmt overpotentials converge in the higher two-digit pressure range (measured in bar at symmetric pressure conditions) for all investigated PTL types,13 as shown in Fig. 3b. This convergence allows a division of ηmt overpotentials into pressure-dependent (above the converged value) and pressure-independent (equal to the converged value) overpotentials: ηmt,p−dep and ηmt,p−ind, respectively. The convergence value is found to be approximately the same for all investigated materials. Thus, a PTL-independent convergence value is found. From this, we derive the hypothesis that all PTL-related mass transport overpotentials ηmt,PTL are part of pressure-dependent mass transport overpotentials ηmt,p−dep. In other words, we assume that mass transport through PTLs does not affect ηmt,p−ind overpotentials, which account, depending on current density and PTL material, for ca. 40% to 75% of ηmt overpotentials at intermediate and high current densities (i.e. at 0.5 A cm−2 ≤ i ≤ 4 A cm−2 and default operating conditions ϑop = 50 °C, pop = pambient).13 Model results for PTL-related overpotentials are therefore compared to the experimental data on ηmt,p−dep in this work. Breakdown data on ηmt,p−dep is available for different operating conditions (current density, pressure) as well as for different PTL types (T5, T10, T20). Although this already constitutes a comparatively broad data set, supplementary measurements would be helpful for further breakdown of ηmtx overpotentials, e.g. at different temperatures and pressures, differential pressure conditions (in both directions) or using a reference electrode separating anodic and cathodic contributions.
Results
In this section, model results are presented for the previously introduced T10 material. The model parameters are chosen according to the prior section, i.e. using pore scale simulations, geometric analysis of tomography data, measurements and standard parameter models. The corresponding model results are compared with experimental breakdown data. Moreover, we examine the model's ability to reproduce the measured influence of changing operating conditions.
Influence of the current density
The adopted continuum model with previously described parameters yields the results for anode- and cathode-specific bulk PTL mass transport overpotentials, ηmt,aPTL and ηmt,cPTL, that are shown in Fig. 4. On both anode and cathode side, the PTL consists of the T10 material and operating conditions correspond to ambient pressure and an operating temperature of 50 °C. The overpotentials attributed to the cathode PTL are found to contribute by 68% to 71% to the total PTL-related mass transport overpotentials ηmt,PTL.

Figure 4. Experimentally determined and modeled mass transport overpotentials for the T10 material at ϑ = 50 °C and pop = pambient conditions: model parameters are chosen as described in the previous section (without any calibration); ηmt,aPTL and ηmt,cPTL overpotentials account for the transport in anode and cathode PTL, respectively, whereas ηmt,PTL comprises both PTLs.
Download figure:
Standard image High-resolution imageBoth model results and experimental results show that overpotentials rise with current density due to increasing mass fluxes, as shown in Fig. 4. As previously described, oxygen and hydrogen are transported mainly by advection, as diffusive transport is negligible at considered conditions. The increasing gas flow results in higher gas saturations and gas pressures on the PTLs' catalyst layer side (opposite to the flow field). This is also evident from saturation and pressure profiles along the through-plane coordinate x, Fig. 5. The pressurization of gas additionally leads to heightened oxygen and hydrogen concentrations in both liquid and gas phase, cf. Eqs. 4 and 6. All of these effects contribute to a gain in oxygen and hydrogen activities, a decrease in water activities and consequently to an increase in mass transport overpotentials. It has been observed for modeled overpotentials that the changes in saturations are more decisive than relative changes in concentrations, cf. Fig. 1 in supplementary data (is available online at stacks.iop.org/JES/167/114511/mmedia). Note that at considered current densities, gas pressure drops are two to three orders of magnitude higher than liquid pressure drops, as seen in Fig. 5. This is due to a higher resistance for gas flow, which results from low gas permeabilities krg at high liquid saturations, as shown in Fig. 2b. Gas pressure profiles are similar on the anode and the cathode side due to three facts: (1) molar concentrations and are the same at a given gas pressure (follows directly from the ideal gas law and identical equilibrium vapor pressures), (2) hydrogen's stoichiometric factor in water electrolysis is two times higher than oxygens's, (3) vapor saturated oxygen has a 1.93 times higher dynamic viscosity than vapor saturated hydrogen at gas pressures close to pambient.44 It follows from Eqs. 8, 10 and 14 that the second and third fact nearly balance each other out for gas flow.


Figure 5. Modeled spatial profiles of phase saturations and phase pressures along the through-plane coordinate x under the middle of flow field channels, the modeled material is T10 at ϑ = 50 °C and pop = pambient conditions: (a) anode-side gas saturations; (b) cathode-side gas saturations; (c) anode-side phase pressures; (d) cathode-side phase pressures.

Download figure:
Standard image High-resolution imageThe model and experimental results are in excellent qualitative and reasonable quantitative agreement, especially for current densities above 0.5 A cm−2. As a quick reminder, the model results shown in Fig. 4 are generated without any calibration of parameters. However, as expected, the agreement is not as good at lower current densities, A cm−2, as briefly explained below. While the model considers transport losses as soon as Faradaic reactions start, i.e. A cm−2, the electrochemical breakdown method by definition ignores any transport effects below approximately 0.1 A cm−2. An in-depth discussion of these different assumptions is presented later in this work.


Influence of the balanced operating pressure
So far we have mainly discussed the influence of the operating parameter i, which is the current density. From experimental findings we know that the mass transport overpotentials decrease with increasing operating pressure. From a theoretical, more fundamental perspective, fluid states change at high operating pressures mainly due to the increase in phase viscosities, dissolution and gas density, the first of which raises transport resistance while the latter two reduce gas saturations considerably. As gas saturations have a high influence on mass transport overpotentials, the model matches the experimentally observed falling trend in overpotentials with rising operating pressures, as shown in Fig. 6. Between model results and breakdown data, there is a difference considering the rate with which overpotentials decrease at rising pop (as can be seen for the 10 bar case), yet a quantitative agreement is observed again at 50 bar balanced operating pressure.

Figure 6. Model results compared to breakdown data for the T10 material at ϑop = 50 °C and three different balanced operating pressures pop.
Download figure:
Standard image High-resolution imageInfluence of the temperature
Another crucial operating parameter for the PEMWE is the temperature, as it influences all main overpotentials, as well as the fluid states and fluid properties. Model results at increasing operating temperatures are determined by gas expansion, increase in gas viscosity and outgassing of solutes. As a result of these effects, higher gas saturations and mass transport overpotentials are obtained at higher temperatures, as shown in Fig. 7. There is unfortunately no breakdown data available for comparison.

Figure 7. Isothermal model results for T10 material at different operating temperatures ϑop at ambient balanced operating pressure.
Download figure:
Standard image High-resolution imageNevertheless, it is known that temperature gradients are present in PEMWE cells and temperature variations of about 8 K have been measured by Suermann et al.13 at i = 4 A cm−2 and nominal operating temperature of 50 °C using the same PTL material T10 (with a thermal conductivity of about 9.6 W m−1 K−1, cf. Table I). The used model neglects temperature variations and assumes the nominal operating temperature everywhere in the solution domain. An incorporation of temperature gradients in the model would yield larger overpotentials compared to the isothermal results shown in Fig. 7. However, non-isothermal solutions for ϑop = 50 °C are expected to be still lower than the (brown) isothermal 60 °C curve shown in Fig. 7 and the model error due to the isothermal assumption is therefore less than 5 mV for current densities under 4 A cm−2.
Briefly summarized, the results in this section illustrate that a very good match between modeled overpotentials and experimental data can be reached at different current densities and balanced operating pressures. In the presented case, where material properties were either known or could be approximated based on measurements, no parameter fitting was needed. Regarding PTLs' influence on mass transport overpotentials, both model and experimental results suggest that the transport through PTLs contributes to a pressure-dependent share of the mass transport overpotentials, which converge towards negligible values at pressures over ca. 80 bar. Furthermore, cathode-side mass transport through PTL is found to cause more than twice as much overpotentials as the anode-side mass transport processes if the same PTL material is used on the anode and the cathode side. The model calculations predict that PTL-specific mass transport overpotentials rise with increasing temperature mainly due to gas expansion, although experimental validation is still missing.
Discussion
In the following, conclusions are drawn from the presented model and breakdown results and more context is provided for the results by relating them to further experimental evidence found in the literature.
Determining parameters of the flow and transport model
The PTL's fluid mechanical properties affect fluid flow and consequently advective transport of mass, which is found determinant for PTL-related mass transport overpotentials. Accordingly, the adopted model is sensitive to all material parameters considered in Darcy's law: (1) the intrinsic permeability K, (2) the relative permeabilities krl and krg and (3) the capillary pressure curve pc(Sl). These parameters can be obtained either by an experimental approach, e.g. capillary flow porosimetry and saturation measurements,33 or by conducting pore scale or pore network simulations.28 If the saturation-dependent parameters (2) and (3) are not or only partially available, parameter models can be used to approximate these parameters. This is carried out below for the PTL material T10, which serves here as a reference.
The modified Kovács model59 can be applied for predictions of the capillary pressure curve. This parameter model requires a known contact angle θ, which is not available for T10. However, the modified Kovács model yields a similar curve as the pore morphology calculation if θ = 70° is assumed according to literature data for similar materials,12,26,49 as shown in Fig. 8a. Correspondingly, model results for ηmt,PTL are obtained with the modified Kovács model that agree qualitatively with experimentally determined overpotentials, yet overestimate them by up to 12 mV, as seen in Fig. 9.

Figure 8. Saturation dependent parameters for the T10 material as predicted by modified Kovács and Mualem models, compared to pore morphology calculations (for T10 published by Lettenmeier et al.6) and measured data (corresponding to sintered powder PTL "sample 3" in Ref. 33), respectively.
Download figure:
Standard image High-resolution image
Figure 9. Modeled mass transport overpotentials for the T10 material at ϑ = 50 °C and pop = pambient conditions with different parameters: base parameter set according to the Model and Materials section (Pore Morphology calculation for pc(Sl), literature data for krg(Sl),33 Mualem-type krl(Sl)); the m. Kovács pc(Sl) curve is calculated according to Ref. 59 and the Mualem-type krg(Sl) curve is obtained according to Ref. 53.
Download figure:
Standard image High-resolution imageThe Mualem model53 from soil sciences has been previously introduced for predicting relative permeabilities. Regarding krl(Sl), the model results were found insensitive at considered current densities i ≤ 4 A cm−2. The predicted curve for krg(Sl), exhibits relatively small values at high liquid saturations Sl > 0.9, as shown in Fig. 8b. Hence, applying a Mualem-type gas permeability for the model yields large ηmt,PTL overpotentials at small current densities (Fig. 9), which overestimate breakdown data by ca. 20 mV. Using an alternative standard model for relative permeabilities, the Burdine model,54 results in even (up to 17 mV) larger overpotentials compared to the Mualem model (results not shown). These findings illustrate that model results are highly sensitive to the choice of relative gas permeability, especially at low gas saturations, at which standard parameter models possibly underestimate gas permeabilities.
Changing material properties
As mentioned in the introduction, the existence of an optimum pore size of the PTL has been reported in various experimental works regarding the reduction of total overpotentials. For a model-based optimization of the pore size, it is essential to understand how pore diameters affects the parameters to which the model is sensitive. As aforementioned, the adopted continuum model's results mainly depend on the parameters intrinsic permeability K, capillary pressure curve pc(Sl) and relative gas permeability krg(Sl) at investigated current densities i ≤ 4 A cm−2. In the following, the dependence of K and pc(Sl) on the mean pore size and how model results are affected by changes in these parameters are discussed. The discussion of the relative gas permeability krg(Sl) is omitted here, as standard models, which could describe the pore size's influence, were found to insufficiently approximate krg(Sl) at large liquid saturations (at Sl > 0.9, see previous section).
We consider variations of the mean pore size that correspond to the previously introduced T5 and T20 materials: a 20% reduction and a 50% increase, respectively ( and , cf. Table I). In a previous study,13 pore scale simulations yielded intrinsic permeabilites for T5 and T20 that follow a rising trend with increasing pore size, as also shown in Table I. This trend is reflected by the often-used Kozeny-Carman approximtaion,60


in which the mean hydraulic radius rh scales with the mean pore size d. Figure 10 shows T10's capillary pressure curve that is transferred to the varied pore sizes by applying the factor according to the Young-Laplace Eq. 11. It is evident from the above descriptions that reducing pore sizes corresponds with lowering the intrinsic permeability and increasing capillary pressures. While low intrinsic permeabilities lead to increased transport resistances, higher values for pc lead to lower mass transport overpotentials due to the gas pressurization, as discussed above in context of the operating pressure. Increasing pc values further facilitates gas flow, as slopes in the pc(Sl) curve usually also become steeper, cf. Fig. 10, yielding higher gas pressure gradients for a given saturation field. For the investigated cases, it is found that the influence of intrinsic permeability on the mass transports outweighs that of capillary pressure, as seen in Fig. 11. In general terms, however, the opposing effects of K(d) and pc(d) support the experimental observations that an optimum pore size d exists.


Figure 10. The capillary pressure curves for the T10 material as determined by pore morphology calculations6 and transferred curves that account for different mean pore sizes according to the Young-Laplace equation.
Download figure:
Standard image High-resolution image
Figure 11. Modeled PTL-related mass transport overpotentials for T10 and two varied mean pore sizes ( and = = , cf. Table I) compared to breakdown results for T5, T10 and T20; T10's parameter set is adopted for all model results except for the the pc(Sl) curves and intrinsic permeabilities, which are chosen according to Fig. 10 and Table I, respectively.


Download figure:
Standard image High-resolution imageA reduction of T10's mean pore size by 20% yields higher modeled ηmt,PTL values compared to T10's overpotentials, as shown in Fig. 11. This is in qualitative agreement with the corresponding breakdown results of T5 materials. Even though the model results for reduced pore size were obtained with T5's mean pore size and intrinsic permeability, a quantitative discrepancy of up to 30 mV can be observed regarding the experimental data (cf. blue curves in Fig. 11). The model results with T20's mean pore size and intrinsic permeability do not qualitatively reflect the experimental data, as T20's modeled overpotentials are smaller than those for T10 (due to the relatively high intrinsic permeability), whereas T20's experimental curve exhibits the largest of all overpotentials. The following three reasons can be given for the obvious discrepancy, especially for T20. First, assumed parameters might deviate from T5's and T20's actual ones, e.g. regarding the shape of saturation dependent parameter curves. The transfer of parameters between materials could also be complicated by the existence of discrete transport effects, such as limiting throats. It should be noted that all model results were obtained assuming the same contact angle for all materials (otherwise T10's capillary curve would have been transferred by the factor for T5 and T20, cf Eq. 11). Second, the adopted model assumes that reaction sites are uniformly distributed and very close to the PTLs' surface. As T20 consists of almost twice as large titanium particles as T5 and T10,13 it exhibits a comparably rough surface topology and its electrochemically active surface area deviates from the others.55 Transport processes close to T20's (catalyst layer-side) interface might contribute to the high mass transport overpotentials that were experimentally determined for T20. Third, the experimental data underlies inaccuracies that originate in assumptions made in the breakdown method. These assumptions are discussed separately in the next section.

Voltage breakdown and mass transport related overpotentials
Regarding modeled ηmt,PTL overpotentials for the T10 material, the cathode PTL's share is in the range of 68% to 71%, as seen in Fig. 4. This is qualitatively and quantitatively in good agreement with electrochemical measurements using differential pressure operation (pop,a < pop,c, instead of balanced pressure operation pop,a = pop,c) with up to 30 bar61 and up to 50 bar62 differential pressure. However, further measurements at even higher pressures and in combination with a third (reference) electrode could yield a more precise data set concerning anodic and cathodic shares.
Nevertheless, all shown simulations consistently overestimate breakdown data at current densities below ca. 0.5 A cm−2 due to a (fundamental) difference in model and breakdown assumptions. The applied breakdown method attributes all iR-free overpotentials (corrected by the ohmic overpotential) under ca. 0.1 A cm−2 to activation overpotentials and thus mass transport overpotentials are neglected by definition. This breakdown method considers the Butler-Volmer approach, transition state theory and concept of a rate determining step56 and ultimately results in the Tafel approach. Here, a Tafel-fit is made at small current densities in the linear region (typically 0.01 A cm−2 ≤ i ≤ 0.1 A cm−2) of a Tafel-plot (iR-free Ecell versus log(i)) and extrapolated towards higher current densities. For more details of this overpotential breakdown method, we refer to the Ref. 63. The breakdown method's assumption is contrasted by the results of the adopted mass transport model, which show that oxygen and hydrogen are transported predominantly in the gas phase with considerable transport resistance at i = 0.1 A cm−2. This model result is supported by operando gas saturation measurements in various anode PTLs (including T5) yielding 8% to 46% gas saturations at i = 0.1 A cm−2.39,40 Consequently, bubble nucleation already occurs at those relatively small current densities causing mass transport resistances. The current density at which bubble nucleation is initiated might be determined by further saturation measurements or by including nucleation into a transport model, cf.43 Furthermore, the "Tafel-region" can be interpreted more accurately by taking the concentration increases due to current density dependent gas crossover into account.57 Moreover, the breakdown results can be improved by approximating the mass transport overpotentials due to the (oversaturated) solute transport in catalyst layers, which strongly depend on their structural properties.57 All these so far neglected effects may explain (part of) the discrepancy between breakdown and model results. Further work will shed light on it.
Continuum scale modeling of flow and transport in the PTL
Representative volume elements were found for all investigated materials regarding their porosity13 and experimental investigations showed a Darcian, path-connected flow in similar PTLs.32,33 Therefore, if adequately parametrized, the adopted continuum porous media model is expected to describe well the fluid states in PTLs at changing thermodynamic and flow conditions. This is reinforced by the agreement between model results and experimental data for the T10 material at different current densities and operating pressures, cf. Figs. 4 and 6. Non-continuum effects (e.g. limiting throats, as discussed above) can affect the transferability of parameters between materials and might have thus contributed to the fact that no match between model results and experimental data was obtained for T5 and T20 so far, yet previously discussed parameter uncertainties and inaccuracies in the breakdown method are expected to play an at least equally important role.
Summary
A state-of-the-art model, which includes (1) a Nernst-type description of overpotentials, (2) a continuum porous media model for two-phase flow and (3) advective-diffusive transport of mass, is used to investigate PTL-related mass transport overpotentials. The model results are compared to experimentally determined, pressure-dependent mass transport overpotentials, as these were observed to be the only share in mass transport overpotentials to directly depend on the choice of PTL material.
When both anode and cathode PTL consist of the T10 material, for which most model parameters are known (only the relative gas permeability had to be transferred from measured data for another material), the experimental data and model results quantitatively agree well and only minor differences up to 10 mV are observed. The model also reflects the experimentally observed drop in mass transport overpotentials by up to 88% increasing the operating pressure from ambient pressure to 50 bar balanced pressure. At small current densities, however, model results overestimate the results of the breakdown method, which assumes negligible mass transport overpotentials below ca. i = 0.1 A cm−2, by up to 5 mV. It is therefore yet an open question at which current densities transport resistances begin to increase due to bubble nucleation and two-phase flow. According to the model, the cathode PTL's contribution to all PTL-related mass transport overpotentials is ca. 70%, which is in quantitative accordance with experimental results. These results reassert that mass transport inside (the bulk of) PTLs affect electrolysis efficiency to an extent that can be narrowed down to pressure dependent mass transport overpotentials.
Model results at considered current densities (≤4 A cm−2) were mainly sensitive to three material parameters: capillary pressure curve, intrinsic permeability and relative gas permeability. Prediction of the latter by standard models lead to an overprediction of experimental results (depending on the model, by ca. 20 mV or more). The influence of changing mean pore sizes was investigated regarding the intrinsic permeability, the capillary pressure curve and the modeled mass transport overpotentials. The model predictions qualitatively matched the experimental data for T5-type PTLs indicating that T5's low intrinsic permeability can be associated with comparably high mass transport overpotentails, yet no agreement was found for the T20 material. In conjunction with this discrepancy, open questions regarding the transferability of parameters and the validity of the breakdown method were discussed. Further modeling work would therefore greatly benefit from experimental studies on PTLs' capillary pressure curves (or contact angles) and relative permeabilities. Finally, further electrochemical measurements providing validation data at different conditions, e.g. operating temperature, and using more precise breakdown methods, e.g. by approximations of solute transport resistances in catalyst layers or via reference electrodes, would be helpful.
Acknowledgments
This work was supported by counselings of the DuMuX developers community and the computer cluster, which is funded by the Leibniz University of Hannover, Germany. The authors gratefully acknowledge the financial support by the Federal Ministry of Education and Research of Germany in the framework of PowerMEE (project number 03SF0536B). The authors would also like to express their sincere thanks to Sheridan Renzi for proofreading the manuscript and the anonymous reviewers for their valuable and constructive comments.
Appendix
A.1. Diffusive transport of solutes
Let assume for the operating the conditions: i = 1 mA cm−2, ϑop = 50 °C and pop = pambient. Moreover, the following holds for the T10 material: transport path lengths , porosity ϕ ≤ 0.37 and entry pressure .6,13 The diffusion coefficient can then be estimated as


see Eq. 15 and Ref. 44. The concentrations are calculated according to Henry's law 6. Their averaged (over Σa or Σc) gradients are
with Eq. 7, , , = , = and = .45,46 Finally, Eqs. 8, 10 and 13 give


