Abstract
We present an electrochemical aging model with solid electrolyte interphase (SEI) formation, SEI re-formation due to cracking of the layer during graphite expansion, lithium plating when the potential of the negative electrode becomes negative vs Li/Li+, and subsequent lithium stripping once the potential becomes positive again. The model considers the transition from an early stage, linear to a later stage, nonlinear capacity fade. While SEI re-/formation define linear aging, the onset and slope of nonlinear aging is simulated based on the ratio of reversibly and irreversibly plated lithium. With ongoing aging, more lithium is plated irreversibly so that less lithium is stripped. The simulation data agree very well with experimental data on commercial 18 650-type lithium-nickel-cobalt-manganese-oxide vs graphite (NCM/C) cells.
Export citation and abstract BibTeX RIS

This is an open access article distributed under the terms of the Creative Commons Attribution 4.0 License (CC BY, http://creativecommons.org/licenses/by/4.0/), which permits unrestricted reuse of the work in any medium, provided the original work is properly cited.
List of symbols
| A | Surface area, m2 |
| a | Specific surface area, m−1 |
| C | Capacity, Ah |
| c | Lithium-ion concentration, mol m−3 |
| cp | Specific heat capacity, J kg−1 K−1 |
| D | Diffusivity, m2 s−1 |
| Ea | Activation energy, J mol−1 |
| EEq | Equilibrium potential, V |
| F | Faraday's constant, 96 485 As mol−1 |
| f | Function/factor |
| f± | Mean molar activity coefficient |
| h | Heat transfer coefficient, W m−2 K−1 |
| hss | Height, m |
| I | Current, A |
| i | Current density, A m−2 |
| i0 | Exchange current density, A m−2 |
| k | Reaction rate, m s−1 |
| l | Length, m |
| M | Molar mass, kg mol−1 |
| m | Mass, kg |
| NM | MacMullin's number |

|
Heat transfer, W |
| q | Charge quantity, C m−2 |

|
Heat generation, W m−3 |
| Rss | Film resistance, Ωm2 |
| R | Universal gas constant, 8.314 J K−1 mol−1 |
| r | Radius, m |
| T | Temperature, K |
| t | Time, s |
| t+ | Transport number |
| V | Volume, m3 |
| x | Negative electrode stoichiometry |
| y | Positive electrode stoichiometry |
Greek
| α | Charge-transfer coefficient |
| δ | Thickness, m |
| ε | Volume fraction |
| εth | Emissivity |
| η | Overpotential, V |
| κ | Ionic conductivity, S m−1 |
| Φ | Potential, V |
| Ψ | Temperature-dependent variable |
| ρ | Density, kg m−3 |
| σ | Electronic conductivity, S m−1 |
| σB | Stefan-Boltzmann constant, 5.67 × 10⁻⁸ W m−2 K−4 |
| ξ | Ratio of reversibly plated lithium |
Subscripts
| 0 | Initial |
| a | Anodic |
| c | Cathodic |
| cell | Cell |
| ch | Charge |
| conv | Convection |
| cor | Correction |
| dch | Discharge |
| eff | Effective |
| exp | Expansion |
| e− | Electron/electronic |
| film | Film |

|
Ambient |
| Li | Lithium |
| Li+ | Lithium-ion/ionic |
| l | Liquid phase |
| lpl | Lithium plating |
| lst | Lithium stripping |
| max | Maximum |
| N | Nominal |
| n | Negative/positive electrode |
| neg | Negative electrode |
| ohm | Ohmic |
| p | Particle |
| pos | Positive electrode |
| rad | Radiation |
| reac | Reaction |
| ref | Reference |
| rev | Reversible |
| SEI | Solid electrolyte interphase |
| SEI,form | SEI formation |
| SEI,re-form | SEI re-formation |
| s | Solid phase |
| sep | Separator |
| ss | Subscript |
| th | Thermal |
Lithium-ion batteries are today's most important battery-energy-storage technology and are used both in mobile and stationary applications, such as consumer electronics, electric vehicles, and grid operations. The aging behavior of lithium-ion batteries mainly defines their economic and sustainable usage. In particular, the determination, estimation and prediction of the battery's state of health (SOH), remaining useful life (RUL) and end of life (EOL) are current challenges.
Aging of lithium-ion cells in general means the loss of capacity and the increase of impedance that results in a decrease in energy density and also power capability.1 The main aging mechanisms are: solid electrolyte interphase (SEI) formation due to electrolyte decomposition, SEI re-formation caused by cracking of the layer, lithium plating, a decrease in accessible surface area and porosity due to SEI growth, contact loss of active material particles due to volume changes during cycling, cathode electrolyte interphase (CEI) growth and transition-metal dissolution from the cathode, solvent co-intercalation, gas evolution with subsequent cracking of particles, binder decomposition, and current collector corrosion.1–4 These aging mechanisms can be assigned to a loss of lithium inventory (LLI), a loss of active material and an impedance increase.1
SEI re-/formation is the main aging mechanism for common operational conditions and the majority of lithium-ion cell compositions. It results in a decelerated or linear capacity fade on charge throughput, or a square-root-shaped capacity loss over time and defines the early stage of aging. The later stage of aging is characterized by an accelerated or nonlinear capacity fade that is caused by lithium plating on the graphite anode if the local anode potential becomes negative vs Li/Li+.5,6 A high polarization caused by high charging currents in conjunction with low temperatures and a high state of charge (SOC) favor lithium plating.7–9 However, even at moderate temperatures and charging rates, and due to temperature gradients and mechanical stress inside the cell, inhomogeneous current and potential distributions may cause lithium plating.10–13 On the one hand, plated lithium can irreversibly react with the electrolyte, forming additional SEI. On the other hand, lithium plating is partly reversible as long as the metallic lithium exhibits an electrical contact to the active material of the negative electrode.14 The literature distinguishes between two different reversible processes that are lithium stripping during a subsequent discharge and chemical intercalation during relaxation.6
Electrochemical models—based on physical-chemical equations—are adapted to investigate and describe the behavior of lithium-ion cells, especially their underlying aging mechanisms. The best-known electrochemical model is the pseudo two-dimensional (P2D) model developed by Newman, Doyle and Fuller.15–18 The model considers kinetics and reaction rates as well as transport equations of charge and mass and is based on the theory of porous electrode and on the theory of concentrated solution.18 On the one hand, the model is computationally intensive, but on the other hand, it represents the most accurate model of lithium-ion cells.
Lithium plating models are described in the previous literature, but only a few model lithium stripping as the backward reaction of lithium plating and fewer investigate cycling and the effect on aging. Arora et al.2 first described a lithium plating side reaction by a Butler–Volmer equation on the negative electrode that occurs during overcharge. Tang et al.19 investigated the effect of lithium plating at electrode edges caused by local overpotentials and showed that anode overhang area successfully prevents lithium deposition. Hein, Latz and co-workers20,21 introduced an electrochemical model considering both lithium plating and lithium stripping. Their model shows a characteristic voltage plateau during discharge due to the dissolution of reversibly plated lithium. Furthermore, their 3D microstructure modeling approach reveals the most probable position for lithium plating.5 Tippmann et al.7 built up an electrochemical model considering lithium plating for low-temperature charging. Their experimental results on degradation qualitatively correlate with the modeled anode potential. Legrand et al.22 investigated lithium plating through charge transfer limitations that occur at short-time scales. However, diffusion limitations in the solid insertion compound occur at long-time scales and have not been examined. A lithium plating model at subzero temperatures was introduced by Ge et al.23 and validated by nuclear magnetic resonance (NMR) measurements. Yang et al.24 presented an aging model considering SEI growth and lithium plating based on cathodic Tafel equations. While the anode porosity decreases during cycling, lithium plating exponentially increases and causes accelerated capacity loss and resistance rise. In a further work, Yang and co-workers25 extended their model considering lithium stripping to model the characteristic voltage plateau during relaxation or discharge after severe lithium deposition. Differential voltage analysis assesses the amount of deposited lithium. This model is focused on one charging/discharging cycle and does not consider long-term cycling or aging. Ren et al.26 also modeled the characteristic voltage plateau due to lithium plating and lithium stripping side reactions at low temperatures. Differential voltage analysis is used as quantitative, non-destructive lithium plating detection. Finally, Xu et al.27 modeled the effect of dead lithium on the cell's capacity and voltage.
In this paper, we present an electrochemical long-term cycling aging model at ambient temperature with SEI formation,28 SEI re-formation,29 lithium plating and lithium stripping30 side reactions on the negative electrode described by adjusted Butler-Volmer equations. With this novel approach, we control the ratio of reversibly and irreversibly plated lithium. Accordingly, the model considers the transition from an early stage, linear to a later stage, nonlinear capacity fade, and determines the onset and slope of nonlinear aging. We compare the simulation results to experimental data on commercial 18 650-type NCM/C cells.
Model Development
Based on the pseudo two-dimensional (P2D) electrochemical model by Newman, Doyle and Fuller,15–18 we developed an aging model considering SEI formation, SEI re-formation as well as lithium plating and lithium stripping side reactions within the negative electrode. The model for a common NCM/graphite cell is set up using COMSOL Multiphysics® 5.4. All governing equations of the P2D model and the theories of porous electrodes and concentrated solutions have been considerably shown in literature,15–18 so that we focus on the model extension with regard to the side reactions.
Figure 1 shows the electrochemical main and side reactions at the graphite particle surface. We distinguish between the transport of two species through the negative electrode surface film—lithium-ions, on the one hand, and electrons on the other hand. This corresponds to the assumption that the film exhibits a maximum conductivity for lithium-ions κfilm and an insulation conductivity for electrons σfilm.29,31,32 While the lithium de-/intercalation reaction is unimpeded by a high conductivity of lithium-ions through the film (1), SEI formation results from their non-ideal insulating properties for electrons (2). Additional SEI re-formation is caused by cracking of the layer during graphite expansion and is unaffected by any transport limitations through the film (3). Lithium plating takes place once the overpotential becomes negative vs Li/Li+ (4). As soon as lithium has been plated and the overpotential becomes positive vs Li/Li+, the lithium stripping reaction proceeds by partly dissolving the plated lithium (5).6 Considering the different ionic and electronic conductivities, our approach results in different potential drops for the overpotentials of the main and SEI formation reaction. By taking this approach, we are able to differentiate between the aging phenomena of capacity and power fade.29 The resistances  and
and  are given by the thickness of the film δfilm and the ionic and electronic conductivity κfilm and σfilm, respectively


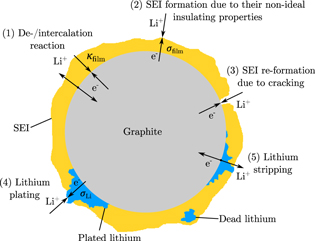
Figure 1. Illustration of the electrochemical reactions at the graphite particle surface.
Download figure:
Standard image High-resolution imageThe SEI re-formation considers no potential drop as no film limits the transport. Compared to the ionic and electronic conductivities of the film, the conductivity of metallic lithium σLi is better by several orders of magnitude. Therefore, these very low potential drops for the overpotentials of the plating and stripping side reactions are neglected in the model.
In summary, we consider the loss of lithium inventory and the increase in impedance based on this modeling approach and the implementations of side reactions, which are shown in the following subsections.
De-/intercalaction reaction
The current density i of the lithium de-/intercalation reaction is calculated by the Butler-Volmer equation
where the index n symbolizes the negative or positive electrode, i0 is the exchange current density, αa and αc are the anodic and cathodic charge-transfer coefficients, F, R and T represent Faraday's constant, the universal gas constant and the cell temperature, respectively. The overpotential ηneg of the main reaction at the negative electrode is obtained by the solid phase potential Φs, the liquid phase potential Φl, the negative electrode equilibrium potential EEq,neg and the potential drop  29
29

The potential drop by a cathode electrolyte interphase (CEI) at the positive electrode is left out of consideration in this work. Therefore, the overpotential ηpos is defined as

with the positive electrode equilibrium potential EEq,pos. Table I shows the chosen parameters—measured, taken from the literature and estimated—for the above introduced model at 25 °C.
Table I. Electrochemical model parameters measured from a Sanyo UR18650E cell labeled with superscript m. The superscript e indicates estimated values.
| Parameter | Negative electrode | Separator | Positive electrode |
|---|---|---|---|
| Geometry | |||
| Thickness l | 70 μm m | 20 μm m | 60 μm m |
| Mean particle radius rp | 10 μm m | 4 μm m | |
| Solid phase fraction εs | 0.59 e | 0.61 e | |
| Liquid phase fraction εl | 0.3 e | 0.45 e | 0.3 e |
| Thermodynamics | |||
| Equilibrium voltage EEq | see Fig. A·1 m | see Fig. A·1 m | |
| Maximum Li+ concentration cs,max | 31 370 mol m−3 33 | 51 385 mol m−3 7 | |
Initial state of charge 
|
0.8 e | 0.4 e | |
| Kinetics | |||
| Reaction rate constant kn | 1.5 × 10⁻¹¹ m s−1 e | 1.5 × 10⁻¹¹ m s−1 e | |
Activation energy 
|
1 × 10⁴ J mol−1 e | 1 × 10⁴ J mol−1 e | |
| Anodic charge-transfer coefficientαa | 0.5 e | 0.5 e | |
| Cathodic charge-transfer coefficient αc | 0.5 e | 0.5 e | |
| Transport | |||
| Solid diffusivity Ds | 9 × 10⁻¹¹ m2 s−1 e | 2.6 × 10⁻¹³ m2 s−1 e | |
Activation energy 
|
5 × 10⁴ J mol−1 34 | 2.5 × 10⁴ J mol−1 34 | |
| Solid conductivity σ | 100 S m−1 e | 3.8 S m−1 e | |
| Parameter | Electrolyte | ||
| Electrolyte concentration cl | 1000 mol m−3 e | ||
| Electrolyte diffusivity Dl | see Eq. 23 35 | ||
| Electrolyte conductivity κ | see Eq. 24 35 | ||
Activity dependency 
|
see Eq. 25 35 | ||
| Transport number t+ | 0.3835 | ||
| Parameter | Cell | ||
| Nominal capacity CN | 2.05 Ah m | ||
| Radius rcell | 9 mm m | ||
| Height hcell | 65 mm m | ||
| Mass mcell | 45 g m | ||
| Cell surface area Acell | 4.1846 × 10⁻³ m2 | ||
| Cell volume Vcell | 1.654 × 10⁻⁵ m3 | ||
Modeling SEI formation and SEI re-formation
We distinguish between SEI formation due to its non-ideal insulating properties and SEI re-formation due to cracking of the layer. Both are modeled as irreversible side reactions by cathodic Tafel equations. The current density for SEI formation is calculated by

with the SEI's exchange current density i0,SEI and cathodic charge-transfer coefficient αc,SEI. The overpotential ηSEI,form is calculated by

where  symbolizes the potential drop due to the insulating conductivity of the SEI for electrons. Due to its non-ideal insulating properties, the solid electrolyte interphase grows continuously. However, this formation slows down over time or with cycles due to the increasing potential drop caused by the growth of the film.
SEI re-formation considers an expansion factor fexp dependent on the stoichiometry x as depicted in Fig. 2. This expansion factor is the gradient of a graphite expansion curve as previously introduced and as already implemented in an electrochemical SEI model by Kindermann et al.29
The overpotential ηSEI,re−form considers no iR drop

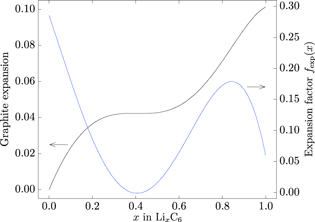
Figure 2. Graphite expansion and expansion factor fexp(x) as a function of stoichiometry x.
Download figure:
Standard image High-resolution imageModeling lithium plating and lithium stripping
The current density of the lithium plating side reaction is calculated by a Butler-Volmer equation, as reported by Arora et al.36
with the lithium plating exchange current density i0,lpl and the anodic and cathodic charge-transfer coefficients αa,lpl and αc,lpl. This equation is valid as long as the overpotential ηlpl is less than or equal to 0 V. Once the overpotential becomes positive again and as long as reversibly plated lithium exists, lithium stripping takes place
where f is a damping function (as shown in Fig. 3), qlpl and qlst describe the charge quantity of plated and stripped lithium, ξ is the ratio of reversibly plated lithium and qcor denotes a correction variable to ensure valid units. The damping function enables the lithium stripping reaction to be stopped as soon as all reversibly plated lithium has been dissolved. In contrast to a step function, the damping function is based on a Sigmoid function to ensure a stable numeric solver. Irreversibly plated lithium has lost its electrical contact to the negative electrode and is also called dead lithium, as shown in Fig. 1. The overpotentials are defined as
with the equilibrium potentials EEq,lpl = EEq,lst = 0 V. Here, the potential drop iR is left out of consideration due to the aforementioned high conductivity of metallic lithium.

Figure 3. Damping function—which is based on a Sigmoid function—for the adjusted Butler-Volmer equation of the lithium stripping side reaction dependent on the ratio of reversibly plated lithium ξ, the charge quantities of plated and stripped lithium qlpl and qlst, and the correction variable qcor.
Download figure:
Standard image High-resolution imageFilm growth
We consider a surface film on the graphite particles that is composed of SEI and metallic lithium
with their molar masses MSEI and MLi and densities ρSEI and ρLi. δ0,film symbolizes the initial film thickness. The charge quantities q are calculated by integrating the side reaction current densities. Cathodic current densities (iSEI,form, iSEI,re−form and ilpl) have a minus-sign and anodic current densities (ilst) a plus-sign. Therefore, SEI formation, SEI re-formation and lithium plating cause the film to grow, whereas lithium stripping partly dissolves it.
Effective transport
Furthermore, we consider effective transport parameters for the electrolyte diffusion coefficient Dl, the ionic conductivity κ and the electronic conductivity σ


where MacMullin's number NM describes the influence of porosity and tortuosity changes in the negative and positive electrode. In the literature, MacMullin's number is mostly given as a function depending on the porosity. However, especially for small porosities caused by film growth and pore clogging, adequate experimental data is missing. Based on simulation results by Xu et al.,27 we assume an almost linearly increasing function depending on the cycles. Figure 4 shows both the considered MacMullin's number and its reciprocal.

Figure 4. MacMullin's number and its reciprocal as a function of cycles.
Download figure:
Standard image High-resolution imageFinally, Table II shows all parameters for the SEI re-/formation and lithium plating/stripping side reaction definitions.
Table II. Electrochemical model parameters for the side reaction definitions. The superscript e indicates estimated values.
| Parameter | Value |
|---|---|
| SEI re-/formation equilibrium potential EEq,SEI | 0.4 V 37 |
| SEI re-/formation exchange current density i0,SEI | 1 × 10⁻⁶ A m−2 e |
| SEI re-/formation cathodic charge-transfer coefficient αc,SEI | 0.5 e |
| SEI density ρSEI | 1690 kg m−338 |
| SEI molar mass MSEI | 0.162 kg mol−1 38 |
| Li+ conductivity κfilm | see Eq. 2435 |
| e− conductivity σfilm | 1 × 10⁻⁸ S m−1 29 |
| Initial film thickness δ0,film | 5 nm e |
| Lithium plating/stripping equilibrium potential EEq,lpl/EEq,lst | 0 V 30 |
| Lithium plating/stripping exchange current density i0,lpl/i0,lst | 1 A m−2 e |
| Lithium plating/stripping anodic charge-transfer coefficient αa,lpl/αa,lst | 0.5 e |
| Lithium plating/stripping cathodic charge-transfer coefficient αc,lpl/αc,lst | 0.5 e |
| Lithium density ρLi | 534 kg m−3 |
| Lithium molar mass MLi | 6.94 × 10⁻³ kg mol−1 |
| Correction variable qcor | 1 C m−2 e |
| Ratio of reversibly plated lithium ξ | f(cycles), see Fig. 7 |
Thermal model
The electrochemical model is coupled with a 0D thermal model that simulates an evenly distributed heat in the cell. The total heat generation  is comprised of ohmic heat
  , reaction heat
  and reversible heat
with the electrolyte current density il and electrode current density is. Index i symbolizes the partial reactions at the negative and positive electrode. The entropy for both electrodes is given in the Appendix (see Fig. A·2). The heat transfer is considered by convection
with the heat transfer coefficient h, the cell's surface Acell and temperature T as well as the ambient temperature T∞. The radiation is calculated by

in which εth describes the emissivity and σB the Stefan–Boltzmann constant. In addition, the cell's thermal mass is considered by

with its mass mcell and specific heat capacity cp. Hence, the governing equation is given by
with the thickness of a cell layer l = lneg + lsep + lpos. All cell design information is listed in Tables I, and Table III shows the parameters of the thermal model.

Temperature-dependent variables
The temperature dependency of the anodic and cathodic reaction rate constants ka and kc and the diffusion coefficients in the negative and positive active material Ds,neg and Ds,pos are described by the Arrhenius equation
with  as the activation energy. Ψ marks the dependent variable and Ψref its reference value at the reference temperature Tref.
The temperature dependency of the diffusion coefficient in the electrolyte Dl, the liquid phase conductivity κ and the thermodynamic factor  are given by Valøen et al.35 in Eqs. 23, 24 and 25.
Experimental
We tested commercial Sanyo UR18650E lithium-ion cells to validate our modeling approach and simulation results. The cells with a nominal capacity of 2.05 Ah and an energy density of 175 Wh kg−1 are composed of graphite as negative electrode and NCM111 as positive electrode. We used a battery test system CTS (BaSyTec) to cycle the cells, and an environmental chamber MK 53 (Binder) to control their ambient temperature.
At the beginning, we ran rate capability tests with new cells under different discharge currents (C/10, C/5, C/2, 1C and 2C) at 25 °C and 0 °C for model validation. Two more new cells were opened in an argon filled glove box, half cells with LixC6/Li and  were assembled and equilibrium potentials vs Li/Li+ were measured (see Fig. A·1). Additionally, we measured the cells' cross section area, the thickness of the electrodes and separator and the mean particle radii (see Table I).
For the aging experiment, we kept the ambient temperature at 25 °C. Three cells were cycled as follows: constant current discharge (CCdch) with −2 A to the cut-off voltage of 2.75 V, followed by constant current charge (CCch) with 2 A to the cut-off voltage of 4.2 V and constant voltage charge (CVch) with the cut-off current of 0.1 A. Resting times of 10 s were applied after each discharge and charge. At the beginning of the aging experiment and after every 100 cycles, checkup cycles were performed to determine the cells' capacity.
Results and Discussion
Model validation
The simulated cell voltages and temperatures of the electrochemical and thermal model are shown in Fig. 5 and compared to the experimental data for discharge with C/10, C/5, C/2, 1C and 2C at ambient temperatures of 25 °C and 0 °C. We calculated mean absolute errors (MAE) and root mean square errors (RMSE) to assess the deviation between model and experiment. At 25 °C, the maximum MAEs are 14 mV (2 C) and 0.2 °C (2 C) and the maximum RMSEs are 21 mV (2 C) and 0.25 °C (2 C). At 0 °C, the maximum MAEs are 19 mV (2 C) and 0.3 °C (2 C) and the maximum RMSEs are 23 mV (2 C) and 0.4 °C (2 C). Therefore, the simulation results are in very good agreement with the experimental data for all C-rates as well as for both temperatures.
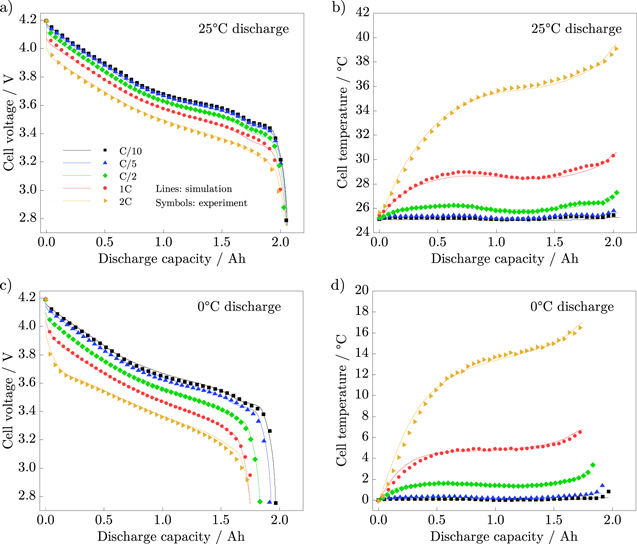
Figure 5. Comparison of simulation results (lines) and experimental data (symbols) for different discharge rates. Cell voltage (a) and cell temperature (b) at an ambient temperature of 25 °C, and cell voltage (c) and cell temperature (d) at an ambient temperature of 0 °C.
Download figure:
Standard image High-resolution imageReversible and irreversible lithium plating
Figure 6 shows the measured cell's relative capacity determined in the checkup cycles of the aging experiment (symbols). In the early stage that is arising from the beginning of cycling to about cycle 500, an almost linear or square-root-shaped, decelerating capacity loss is seen. Thereafter, an accelerating, nonlinear capacity loss denotes the later stage with a relative capacity of 65% after 800 cycles. Usually, an end of life is defined by falling below a relative capacity of 80% that is reached for this cell after 600 cycles, already within the stage of accelerated capacity loss. In a former study,13 we showed that the loss of lithium inventory is the dominant aging mechanism within the scope of this aging experiment. Electrochemical characterization and post-mortem analysis revealed solid electrolyte interphase growth and lithium plating induced capacity loss.
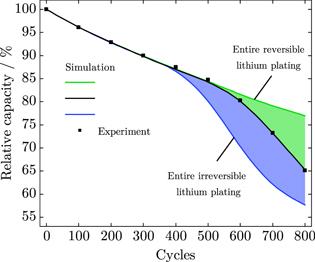
Figure 6. Comparison of experimental data (symbols) and simulation results (lines) with varying lithium plating reversibility. ξ = 1 denotes entire reversible and ξ = 0 entire irreversible lithium plating.
Download figure:
Standard image High-resolution imageBased on our electrochemical modeling approach and by setting the ratio of reversibly plated lithium ξ to one, we are able to simulate sole SEI formation and re-formation. Lithium plating may still take place but is plated completely reversibly and will be stripped subsequently. The simulation result is shown by the green line in Fig. 6 that is an almost linear or square-root-shaped capacity loss during cycling. The slope of the curve is fitted by the SEI re-/formation exchange current density i0,SEI.
In contrast, the entire irreversible lithium plating is modeled by setting the ratio of reversibly plated lithium ξ to zero. No lithium stripping side reaction takes place anymore. The blue line in Fig. 6 shows the simulation result that exhibits an early stage, linear capacity loss and an accelerating capacity loss, starting at about cycle 400. Compared to the measurements, the simulation results in an earlier and more intense capacity loss.
Finally, the black line in Fig. 6 shows the simulated relative capacity considering a changing ratio of reversibly plated lithium ξ over cycles. With this approach, we assume that the amount of reversibly plated lithium decreases with ongoing cycling. In other words, the more lithium is plated, the more lithium is irreversibly plated. With an MAE of 0.17% and an RMSE of 0.25%, the simulation results are in very good agreement with the experimental data. Based on our modeling approach, we are able to simulate both linear and nonlinear aging as well as to define the onset and slope of nonlinear aging. Differentiating between reversible and irreversible lithium plating and their impact on capacity loss is also consistent to operando lithium plating quantifications using incremental capacity analysis shown by Ansean et al.42
The fitted ratio of reversibly plated lithium ξ over cycles is shown in Fig. 7. Up to cycle 306, no lithium plating and thus no lithium stripping side reactions take place, as the potential of the negative electrode is always positive vs Li/Li+. As soon as this potential becomes negative and lithium is plated, we assume ξ to be 0.99 since Howlett et al.43 showed a cycling efficiency of greater than 99% for lithium metal electrodes. To obtain a linear aging behavior, the cycling efficiency remains constant for about one hundred cycles. However, the efficiency declines with ongoing cycling due to degradation mechanisms, inhomogeneous current and potential distributions, and deposit morphology changes.12,13,43,44 The change in the ratio of reversibly plated lithium concurs with the onset and slope of nonlinear aging in Fig. 6. In the end, the ratio is of less than 80% which means that one fifth is irreversibly plated.
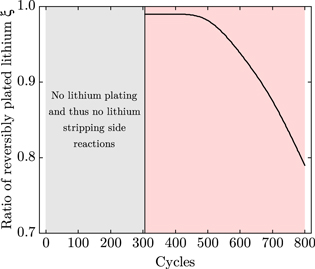
Figure 7. Changing ratio of reversibly plated lithium ξ over cycles.
Download figure:
Standard image High-resolution imageCell voltage and capacity loss
Figure 8 shows the simulated cell voltages (lines) compared to experimental data (symbols) over discharge capacity obtained from checkup cycles. With minimum errors of 8 mV (MAE) and 12 mV (RMSE) for cycle 200 and maximum errors of 27 mV (MAE) and 44 mV (RMSE) for cycle 700, the results are in very good agreement. Furthermore, the simulation results show that the model considers capacity as well as power fade.
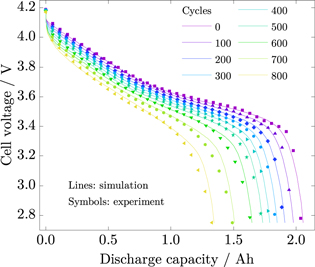
Figure 8. Comparison of simulation results (lines) and experimental data (symbols) of cell voltage over discharge capacity obtained from checkup cycles.
Download figure:
Standard image High-resolution imageThe capacity loss over cycles is depicted in Fig. 9. SEI formation shows a decelerated, square-root-shaped behavior over cycles, as the potential drop increases due to the growth of the film. However, SEI re-formation considers no influencing film and potential drop, and thus results in an almost linear capacity loss. Only by cause of capacity loss and shortened charge/discharge cycles, SEI re-formation decelerates. In contrast, irreversible lithium plating is unobtrusive over many cycles, but subsequently causes the nonlinear capacity fade between 500 and 800 cycles. After 800 cycles, about two thirds of the capacity loss are caused by SEI re-/formation and one third by irreversible lithium plating.
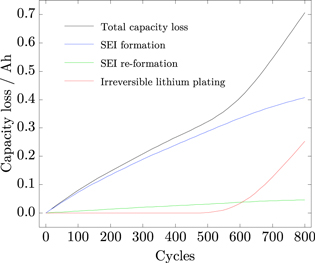
Figure 9. Entire capacity loss caused by SEI formation, SEI re-formation and irreversible lithium plating shown over cycles.
Download figure:
Standard image High-resolution imageCharacteristics of side reactions over cycling
The following subsection shows the characteristics of SEI re-/formation and lithium plating/stripping over cycling based on simulation results. Figure 10 depicts the cyclic cell voltage (a) and main reaction current density (b). With ongoing aging, the total cycle time decreases as the cell's capacity fades. Moreover, the resistance rise causes higher polarization that shortens the CC phase and extends the CV phase during charging. Both capacity and power loss—which in turn cause the energy loss of the cell—are clearly recognizable based on the cell voltage.

Figure 10. Simulation results of a discharge-charge cycle: cell voltage (a), current density of the main reaction (b), SEI formation/re-formation (c) and lithium plating/stripping (d) over time.
Download figure:
Standard image High-resolution imageFigure 10c depicts the side reaction current density of SEI formation (solid lines) and re-formation (dotted lines). For both, the current density declines while discharging and rises again while charging the cell. The maximum of current density corresponds to the transition from CC to CV charging, as the driving overpotentials are at a maximum. With ongoing aging, less SEI formation occurs because the total cycle time is getting shorter, but mainly because of the increasing potential drop caused by the growth of the film. In contrast, no iR drop is considered for SEI re-formation. As expected, SEI re-/formation is characterized by a decelerating behavior over cycling. In addition, the results show a higher SEI re-/formation for higher cell voltages, which means for higher SOCs.
The lithium plating and lithium stripping side reaction densities are shown in Fig. 10d. As soon as the local potential of the graphite anode becomes negative vs Li/Li+, lithium plating takes place, which reveals its maximum at the transition from the CC to the CV charging phase as well. Due to the decreasing main reaction current density in the CV charging phase, the cell's polarization also decreases. Once the driving overpotential becomes positive vs Li/Li+, subsequent lithium stripping dissolves the reversibly plated lithium. The lithium stripping side reaction density forms a maximum and diminishes towards the end of charging. In the subsequent discharging phase, the remaining amount of reversibly plated lithium is dissolved which causes a characteristic voltage plateau if the amount is big enough.30 Furthermore, lithium plating firstly appears after a few hundred cycles and increases and then declines again with ongoing cycling. Finally, this is caused by the capacity loss, the increasing polarization, the shortened CC and extended CV phases—and therefore the reduced time when lithium plating can occur—and the transition from a stage I to a stage II potential plateau in the negative electrode caused by LLI (see Fig. 12).
Integrating the side reaction current densities results in surface charge quantities, which are shown in Fig. 11 over the thickness of the negative electrode. SEI formation and re-formation (solid and dotted lines in Fig. 11a, respectively) take place in the entire electrode. However, the SEI grows faster at the negative electrode/separator interface. In contrast, irreversible lithium plating occurs on the outer edge of the negative electrode at its interface to the separator,5,24 as shown in Fig. 11b. At the interface of the negative electrode and its current collector, the overpotential vs Li/Li+ is always positive and no lithium is deposited. Finally, much more lithium is spatially deposited compared to SEI re-/formation, that is based on the difference in the magnitude of the side reaction current densities, as depicted in Figs. 10c and 10d.
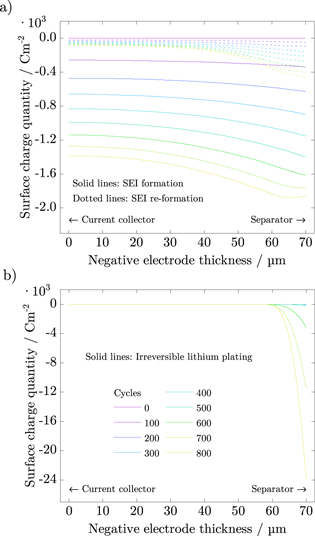
Figure 11. Surface charge quantities of SEI formation and re-formation (a) and irreversible lithium plating (b) over the thickness of the negative electrode.
Download figure:
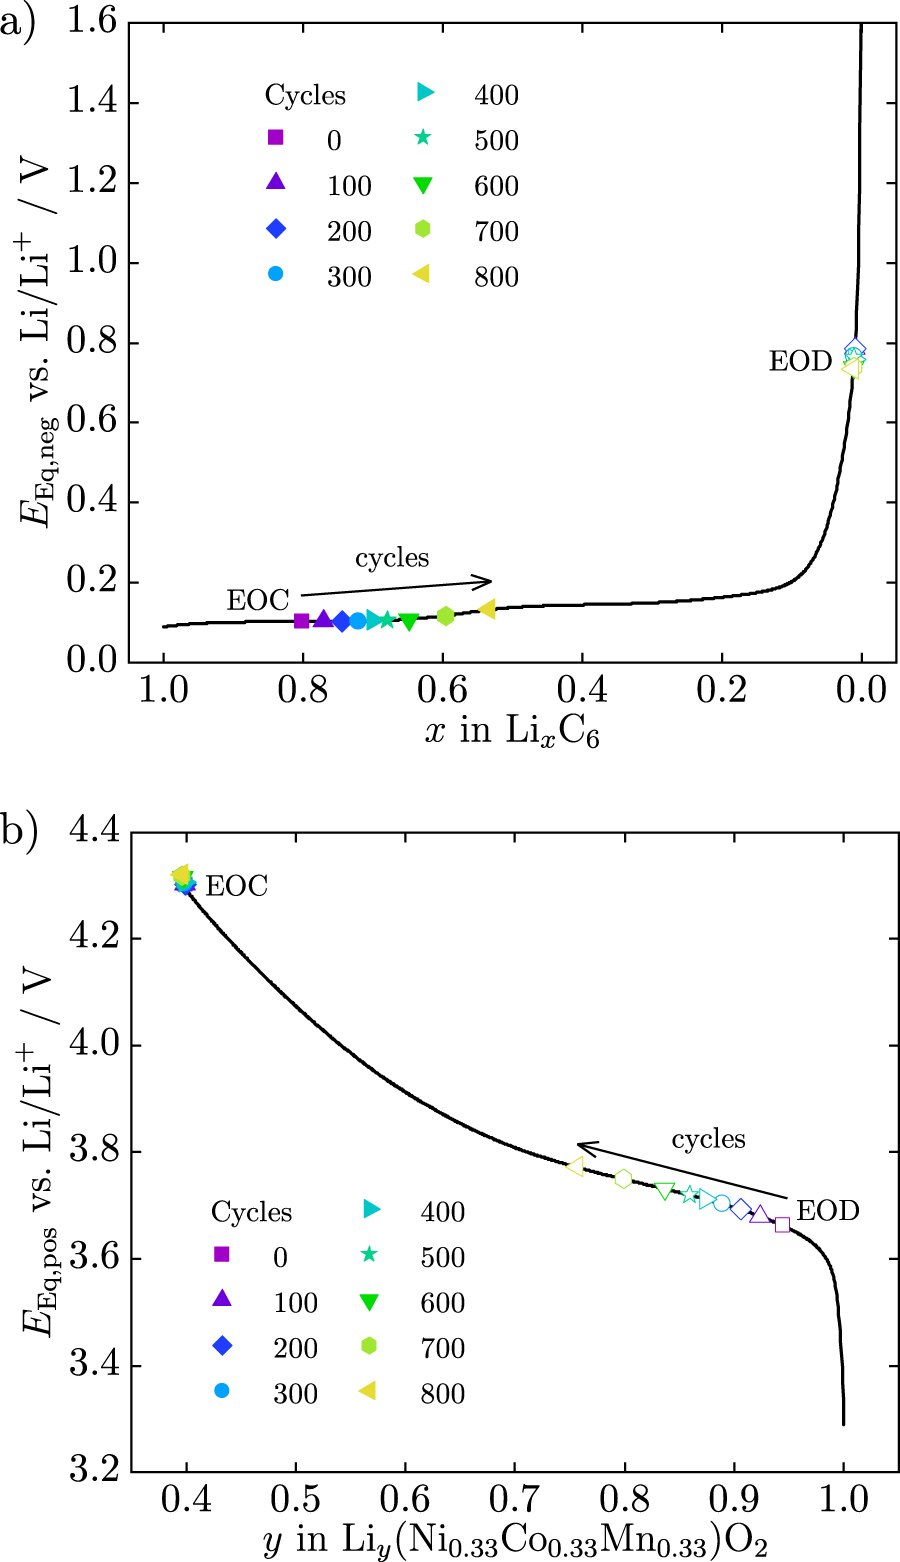
Standard image High-resolution imageFigure 12 shows the shifts in stoichiometry—which is the intercalation degree—over cycles of the negative and positive electrode at end-of-charge (EOC) and end-of-discharge (EOD) as a consequence of capacity fade. As expected, the stoichiometry of the negative electrode at EOC decreases with ongoing aging due to LLI. The declining change in stoichiometry up to cycle 500, which increases subsequently, reveals the linear and nonlinear aging behavior. While the LLI effects a transition from a stage I to a stage II potential plateau in the negative electrode, the potential of the positive electrode slightly increases at EOC, which is defined by the cutoff-voltage of the cell at 4.2 V, which is the difference between the negative and positive electrode potential. As a result of the transition of the potential plateaus, the lithium plating side reaction diminishes with ongoing aging.
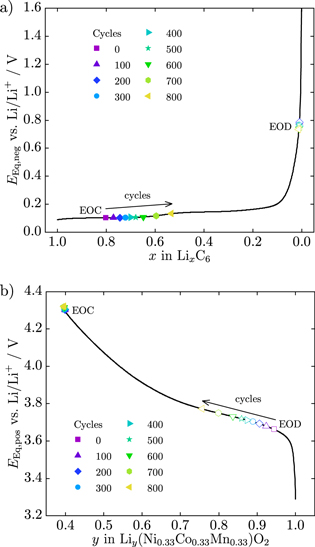
Figure 12. Stoichiometry x of the negative electrode (a) and y of the positive electrode (b) at end-of-charge (EOC) and end-of-discharge (EOD) showing their shifts over cycles.
Download figure:
Standard image High-resolution imageAt the EOD, the stoichiometry of the positive electrode decreases with ongoing aging based on the LLI as the dominant aging mechanism. Again, the change in stoichiometry results from the decelerating capacity loss due to SEI re-/formation and the subsequent accelerated capacity loss caused by irreversible lithium plating. Furthermore, the stoichiometry is a relative but not absolute variable and thus the shifts are not equidistant for the negative and positive electrode.
Conclusions
In this paper, we introduced a pseudo two-dimensional electrochemical aging model that describes the transition from a linear to a nonlinear aging behavior. Besides the main aging mechanisms of SEI formation and re-formation, we presented a novel approach for modeling reversible and irreversible lithium plating and lithium stripping. The model agrees very well with experimental aging data on commercial 18 650-type NCM/C cells and accurately reveals the onset and slope of nonlinear aging. Furthermore, the simulation results are in very good agreement with experimental data for discharge at different C-rates and at ambient temperatures of 25 °C and 0 °C. Future work will incorporate the model into a multi-dimensional modeling approach to investigate inhomogeneous aging and to get a more thorough understanding of the impact of different charging strategies, tab and electrode designs, and temperature conditioning on spatial cell degradation.
Appendix
Measured equilibrium potential curves dependent on the degree of lithiation x and y for the negative and positive active material are shown in Fig. A·1. The entropic coefficient of the reversible heat is derived from the literature40,41 and shown in Fig. A·2.

Figure A·1. Equilibrium potential for the negative and positive electrode.
Download figure:
Standard image High-resolution image
Download figure:
Standard image High-resolution image
We consider transport parameters of the electrolyte as functions of temperature T, lithium-ion concentration in the liquid phase cl and transport number t+ as measured by Valøen et al.35 The analytical dependencies for electrolyte diffusivity Dl, conductivity κ and activity  are described by