
Abstract
We report the excellent cycling stability of graphite in combination with two types of sulfide solid electrolytes, 0.75Li2S-0.25P2S5 (LPS) and 0.3LiI-0.7(0.75Li2S-0.25P2S5), and discuss the stability of the graphite-solid electrolyte interface by analyzing the normalized cumulative irreversible charge and the total amount of lithium consumed at the lithiated state. The rate limitations and the influence of the morphology and the size of graphite particles on the utilization of the electrode are studied as well. At higher current densities, the utilization of the graphite is decreasing as a consequence of the poor effective ionic conductivity of the composite electrode, which is also evidenced by the increasing polarization and ohmic resistance across the electrode.
Export citation and abstract BibTeX RIS

This is an open access article distributed under the terms of the Creative Commons Attribution Non-Commercial No Derivatives 4.0 License (CC BY-NC-ND, http://creativecommons.org/licenses/by-nc-nd/4.0/), which permits non-commercial reuse, distribution, and reproduction in any medium, provided the original work is not changed in any way and is properly cited. For permission for commercial reuse, please email: permissions@ioppublishing.org.
All-solid-state batteries are considered as prospective next generation of the lithium-ion battery chemistry, as the solid electrolytes are not flammable.1 These batteries could offer the great opportunity of enhanced safety but also of a longer lifetime and higher system energy density than the conventional liquid electrolyte based Li-ion battery systems.2 Sulfide based solid electrolytes are among the most attractive solid electrolytes as they offer the highest ionic conductivities at room temperature and have low grain boundary resistance.2–5 Besides, the sulfide solid electrolytes can be cold pressed; thus, they can be more easily processed than their oxide or phosphate counterparts.6 One challenge of the current solid electrolytes is their very narrow electrochemical stability window. For potentials negative to 1.7 V vs Li+/Li, researchers have shown by means of both Density Functional Theory (DFT) calculations and experiments that Li3PS4 reductively decomposes to Li2S and Li3P.7–9 Therefore, the electrolyte will undergo reductive decomposition when the potential is negative enough, i.e., principally at the interface of the solid electrolyte and the graphite particles in the negative electrode.
In standard lithium-ion batteries, graphite is used as the active material in negative electrodes.10,11 Here we investigate the potential of using graphite in all-solid-state batteries with attention to the reactions at the electrode-electrolyte interface. Only a few studies have been reported for graphite in combination with either Li2S-P2S5 (LPS) based electrolytes12–14 or LiI incorporated into LPS.15–17 These studies report a few cycles only, with a rather low utilization of the graphite and significant irreversibility during the first cycle. As far as related experiments are concerned, very recently Otoyama et al. developed an operando confocal microscopy technique to observe the lithiation degree of graphite across the electrode.18 Their results suggest that the Li+ ion conduction path in the graphite composite electrode worsens in the cross-sectional direction, as cracks and voids are formed during cycling.18
In this study, we report for the first time long-term electrochemical cycling of graphite in LPS based electrolytes with high confining pressure. We examine how, over several months of cycling, the electrochemical performance of graphite is affected by the type of the sulfide electrolyte, the particle size of this electrolyte, as well as the type of graphite (different size and shape). For different electrolyte-electrode combinations, we report the specific charge, the coulombic efficiency, and the capacity retention during cycling. We also evaluate the stability of the graphite-electrolyte interface by analyzing the normalized cumulative irreversible charge during cycling experiments. Our results revealed that the coulombic efficiency alone is not sufficient to evaluate the cycle life of graphite electrodes and a more sophisticated evaluation of the data is needed. In addition, by increasing the temperature of the cells during cycling, we noticed a significant increase in irreversible charge loss upon cycling.
Experimental
Materials synthesis
The precursors Li2S (99.9%, Alfa Aesar), P2S5 (99%, Sigma Aldrich), and LiI (99%, Sigma Aldrich) were used as received. LiI was vacuum-dried at 80 °C overnight. Batches of 1.3 g each of 75 mol% Li2S + 25 mol% P2S5 (0.75Li2S-0.25P2S5 denoted as LPS) and 30 mol% LiI + 70 mol% LPS (denoted LiI-LPS) were synthesized via mechanosynthesis in zirconia jars (45 mL, containing 40 g of zirconia balls, 5 mm in diameter) in a planetary ball mill (Fritsch Pulverisette 7 premium line) at 510 rpm. The total active milling time was 30 h in steps of 5 min active milling and 15 min rest, to avoid overheating of the jars and to release gases. The solid electrolyte obtained directly from the dry mechanosynthesis is denoted as "coarse" (cLPS; with LiI as cLiI-LPS). For some batches a wet pulverization treatment was applied after the mechanosynthesis to decrease the size of the particles of the solid electrolyte as proposed by the Toyota Motor Corporation, using anhydrous heptane (99%, Sigma Aldrich) as a solvent and anhydrous dibutyl ether (99.3%, Sigma Aldrich) as a dispersing agent.19,20 The compatibility between cLPS and the used solvents was verified because, in contrary to other solvents, no change of cLPS color was observed after dispersing and storing the cLPS in heptane and dibutyl ether (cf. Table SI in Supplementary Material). The dispersion was ball-milled in a jar with small zirconia balls of 0.3 and 1 mm diameter. The ratio of solid electrolyte:dibutyl ether:heptane was 11:10:79 mass%. The ball-to-powder mass ratio was 25:1. The mixture was ball-milled at 150 rpm for 20 h. After the milling procedure was completed, the solid electrolyte suspension was washed several times with heptane over a stainless steel sieve (mesh size 100 μm). The "pulverized" solid electrolyte was dried under vacuum at 90 °C for 3 h using a Büchi B-585 glass oven. The solid electrolyte which underwent the second microparticulation step is denoted as "fine" (fLPS; with LiI as fLiI-LPS). In Table SII in Supplementary Material some basic data of the solid electrolytes are listed.
X-ray diffraction (XRD)
The solid electrolytes were sealed in 0.7 mm borosilicate capillary tubes and measured with a Panalytical Empyrean device. XRD patterns were recorded in capillary mode using a Cu-Kα source with a scan rate of about 1 °/min.
Raman spectroscopy
The solid electrolytes were sealed in capillary tubes and measured with a LabRAM Horiba spectrometer with an excitation He-Ne laser of 632.8 nm.
X-ray absorption spectroscopy (XAS)
XAS measurements were performed at the S K-edge, P K-edge, and I L3-edge at the Phoenix beamline of the Swiss Light Source (SLS). For all samples, data were recorded in both total electron yield (TEY) mode and fluorescence yield (FY) mode using a solid-state fluorescence detector (Ketek GmbH). The fluorescence S K-edge, P K-edge, and I L3-edge spectra were recorded with 200 eV energy resolution and the region of interest was set on the center of the Kα line, which records also a small contribution of the Kβ line. As the S and P K-edge spectra were distorted due to self-absorption effects in fluorescence yield mode, we show the TEY spectra in Fig. S1 (available online at stacks.iop.org/JES/167/110558/mmedia) (Supplementary Material), which are self-absorption free and more sensitive to the surface layer (5–10 nm). The samples were prepared in an Ar filled glove box and fixed on Cu plate holders. Then, to avoid any exposure to air, the plates were sealed in a "coffee bag" and transferred via a glove bag to the vacuum chamber of the Phoenix beamline at SLS. The beam size used to measure all samples was 0.8 × 0.8 mm2. The spectra were normalized to a post-edge value of 1 using Athena software,21 and then compared.
Scanning electron microscopy (SEM)
The composite electrode morphology was investigated with a Carl Zeiss Ultra55 scanning electron microscope under an accelerating voltage of 3 keV using secondary electron mode and/or Inlens mode. The samples were transferred from the glove box to the SEM via an airtight transfer chamber. Cross-sections of the samples were prepared by cutting the composite electrode with a razor blade inside the glove box.
Cell preparation and electrochemical measurements
The graphitic active electrode materials were SFG6L, SFG15 (both Imerys Graphite & Carbon), and a round graphite from a confidential source. The composite electrodes were prepared by hand-mixing in an agate mortar of a 50:50 wt% mixture of graphite and the solid electrolyte. In some experiments, the electrode mixture contained additionally 3 wt% of vapor-grown carbon fibers (VGCF, Showa Denko). The electrodes were characterized in the standard "solid state cell" hardware developed in house and described elsewhere.22 The solid electrolyte layer was first pressed at about 250 MPa to ca. 300–350 μm thickness. The negative electrode mixture was then spread on the electrolyte layer and the stack was pressed at about 380 MPa. As a counter electrode, serving as a reference electrode as well, a LixIn alloy (0.4< × <0.5) was used, prepared by pressing together a lithium foil with an indium foil. The alloy contained at least 10 times the amount of lithium needed to lithiate the graphite particles. The nominal potential of 0.62 V vs Li+/Li of the LixIn alloy was used to recalculate the potential scale in some figures.23 The LixIn counter electrode was operated in a potential-stable region (× <0.9 corresponding to an alloy containing less than 47 at% Li23). The complete cells were hermetically closed and further sealed in the glove box in "coffee bags" to enhance their airtightness during the long-term cycling tests taking up to several months. The electrochemical experiments were carried out at room temperature with BioLogic Science Instruments equipment. For the SFG6L:fine LPS (SFG6L:fLPS) composite, additional tests have been carried out at 45 °C. The loading of the electrodes was from 1.1 to 1.4 mg of graphite. Due to the small amounts of the materials and their weighing in the glove box, the accuracy of their mass and consequently of the estimation of the specific charge was roughly ±5%. Note that the used nomenclature is always related to full cells, thus, the term charge means lithiation (reduction) of graphite and the term discharge refers to the delithiation (oxidation) of LixC6.
Electrochemical impedance spectroscopy (EIS)
Pellets with 7 mm diameter containing 25 mg of a solid electrolyte were compressed uniaxially under 380 MPa using a hydraulic press. Then, the thickness of these pellets was measured. The insulated die sleeve used for pressing with contacts made by the stainless steel plungers was placed in a cell holder. A maximal pressure of 80 MPa was then applied by tightening the screws.22 The EIS spectra were recorded in this electrochemical test cell with an AC signal of 10 mV in a frequency range from 7 MHz to 10 mHz using a BioLogic VSP potentiostat. The overall (effective) ionic conductivity of the composite electrodes was assessed from EIS spectra24–26 measured in symmetric electrochemical cells containing a trilayer of two composite electrodes (pressed at 380 MPa) and a solid electrolyte layer in the middle (pressed at 250 MPa). The trilayer was sandwiched between the stainless steel plungers and kept under a maximal pressure of 80 MPa. The composition of the composite electrodes was 50 wt% of graphite and 50 wt% of solid electrolyte.
Results and Discussion
Electrolyte characterization
The coarse electrolytes 0.75Li2S-0.25P2S5 (cLPS) and 0.3LiI-0.7(0.75Li2S-0.25P2S5) (cLiI-LPS) show ionic conductivities of 0.3 mS cm−1 and 1.1 mS cm−1, respectively, as evaluated from EIS spectra shown in Fig. S2. The reported ionic conductivity of LiI at room temperature is orders of magnitude lower than that of LPS.27 From the geometric consideration, the dilution of LPS with the less conducting LiI should decrease the overall conductivity. However, the addition of halides is claimed to increase the concentration of Li+ charge carriers and thus the overall ionic conductivity of LPS.3,28 In our case, the influence of the charge carriers and/or other effects apparently overrides the expected conductivity decrease due to the dilution of the LPS.
The coarse electrolyte samples subjected to the pulverization treatment showed ionic conductivity values of 0.3 mS cm−1 for fine LPS (fLPS) and 0.6 mS cm−1 for fine LiI-LPS (fLiI-LPS), respectively. The halving of the overall ionic conductivity of LiI-LPS after the pulverization treatment might eventually be caused by the slight deviation from the formal stoichiometry. Lithium iodide is moderately soluble in ethers29 and can react with diethyl ether.30 Therefore, we can speculate that LiI dissolution and eventually some reactions happened during the wet step of pulverization. The interface and eventually the bulk of the treated LiI-LPS could have been affected. However, the minor deviation, if any, from the formal stoichiometry was below the detection limits of the applied analytical methods.
The electrolyte particle morphology (Fig. S3) analysis reveals that the initial size of cLPS particles of 5 μm range was decreased below 1 μm in average for the fLPS. The particle size reduction was similar for the LiI-LPS electrolyte as well.
The selected XRD diffractograms shown in Fig. S4 reveal that the solid electrolytes are amorphous, as the characteristics of the crystalline initial precursors Li2S, P2S5, and LiI disappeared after the ball billing. From the Raman experiments shown in Fig. S5 we see that both coarse (solid lines) and fine (dashed lines) solid electrolytes show the same spectra. All the four solid electrolytes have mainly PS43− tetrahedra in their structure (Raman vibration around 420 cm−1 31). Within the detection limits of the method, we can thus conclude that the precursors fully reacted and there is no significant deviation in the stoichiometry caused by the pulverization treatment.
To confirm that the coarse electrolytes cLPS and cLiI-LPS after having been exposed to the wet pulverization treatment have not changed their sulfur and phosphorus local environments, XAS measurements in TEY mode were performed at the S and P K-edges. Figs. S1A–S1D confirm that the oxidation state of both S and P at the outer surfaces of the particles has not been impacted during the wet milling process. Moreover, from the I L3-edge spectra in Fig. S1E we can conclude that cLiI-LPS and fLiI-LPS contain LiI with a disordered structure, as the features after the main absorption peak disappear due to the absence of long-range ordering in the amorphous halide-added electrolyte. The LiI precursor (Fig. S1E) has a crystalline structure and thus shows a clear fine structure of the absorption coefficient after the I L3-edge. A similar change in the Ag L3-edge spectra of crystalline and nano-sized AgI particles was shown previously in Ref. 32.
Graphite cycling
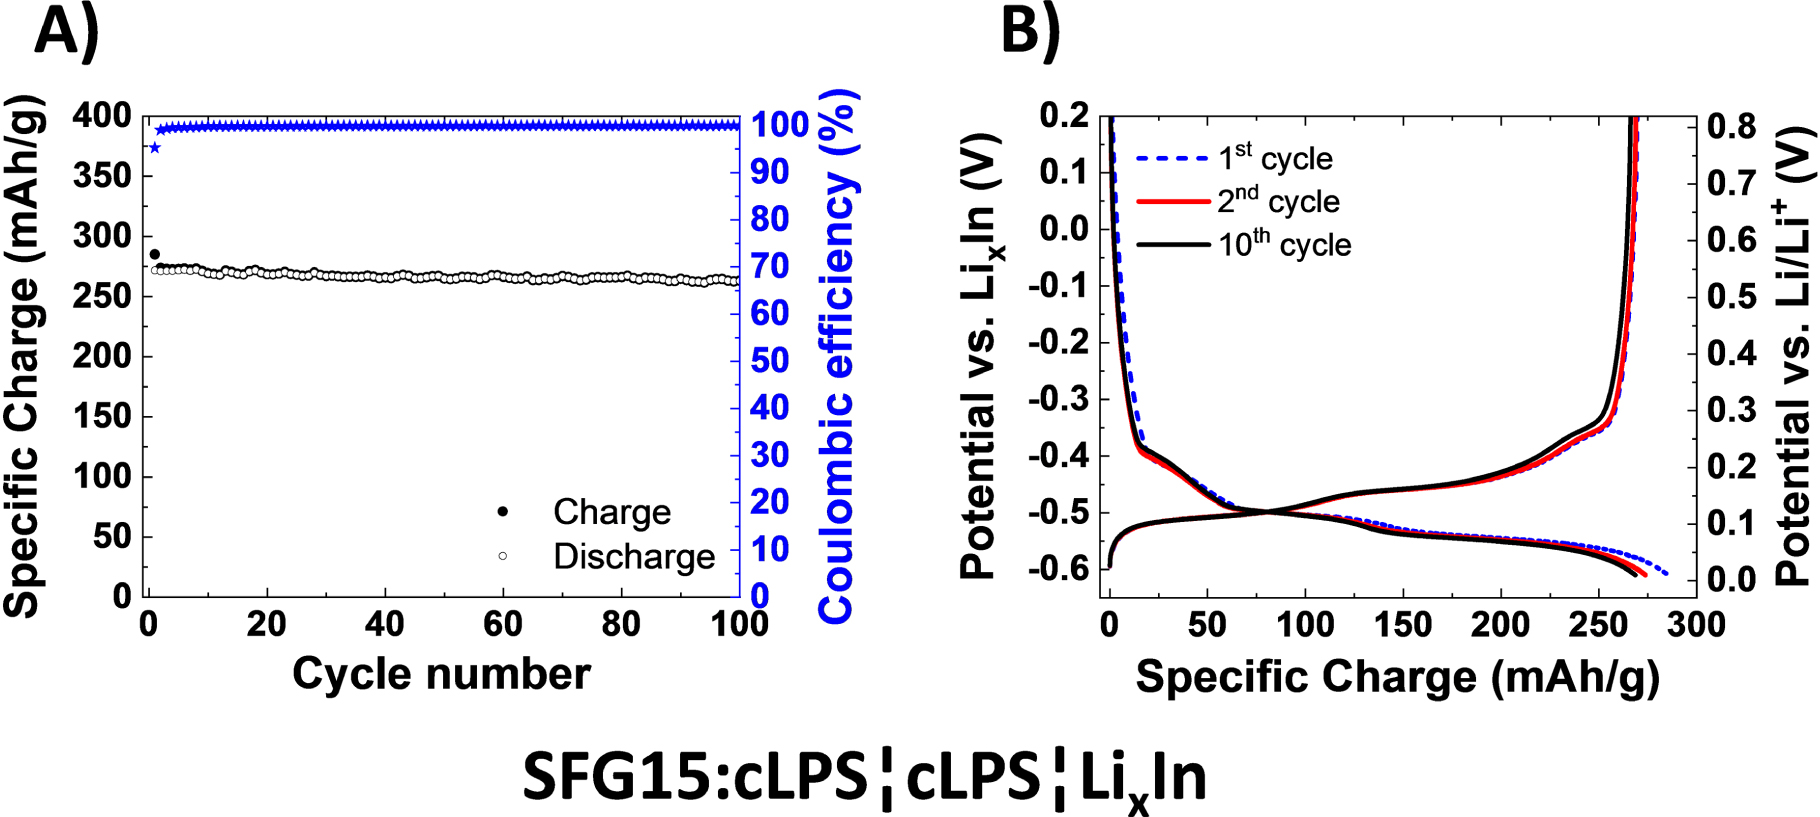
First, to create a baseline using standard materials, the electrochemical performance of the SFG15 graphite has been assessed with the cLPS and cLiI-LPS electrolytes (Figs. 1 and 2). The cell containing the halide-free negative electrode (Fig. 1) only reached a specific charge of 290 mAh g−1 during the first charge, as compared to 365 mAh g−1 for the LiI-containing electrode (Fig. 2). The latter value is close to the theoretical specific charge of 372 mAh g−1 for graphite lithiation in the absence of side reactions. Therefore, the utilization of the graphite electrode is significantly improved with the electrolyte containing LiI. This electrode also showed a reasonable cycling stability. The coulombic efficiency (CE) during the first cycle was very similar for both types of composite negative electrodes, close to 95%. At first glance, the interpretation could be (i) that the side reactions can be almost neglected and that there are no additional side reactions triggered due to the presence of LiI. From the potential profiles shown in Figs. 1B and 2B, it is clear that the polarization is low and does not significantly increase upon further cycling. In other words, the overall cell resistance does not significantly increase during cycling at the rather low C/20 rate. In terms of capacity retention after 100 cycles, the SFG15:cLPS electrode showed a slightly better cycling behavior but was cycling to a lower lithiation degree, as it still maintained ca. 97% of the initial reversible specific charge. This is 5% higher than the value for the SFG15:cLiI-LPS electrode which maintained ca. 92% of the initial reversible specific charge.

Figure 1. (A) Specific charge in respect to the graphite mass of a half-cell with the cLPS solid electrolyte layer and the working electrode SFG15:cLPS (50:50 wt%), cycled at 25 °C at C/20 rate between −0.61 and 1.50 V vs LixIn. (B) Selected potential profiles of the same cell SFG15:cLPS¦cLPS¦LixIn.
Download figure:
Standard image High-resolution image
Figure 2. (A) Specific charge in respect to the graphite mass of a half-cell with the cLiI-LPS solid electrolyte layer and the working electrode SFG15:cLiI-LPS (50:50 wt%), cycled at 25 °C at C/20 rate between −0.61 and 1.50 V vs LixIn. (B) Selected potential profiles of the same cell SFG15:cLiI-LPS¦cLiI-LPS¦LixIn.
Download figure:
Standard image High-resolution imageElectrolyte degradation—stability of electrode-electrolyte interface
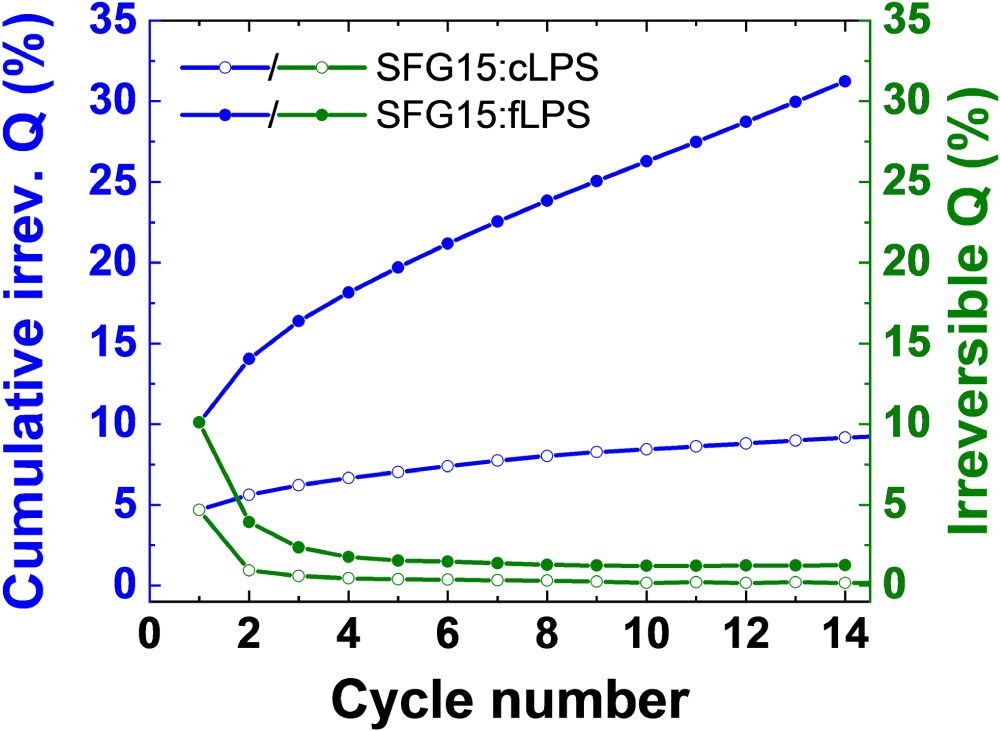
At first glance, the long-term cycling performance of graphite seems to be excellent for both electrolytes and the coulombic efficiency appears high. However, only the cumulative irreversible charge for the entire cycling is relevant for practical cells. Figure 3 shows the normalized cumulative irreversible charge consumption, often called a charge "loss." (Details concerning the reasoning, the definition, and the mathematical description are in33,34 and in the Supplementary Material.) The results reveal that the interface is indeed not stable, as additional charge is consumed in every cycle, and obviously lithium ions as well. This effect is more pronounced for the SFG15:cLiI-LPS composite electrode than for the SFG15:cLPS one—the normalized cumulative irreversible charge Q increases much faster for the former. Over 100 cycles, the value for SFG15:cLiI-LPS increases from about 5% in the first cycle to 40% which is more than 3 times higher than for the SFG15-cLPS electrode, as can be seen in Fig. 3. This result is surprising considering that the addition of LiI in LPS is suggested to improve the electrochemical stability window at low potentials.16,17,28 It is also contradictory to the fact that LiI-LPS needs less electric charges to be electrochemically fully degraded (cf. Eqs. S1 and S2 in Supplementary Material). Thus, we could not confirm that the presence of LiI helps to stabilize the interface, on the contrary it shows worse stability compared to the coarse LPS. Here, it is worth to point out that LiI is thermodynamically stable in the potential window where graphite works.7 Moreover, the newly formed interface on both electrode types is not electronically insulating since it does not prevent further electrolyte reduction and the interface layer must therefore grow during cycling. This can be eventually explained by the electronic properties of the expected electrolyte reduction byproducts such as the LixP which are electronically semi-conductive contrary to the insulating Li2S and LiI species.8,35,36

Figure 3. Normalized cumulative and per cycle, respectively, irreversible charge (Q) of (A) a half-cell with the cLPS solid electrolyte layer and the working electrode SFG15:cLPS (50:50 wt%) and (B) a half-cell with the cLiI-LPS solid electrolyte layer and the working electrode SFG15:cLiI-LPS (50:50 wt%). Both cells were cycled at 25 °C at C/20 rate between −0.61 and 1.50 V vs LixIn.
Download figure:
Standard image High-resolution imageEffect of the solid electrolyte particle size on the first cycle irreversibility and the utilization of graphite
If our hypothesis postulating continuous growth of an interfacial layer is correct, then there would have to be an effect of the contact area between the graphite particles and the electrolyte. Decreasing the electrolyte particle size should increase the number of contact points (i.e., the contact area) between the fine solid electrolyte and the graphite. For this purpose, the comparison was made between cells with SFG15:cLPS (Fig. 1) and SFG15:fLPS (Fig. 4). Remember, the accuracy of the specific charge estimation is about ±5%. The specific charge of about 340 mAh g−1 delivered by the SFG15:fLPS electrode is excellent. However, for comparison with other experiments the relative values of charge "loss" are more meaningful. More electrolyte degradation can be observed in the first cycle for SFG15:fLPS (charge "loss" of about 10%). This can be attributed to the increased contact area between the small fLPS particles and the SFG15 flakes. In Fig. 5, the normalized cumulative irreversible charge consumption and the irreversible charge "loss" per cycle are presented. It is obvious that the normalized cumulative irreversible charge "loss" of the SFG15:fLPS electrode increases after the first cycle at least 4 to 5 times faster than for the SFG15:cLPS composite graphite electrode. The difference in the cumulative irreversible charge "loss" between cycle 10 and cycle 1 is about 16% for the SFG15:fLPS electrode but less than 4% for the SFG15:cLPS electrode. Thus, this experiment confirms our hypothesis postulating that the solid electrolyte particle size affects both the first cycle irreversibility and the irreversible charge "loss" during cycling. Of course, by increasing the contact area between the graphite and the electrolyte the utilization of the graphite was improved at the same rate (C/20). The capacity retention was excellent for both, SFG15:fLPS and SFG15:cLPS.

Figure 4. (A) Specific charge in respect to the graphite mass of a half-cell with the cLPS solid electrolyte layer and the working electrode SFG15:fLPS (50:50 wt%), cycled at 25 °C at C/20 rate between −0.61 and 1.50 V vs LixIn. (B) Selected potential profiles of the same cell SFG15:fLPS¦cLPS¦LixIn.
Download figure:
Standard image High-resolution image
Figure 5. Normalized cumulative and per cycle, respectively, irreversible charge (Q) of half-cells with the cLPS solid electrolyte layer and the working electrodes SFG15:cLPS (50:50 wt%; open symbols) and SFG15:fLPS (50:50 wt%; solid symbols), respectively. Both cells were cycled at 25 °C at C/20 rate between −0.61 and 1.50 V vs LixIn.
Download figure:
Standard image High-resolution imageEffect of the graphite type on the electrochemical performance
Since the contact area between graphite and solid electrolyte has a significant influence on the cycling behavior, in the next step the influence of the size of flake-type graphite particles and the graphite shape (flakes vs round particles) was investigated focusing on the variations in the irreversibility during the first cycles. The two coarse electrolytes cLPS and cLiI-LPS and the two fine electrolytes fLPS and fLiI-LPS were tested in combination with SFG6L, SFG15, and a round graphite. Not all the possible combinations have been tested, as the goal was to identify if some trends could be revealed.
Between SFG15 (d90 of 15 μm) and the smaller SFG6L (d90 of 6 μm), when tested in combination with the coarse electrolytes cLPS and cLiI-LPS, the irreversibility during the first cycle is not much affected. As can be seen in Table I, for cLPS:SFG6L the coulombic efficiency (CE) equals 93.6% and for cLPS:SFG15 it is 95.3%. For the cLiI-LPS electrolyte, the first cycle irreversibility is even less affected if mixed with SFG15 or SFG6L, as the CE values differ by less than 1%. However, an important difference in the CE for the first cycle can be notified when we compare fLPS in combination with SFG15 and SFG6L, which have respectively a CE of about 90% and 85%. The smaller particles of SFG6L with a higher BET specific surface area (see Supplementary Material) have presumably better contact with the fine fLPS electrolyte. The same trend is observed for the normalized cumulative irreversible charge listed in Table II. The normalized cumulative irreversible charge after 10 cycles is higher for SFG6L:fLPS than for SFG15:fLPS. A significant increase in the normalized cumulative irreversible charge after 10 cycles is also noticeable for the SFG6L:cLPS, reaching a value higher than 18%, compared to the one of SFG15:cLPS which is 2 times lower. For all the experiments with flake-type graphites SFG15 and SFG6L, the capacity retention was excellent over the first 10 cycles and no major differences can be noticed in Table III. A last electrochemical test to assess the influence of the graphite shape (flakes vs round particles) was performed with the round graphite and the cLiI-LPS electrolyte. We noticed mainly an increased normalized cumulative irreversible charge of about 35%, a much higher value compared to 14% for SFG15:cLiI-LPS. This is in line with our hypothesis, as we expect a better contact with the electrolyte and consequently more interfacial side reactions for the round graphite particles.
Table I. Coulombic efficiency in the first cycle for different combinations of graphite and solid electrolytes cycled at 25 °C at C/20.
| cLPS | fLPS | cLiI-LPS | fLiI-LPS | |
|---|---|---|---|---|
| SFG6L | 93.6% | 85.0% | 94.6% | N.A. |
| SFG15 | 95.3% | 89.9% | 95.2% | 88.0% |
| Round graphite | N.A. | N.A. | 94.4% | N.A. |
Table II. Normalized cumulative irreversible charge (%) after 10 cycles for different combinations of graphite and solid electrolyte cycled at 25 °C at C/20.
| cLPS | fLPS | cLiI-LPS | fLiI-LPS | |
|---|---|---|---|---|
| SFG6L | 18.6% | 33.7% | N.A. | N.A. |
| SFG15 | 8.4% | 26.3% | 14.2% | N.A. |
| Round graphite | N.A. | N.A. | 34.8% | N.A. |
Table III. Capacity retention for discharge after 10 cycles in respect to the first cycle for different combinations of graphite and solid electrolyte cycled at 25 °C at C/20.
| cLPS | fLPS | cLiI-LPS | fLiI-LPS | |
|---|---|---|---|---|
| SFG6L | 98.5% | 99.2% | N.A. | N.A. |
| SFG15 | 99.0% | 100.7% | 98.5% | N.A. |
| Round graphite | N.A. | N.A. | 97.2% | N.A. |
Morphology of the composite electrode
The graphite-electrolyte contact area depends not only on the graphite and electrolyte type but also on the morphology, and on the homogeneity of the composite electrodes as well. SEM was the method of choice to investigate the contact between the particles and the distribution of the solid electrolyte and graphite in the composite electrodes. As an example, we show in Figs. 6A and 6B that the contact and the dispersion between the cLPS electrolyte and the graphite SFG6L particles is not optimal. Figures. 6C and 6D shows that, by decreasing the electrolyte particle size via the wet ball-milling route (fLPS), the contact between the fLPS electrolyte and the graphite SFG6L particles is improved.

Figure 6. (A) Cross-section and (B) top view SEM images of the SFG6L:cLPS (50:50 wt%) electrode after mortar hand mixing and pressing at 380 MPa on a cLPS electrolyte layer; (C) cross-section and (D) top view SEM images of the SFG6L:fLPS (50:50 wt%) electrode after mortar hand mixing and pressing at 380 MPa on a cLPS electrolyte layer.
Download figure:
Standard image High-resolution imageRate performance
For the rate capability evaluations, the electrolyte with the highest ionic conductivity, cLiI-LPS, was selected to minimize the decrease of the electrode ionic conductivity due to the presence of pores in the composite electrodes. In Fig. 7A the data for the SFG15 based electrode are shown. As expected, the practical specific charge decreases for higher C rates. At 1 C rate, the electrode only delivers about 26% of the specific charge attainable at C/20. Nevertheless, the strain due to higher rates does not noticeably influence the capacity retention during cycling. From the EIS data shown in Fig. S6 the overall ionic conductivity in the cLiI-LPS:SFG15 electrode is 6 μS cm−1, a number explaining the poor rate capability of the electrode.

Figure 7. (A) Specific charge retention in respect to the graphite mass of a half-cell with the cLiI-LPS solid electrolyte layer and the working electrode SFG15:cLiI-LPS (50:50 wt%), cycled at 25 °C at different C-rates between −0.61 and 1.50 V vs LixIn. (B) Selected potential profiles of the same cell SFG15:cLiI-LPS¦cLiI-LPS¦LixIn at the different C-rates.
Download figure:
Standard image High-resolution imageIf insufficient interfacial contacts are the bottleneck, the rate capability should increase with improved contact between the solid electrolyte and the graphite particles. This can be achieved by using smaller graphite particles and a fine electrolyte. However, as shown in Fig. 8 (top, left blue part) the specific charge delivered by SFG6L:fLPS at higher C-rates is lower than for SFG15:cLiI-LPS. At 1 C, despite the fine electrolyte fLPS and smaller graphite particles, the performance is 6 times worse than for the coarse electrolyte cLiI-LPS and bigger graphite particles. The effective ionic conductivity from data in Fig. S7 of 7 μS cm−1 is only marginally higher for the SFG6L:fLPS electrode. As the contact area between SFG6L and fLPS was significantly increased, there are two "and/or" explanations: (i) In line with the results discussed above, we can assume that a kind of interfacial barrier (presumably a layer of electrolyte decomposition products) is decisive for the rate capability of the electrode. A comparison with a cell containing the SFG6L:cLPS electrode (Fig. S8) confirms that the fine LPS does not help to increase the rate performance. Indeed, the first cycle irreversibility and the normalized cumulative irreversible charge after 10 cycles are higher for the SFG6L:fLPS electrode than the SFG6L:cLPS one (Tables I and II). (ii) Another explanation for the difference in results between the coarse electrolyte and the fine electrolyte could come from the electrode microstructure. The big, electronically highly conducting SFG15 particles are connected in a significant volume of the electrode to an ionic network where the effective length of the ionically conductive paths is much shorter. In such a case, even if the global ionic conductivity is lower, the graphite particles can then work well at a higher rate. On the contrary, for the fine LPS and small graphite particles, the average electronic conductivity of the electrode will be lower and the effective length of the ionically conductive paths will be longer, with the consequence of more inhomogeneous current distribution in the volume of the electrode. The consequence is that only a low graphite capacity can be charged at high rate. This difference could then explain the a priori paradoxical results between coarse electrolyte & big graphite particles compared to fine electrolyte and small graphite particles.

Figure 8. (Top) Specific charge and coulombic efficiency at 25 °C and 45 °C under different cycling regimes (C-rates) and (bottom) the corresponding cumulative irreversible charge (Q) and the cumulative charge (which models the total amount of lithium consumed at the lithiated state) as a function of time for a half-cell with the solid electrolyte layer of cLPS and the working electrode SFG6L:fLPS (50:50 wt%) containing fine electrolyte, cycled between −0.61 and 1.50 V vs LixIn.
Download figure:
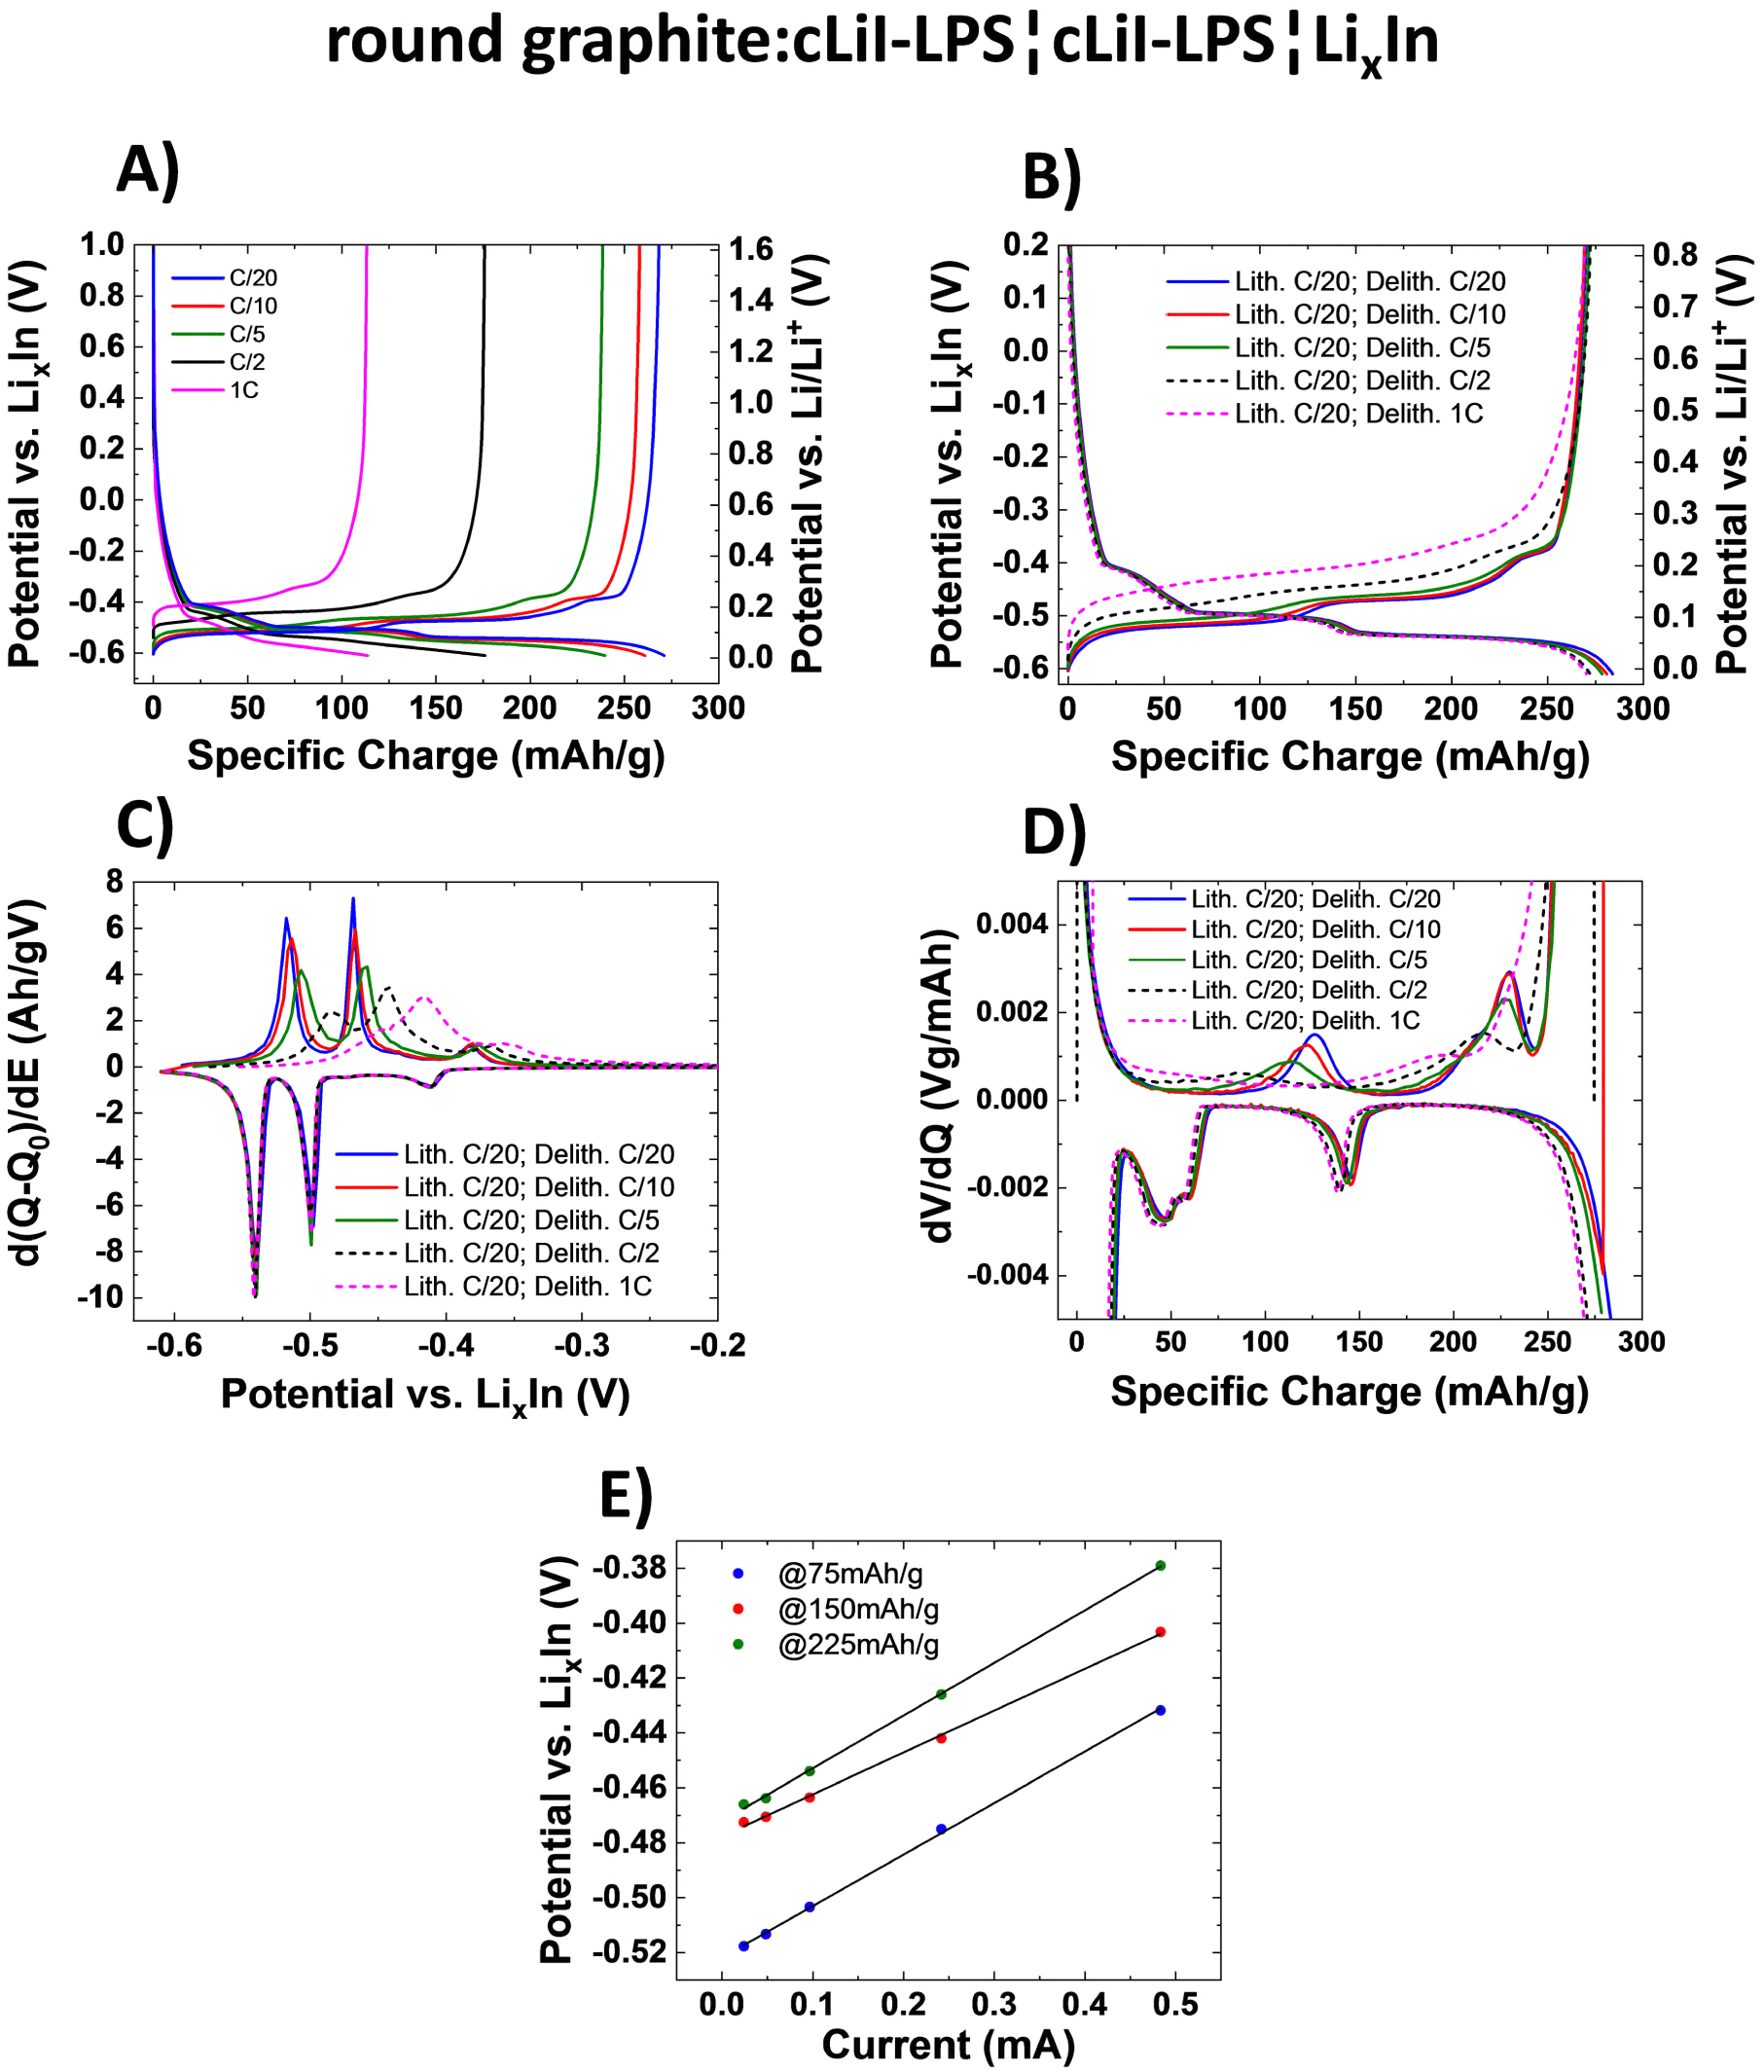
Standard image High-resolution imageIn cells with liquid electrolytes, the carbon particle shape and surface morphology is relevant to both engineering of the electrodes and irreversible charge consumption due to side reactions.37,38 Spherical graphite particles result in higher current rate performance than soft flaky graphite particles.39–41 As can be seen from Fig. 9A, this is true also for the sulfide solid electrolyte. Indeed, at the moderate C/5 rate, the round graphite:cLiI-LPS electrode retained 87% of the capacity compared to 72% for SFG15:cLiI-LPS. And at 1 C, 38% capacity retention was obtained for the round graphite:cLiI-LPS electrode in contrast to 26% for SFG15:cLiI-LPS. Note that the round graphite particle size is similar to the one of SFG15.

Figure 9. (A) Selected potential profiles of a half-cell with the cLiI-LPS solid electrolyte layer and the working electrode round graphite:cLiI-LPS (50:50 wt%), cycled at 25 °C at different C-rates (charge and discharge at the same rate) between −0.61 and 1.50 V vs LixIn. (B) Selected potential profiles, (C) dQ/dV curve, and (D) dV/dQ curve of the same cell round graphite:cLiI-LPS¦cLiI-LPS¦LixIn, cycled at 25 °C at the same lithiation rate (charge) but with different discharge rates, between −0.61 and 1.50 V vs LixIn. (E) Estimation of the apparent resistance via potential vs current plot. Three linear fits of data from (B) at C-rates C/20, C/10, C/5, C/2, and 1 C for 75 mAh g−1, 150 mAh g−1, and 225 mAh g−1 based on the potential profile during discharge.
Download figure:
Standard image High-resolution imageIn many practical applications, cells are charged at low rates but a maximized power density on discharge is needed. To assess the suitability of graphite for this regime a modified cycling protocol was applied. The charge rate was always C/20 and the discharge rate varied. The results for the composite electrode showing the highest rate performance in standard tests, the round graphite:cLiI-LPS, are presented in Fig. 9B. Indeed, discharge rates up to 1 C are possible. However, the polarization increases with increasing C-rates, as clearly visible in Fig. 9B. From the dQ/dV plots (Figs. 9C and 9D), the broadening of the peaks at higher rates points to inhomogeneous delithiation of the graphite particles. Clearly, concentration gradients are created within the graphite and the electrolyte.42
The potential vs current curves in Fig. 9E show that the polarization increases almost linearly with the current. Due to the linearity, we hypothesize that the polarization is mostly due to the ionic resistance of the electrolyte. The apparent ohmic-type resistance, roughly estimated from the plot in Fig. 9E, is ca. 180 Ω, which translates in terms of overall ionic conductivity of the electrode to about 80 μS cm−1. Note that the conductivity of the solid electrolyte layer is much higher, 1.1 mS cm−1. The explanation is that the lengths of the ionically conductive paths to different graphite particles are different and consequently the current distribution in the depth direction is not uniform. The electrode is therefore not working homogeneously. If we consider the first layer of graphite particles on the solid electrolyte layer side, these particles are in contact with the solid electrolyte layer and the coarse electrolyte particles between the graphite particles. Therefore, the ionic paths of the electrolyte in contact with graphite particles in the first layer will be much shorter than those for the deeper graphite layers.
For all the studied electrode compositions, we noticed a strong limitation at charging rates higher than C/10 but the discharge was less critical. The reason is obvious, as during the charge the potential must stay above the threshold of lithium plating but on discharge a higher overpotential can be tolerated.
Effect of temperature on the cell performance
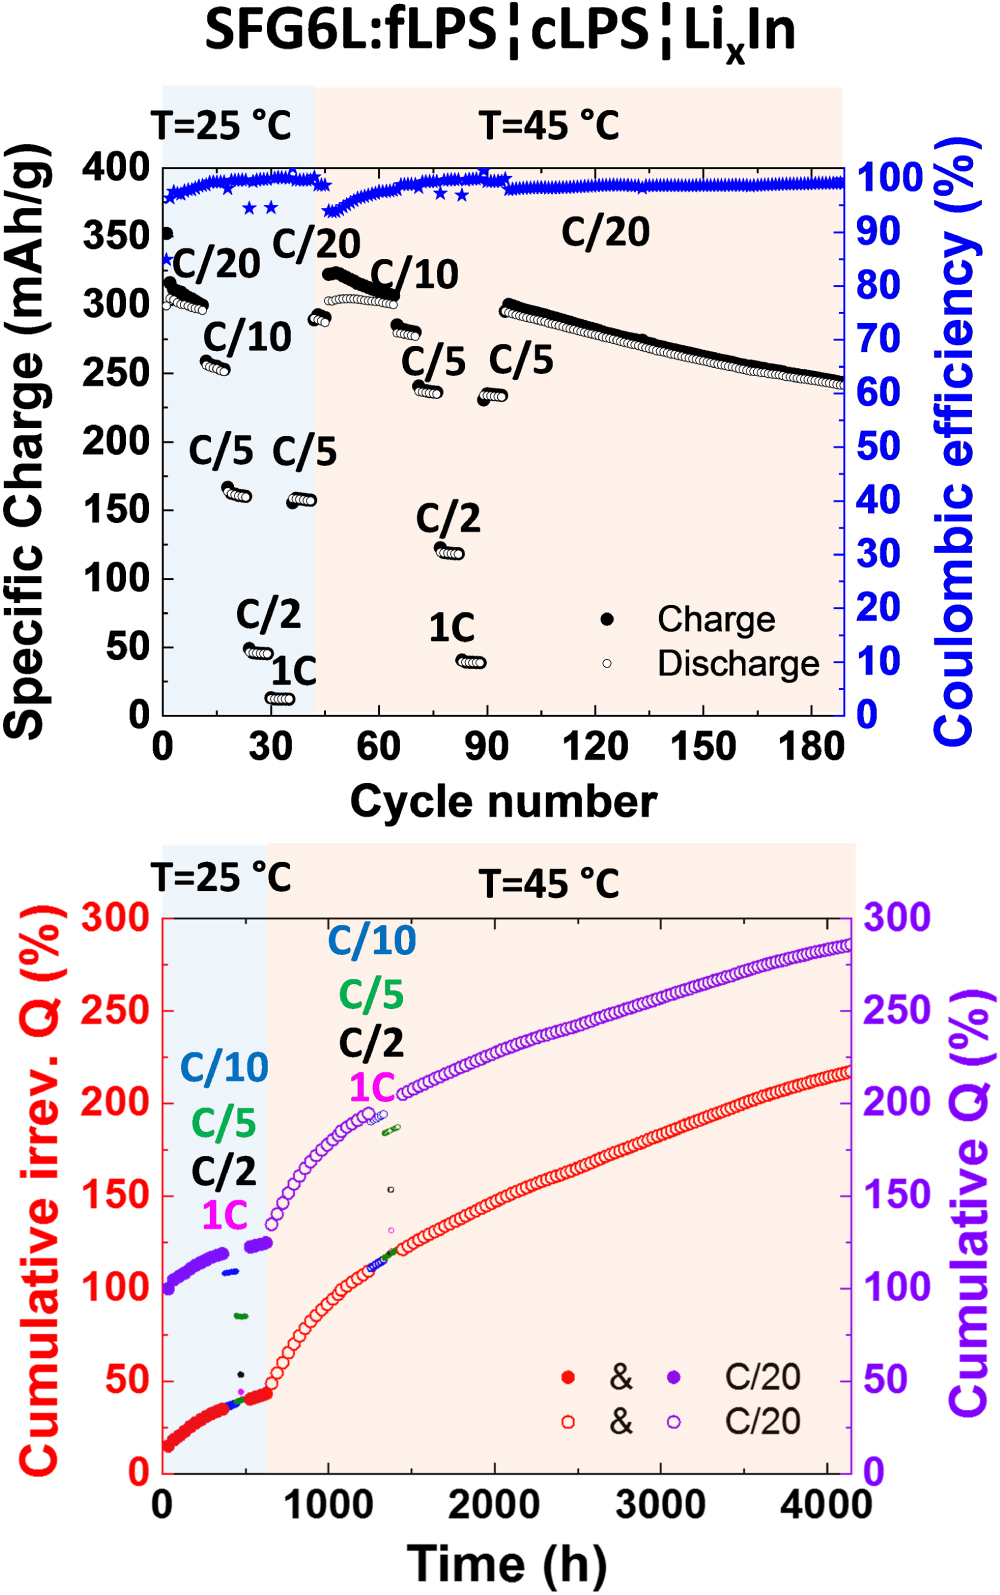
Ionic conductivity increases with increasing temperature. The overall ionic conductivity of the composite electrode should thus increase with the temperature and the graphite utilization should be improved. On the other hand, the kinetics of all reactions is faster and, therefore, we expect that interfacial degradation will be enhanced at higher temperatures. To assess these effects the composite SFG6L:fLPS was studied. At 45 °C, the practical specific charge increased for every tested C-rate (Fig. 8 top). As an example, at C/5 rate the SFG6L:fLPS. electrode delivers 237 mAh g−1 at 45 °C and only 160 mAh g−1 at 25 °C. The increase of cumulative irreversible charge "loss" with time (Fig. 8, bottom) is also higher when the cell temperature is increased from 25 °C to 45 °C. The irreversible charge "loss" is dependent on time, as the smoothly increasing curve in Fig. 8 (bottom) suggests. The irreversible degradation at C/20 rate from cycle 1 to cycle 10 is roughly 19% at 25 °C. At 45 °C (cycle 46 to cycle 56), the increase is about 2 times faster for the same C-rate. We assume that the enhanced electrolyte degradation is responsible for the decreased cycling stability at 45 °C: from cycle 95 to cycle 189, the practical specific charge decreased by 18%.
At both temperatures, 25 °C and 45 °C, the cumulative irreversible charge and the cumulative charge (which models the total amount of lithium consumed at the lithiated state, see Supplementary Material) grow first very rapidly with time and then the growth rate slows down but does not stop with time (Fig. 8, bottom). An attempt to model the growth of the degradation layer over time with a root type function can be found in the Supplementary Material and in Fig. S9. The rate of the side reactions seems thus to be increasingly limited, presumably due to the diffusion through the steady-growing layer at the interface graphite-electrolyte. This layer does not have blocking properties, as the electrolyte decomposition does not stop even after 1500 h. Furthermore, we evaluated the potential profiles for the SFG6L:fLPS system at 25 °C and 45 °C and estimated that the overpotential at both temperatures is roughly between 20 and 40 mV at the C/20 rate. With increasing cycle number, only slight increase in overpotential was noticed.—To conclude this part, the temperature increase has a strong adverse effect on the cell. Excursions to higher temperatures should be therefore avoided.
Effect of electrode thickness
All the above experiments were performed for cells with thin composite electrodes. For the engineering of the graphite electrodes, maximizing the thickness is of utmost importance to achieve high energy densities on the cell level. In order to address this aspect, a test cell was built with a SFG15:cLiI-LPS (50:50 wt%) electrode with a thickness close to the technical requirements, namely about 120 μm. This cell is compared to a standard half-cell with working electrode thickness of about 35 μm (Fig. 10). The solid electrolyte layer was cLiI-LPS. The cell with the thick electrode was first cycled at C/20 rate for 2 cycles and then at C/80 rate, to allow comparison at similar current densities in respect to the geometrical area of the electrodes. Figure 10 depicts the potential profiles as well as the differential capacity (dQ/dV) and differential potential curves (dV/dQ). The cell with the thick electrode delivers less specific charge (about 244 mAh g−1; cf. Fig. 10C) than the cell with standard configuration (340 mAh g−1; cf. Figs. 10C and 2). From the potential profile, it is obvious that the cell with the thick electrode suffers from a larger polarization, presumably due to higher ohmic overpotential. This is expected since the mean pathway for the Li ions to reach all the graphite particles is much longer. Figures 10A–10B shows that the utilization of the thick electrode is lower and the reactions are less homogeneous, as the peaks are weaker, broader, and shifted to the negative direction.43 The standard electrode at C/5 rate (see Fig. 7) shows similar electrochemical performance as the thick electrode at C/80 rate.

Figure 10. (A) dQ/dV and (B) dV/dQ curves and (C) potential profiles for the 4th charging cycle of two half-cells with the cLiI-LPS solid electrolyte layer and the working electrode SFG15:cLiI-LPS (50:50 wt%), cycled at 25 °C at a similar geometrical current density between −0.61 and 1.50 V vs LixIn. The working electrode thickness was about 35 μm for the standard electrode (SFG15 loading = 3.4 mg cm−2; 1.26 mAh cm−2) and 120 μm for the thick electrode (SFG15 loading = 11.7 mg cm−2; 4.36 mAh cm−2), respectively. The standard electrode was cycled at a rate of C/20 (63.7 μA cm−2) and the thick electrode was cycled at a rate of C/80 (53.9 μA cm−2).
Download figure:
Standard image High-resolution imageFor a deeper analysis of the data, the cycling profiles and their derivative curves were normalized in different ways (cf. Figs. 10 and S10). Shortly, the ratio of the magnitudes of the first dQ/dV lithiation peaks (Figs. S10A and S10D) is roughly 3, close to the mass ratio of 3.4 of the two respective electrodes. This means that the entire thick electrode is working reasonably at the beginning of the lithiation. This ratio for the second and third dQ/dV lithiation peak is roughly 1.3 and 1.7, respectively, showing thus lower lithiation degree of the thicker electrode. We hypothesize that this could be due to the electrode swelling, as graphite expands up to 10% when lithiated.44,45 The expansion could lead to cracks in the ionic network increasing thus the overpotential and eventually isolate some parts of the electrode.—In summary, we conclude that both excellent cycling performance and high utilization of graphite can be achieved only at low loadings (<4 mg cm−2) and low rates (below C/10).
Effect of conductive additives
A remaining question was if the addition of a conductive additive to the composite electrode mass could improve the practical specific charge. Therefore, 3 wt% of VGCF were introduced to a 50:50 wt% SFG15:cLiI-LPS electrode which was then cycled under standard conditions. The result presented in Fig. 11 (bottom) shows that the irreversibility during the first cycle increased slightly close to 7% compared to less than 5% for the case without VGCF. It seems that the addition of VGCF (with a slightly higher BET specific surface area than SFG15, cf. Table SIII of Supplementary Material) worsens the electrolyte degradation during the first cycle due to the enlarged contact area to the electrolyte. The coulombic efficiency of the electrode containing VGCF is about 97% after the first cycle, much worse than for the SFG15:cLiI-LPS case (higher than 99%). The cycling stability (Fig. 11, top) is poorer and the normalized cumulative irreversible charge consumption per cycle (Fig. 11, middle) is increased. When plotting the cumulative charge and the cumulative irreversible charge vs time in the same graph (Fig. 11, bottom), it can be observed that the cumulative irreversible charge increases faster than the cumulative charge, which is typical for an electrode which consumes irreversibly lithium and has also charging issues, as the specific charge is also decreasing with the cycle number.33

Figure 11. (Top) Cycling behavior, (middle) normalized cumulative irreversible charge vs cycle number, and (bottom) normalized cumulative irreversible charge (Q) and normalized cumulative charge vs time of a VGCF:SFG15:cLiI-LPS¦cLiI-LPS¦LixIn cycled at 25 °C at C/20 rate between −0.61 and 1.50 V vs LixIn. (*) At marked points the cell temperature fluctuated by malfunction of the air conditioning.
Download figure:
Standard image High-resolution image
Conclusions
We have demonstrated excellent cycling stability and high utilization of graphite electrodes in cells with LPS based solid electrolytes. At a given rate, the utilization of graphite can be improved by decreasing the size of the sulfide electrolyte particles. The interface of LPS to graphite is however unstable. The layer of decomposition products at the interface increases rapidly during the first cycles and then does not stop over time, following a kind of root type function. A noticeable irreversible charge consumption exists even after several months of cycling. We demonstrated that coulombic efficiencies close to 100% in a particular cycle are not sufficient to assume good long-term cycling behavior of a cell. To this point, we propose to compare the cumulative irreversible charge for the entire cycling to avoid misinterpretation of the electrochemical cycling data. Finally, we demonstrated that optimizing the graphite electrode morphology is important to enhance the power performance of the cells.
Acknowledgments
The authors acknowledge the financial support from SAFT and the Paul Scherrer Institute. L. H. would like to thank Dr. Xiaohan Wu and Marcel Locher for the initial design of the electrochemical cell. The XAS measurements were performed at the PHOENIX beamline at the Swiss Light Source, Paul Scherrer Institut, Villigen, Switzerland.