

Abstract
The present paper describes the excellent input performance of graphene-like graphite (GLG) as a negative electrode material for the lithium ion batteries (LIBs), which should allow a new rapid charging method. We find that the GLG electrode can be fully charged only within several minutes by the constant voltage mode, i.e., without resorting to the constant current mode, during which the maximum current reaches as high as ca. 80 A g−1. No evidence is observed for the lithium metal deposition on the GLG electrode, despite the rapid charging at the voltage below the lithium deposition potential. These characteristics have never been achieved by graphite, currently used as the negative electrode material in LIBs. The GLG-based negative electrode should not only provide a safe and rapid charging method but also facilitate the battery control of LIBs.
Export citation and abstract BibTeX RIS
Lithium ion batteries (LIBs) are currently not only used as the power source for many portable devices but are also an important technology to support electric and hybrid vehicles.1–3 It has become more and more challenging for the current LIBs to meet the requirements associated with the expansion of large-scale applications, such as higher capacity and better input/output (charging and discharging rate) performance. The development of electrode active materials is hence called for to replace conventional ones such as Li-containing transition metal oxides and graphite.4,5 As for the negative electrode, silicon can be an alternative thanks to its capacity ten times higher than that of graphite. Yet one has to circumvent many issues associated with silicon's significant volume change during the lithiation and delithiation.6–9 Graphene, carbonaceous material same as graphite, can be another candidate for the negative electrode because they are superior to graphite in the capacity and input/output performances.10–12 A concern is, however, their low volumetric density, or high surface area, which not only results in the low net volumetric energy density and significant side reactions with the electrolyte, but also requires a large amount of binder to prepare the electrod.12,13
By thermally reducing graphite oxide, Matsuo, one of the present authors, et al. have recently prepared reduced graphite oxide (r-GO) characterized by its relatively low surface area, for which the key is to hold the heating rate so slow that the graphene layers do not exfoliate.14–17 The charge and discharge potential profile of their r-GO has characteristics similar to recently reported graphene-based materials.17 Its reversible capacity, 580 mAh g−1,15,17 is much higher than the theoretical one of graphite (372 mAh g−1), if they are evaluated as negative electrode material for LIBs. This result indicates that the carbon layers in their r-GO display a high capacity rivaling the segregated graphene sheets while maintaining their highly regulated orientation of which the interlayer distance is close to that of graphite (0.34 nm). Naming their r-GO as "graphene-like graphite (GLG)," Cheng, Matsuo et al. have examined its structural characteristics and electrochemical properties to find that GLG had many nano-pores and showed superior input/output performance to graphite.18 Furthermore, GLG was synthesized at various temperatures of which impact on the structural changes of GLG that occur during lithium intercalation have been detailed.19
In this paper, we focused on GLG synthesized at 700 °C, of which the electrochemical properties are expected to be closest to graphene, and demonstrate that the excellent high input performances of the GLG allow us to rapidly and safely charge the electrode only with the constant voltage (C.V) mode. Usually, LIBs are galvanostatically charged to a certain voltage, constant current (C.C) mode, subserviently followed by C.V mode to fully charge the electrode.20,21 In order to quicken the charging, one has to increase the current during the C.C mode with carefully paying attention to the over potential. Typical LIBs using graphite as the negative electrode cannot be fully charged from a shallow charge state by the C.V mode alone because the uncontrollable intensive current leads lithium metal to depositing on the graphite surface, which in turn provokes a dire short circuit. We prove in the present study that GLG stands the C.V charging with a very high current that is unwieldly for graphite.
Experimental
Synthesis of GLG
We synthesized graphite oxide (GO) by oxidizing natural graphite (Z-5F, Ito Graphite) with KClO3 in fuming HNO3 for 3 h at 0 °C based on Brodie's method.22,23 The obtained GO was then stepwise heated; firstly, under a vacuum from room temperature to 170 °C at a heating rate of 1 °C min−1 and then to 250 °C at 0.1 °C min−1. Thereafter, the rate was changed to 1 °C min−1 until it reached 700 °C. The temperature was kept at 700 °C for 5 h, then naturally cooled. The obtained sample, referred to as GLG700, was used without any further treatment.
Electrode preparation and cell assembly
The GLG700 electrode was prepared by the following procedure. GLG700, acetylene black (Denka, Li-400), sodium carboxymethyl cellulose (DKS, WSA), and styrene-butadiene rubber (JSR, TRD2001) were homogeneously dispersed in deionized water with a weight ratio of 90:5:3:2 and obtained slurry was cast on a Cu-foil current collector. After drying and pressing, the electrode sheet was cut into 12-mm diameter disks for the electrochemical measurements. As a control experiment, the graphite electrode was also prepared by using water-based slurry of graphite (10–20 μm) by a similar procedure for the GLG700 electrode with the weight ratio of 95:3:1:1. The mass loading of active materials were ca. 1.5 and 2.6 mg cm−2 for the GLG700 and graphite electrodes, respectively, so that their first reversible capacities are comparable.
The GLG700 and graphite electrode half-cells were assembled with a lithium foil (Honjo Metal) of 13-mm diameter disk as the counter electrode, 1 mol dm−3 LiPF6 dissolved in ethylene carbonate (EC) and dimethyl carbonate (DMC) mixed solvent with volumetric ratio of 1:1 (Kishida chemical, LBG) as the electrolyte, and a highly porous polyolefin film coated with ceramic as the separator by using a two-electrode-type cells (EC frontier, SB-2A). The cells were assembled in an argon-filled glove box of which the dew point is below −70 °C to avoid side reactions with moisture. A freshly prepared cell was subjected to each electrochemical test, e.g., the C.V mode or C.C mode, unless otherwise stated.
Electrochemical measurement
In this paper, we refer to the lithiation process (i.e., the direction in which the cell voltage decreases) as "charge" and the delithiation process (i.e., the direction in which the cell voltage increases) as "discharge." Throughout the article, the current and the capacity are expressed in the units normalized by the mass of the active material in the GLG700 and graphite electrodes (A g−1, mAh g−1) or by their geometrical area (mA cm−2, mAh cm−2). All the electrochemical measurements were carried out electrochemical analyzer (Hokuto Denko, HZ-pro) or battery performance test system (KEISOKUKI center, BLS5700). To confirm the charge and discharge capacity at the first cycle, the GLG700 and graphite half-cells were charged to 0.01 V and then discharged to 2.00 and 1.50 V, respectively, with the C.C mode at the 0.25 C-rate, where the 1 C-rate corresponds to the current density of 600 and 372 mA g−1, respectively.
The half-cells prepared afresh were charged with an intensive current only by the C.V mode (hereafter referred to as the i-C.V mode) at 0 or −0.1 V. In this measurement the cut-off was set 75% of the capacity observed during the first charge process in the C.C test mentioned above (see Fig. 1) to avoid overcharge. The choice of 75% SOC is due to the difficulty in terminating the i-C.V charge to 100% SOC at −0.1 V vs Li/Li+, because a small error in charge quantity would lead to the overcharge, resulting in the Li deposition. The current and the capacity were recorded as a function of time, as in the potential step chronoamperometry or chronocoulometry, after that the drift in the open circuit voltage (OCV) was monitored.

Figure 1. First charge and discharge potential profiles of (a) GLG700 and (b) graphite electrode half-cells cycled with the C.C mode at the 0.25 C-rate, where the 1 C-rate corresponds to the current density of 600 and 372 mA g−1 for the GLG700 and graphite electrode, respectively. The GLG700 and graphite half-cells were charged to 0.01 V and then discharged to 2.00 and 1.50 V, respectively.
Download figure:
Standard image High-resolution imageThe cycle performances of the electrodes were examined in two ways; namely, one is the C.C cycles of which the conditions were the same as in the confirmation of the first charge and discharge capacity mentioned above, and the other is the i-C.V charge at 0 V until the current decreases to the one corresponding to the 1 C-rate followed by the C.C discharge at 0.25 C-rate to 2.00 V and 1.50 V for the GLG700 and graphite half-cells, respectively.
Scanning electron microscope (SEM) observation
To see if metallic lithium deposits on the electrode after the i-C.V charge at −0.1 V, the GLG700 and graphite electrodes were taken out of the cells just after the end of charge in the glove box. The electrodes were immersed carefully into about 5 mL of DMC, while avoiding the influence on the surface morphology to diffuse and remove the electrolyte components attached to them. The above procedure was repeated twice. The treated electrodes were dried under a vacuum for 2 h and transferred to the SEM (JEOL, JSM-IT100) chamber with avoiding the air exposure as much as possible. The surface of the electrodes was observed at magnifications of x500 or x2000. The acceleration voltage and the working distance are 15 kV and 10 mm, respectively.
X-ray diffraction (XRD) measurement
The change in the crystal structure of GLG 700 before and after charging was observed by using X-ray diffractometer (Spectris, X'Pert PRO MPD) with Mo Kα radiation. The GLG700 half-cells were charged to 0.01 V with the C.C mode at 0.25 C-rate or the i-C.V mode at 0 V until the current density decreased below the 1C-rate. After relaxing for 90 min, the GLG700 electrodes were taken out of the cells in the glove box, washed a few times with DMC and dried under a vacuum for 2 h. The electrodes were set on an air-tight sample stage. The diffraction angle ranges from 5 to 30° with a scan rate of 1° min−1.
Results and Discussion
Figure 1 shows the first C.C charge and discharge curves of (a) the GLG700 and (b) the graphite electrode half-cells. The charge capacities at first cycle of the GLG700 and the graphite are 1133 and 387 mAh g−1, respectively, in which one has to notice the irreversible capacity is involved stemming from the Li+ trapping in carbon structure and electrolyte decomposition, or the SEI film formation. The 75% of them, i.e., 850 and 290 mAh g−1, are used as the cut-off capacity for the i-C.V charge test in Fig. 2. The discharge capacities derived from delithiation (or the reversible capacity) of the GLG700 and the graphite are 533 and 341 mAh g−1, respectively, which translate into 0.80 and 0.89 mAh cm−2, respectively. Having approximate capacities per electrode area, we can quantitatively compare the input/output performance of the GLG700 and graphite electrodes with the i-C.V mode.
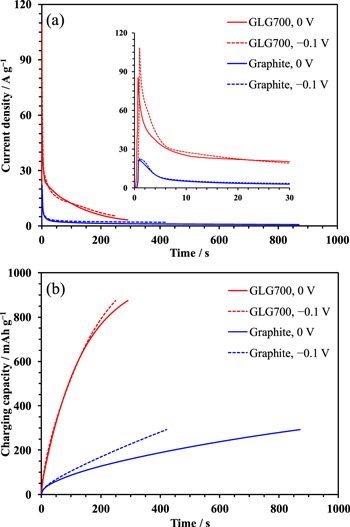
Figure 2. (a) Current density and (b) charging capacity vs time of the GLG700 and graphite half-cells during the first i-C.V charging at 0 or −0.1 V. The cut-off capacities are 75% of the respective charge capacity observed during the C.C mode shown in Fig. 1. The inset magnifies the current profile immediately after the charging started.
Download figure:
Standard image High-resolution imageFigure 2 shows (a) currents and (b) charging capacities vs time profiles (chronoamperogram and chronocoulogram) of the GLG700 and the graphite half-cells during first i-C.V charge at 0 or −0.1 V. The current densities of the GLG700 half-cells charged at 0 and −0.1 V reach 84 and 107 A g−1, respectively, which translate into 126 and 161 mA cm−2, immediately after the charging voltage was applied, which are 3–4 times greater than those of the graphite half-cells. Throughout the i-C.V process, the current density of the GLG700 electrode exceeds that of the graphite electrode, so that the former is much more quickly charged than the latter. When the charging voltage is shifted to −0.1 V, which corresponds to the GLG or the graphite electrode less negatively polarized than 0 V vs Li/Li+, the charging rate of the graphite half-cell increases twofold. However, the reactions taking place on the graphite electrode during the i-C.V charge at −0.1 V differ from those at 0 V, as suggested in the OCV drift after the charge in Fig. 3, in which the drift after the C.C charge was also shown for comparison. The point t = 0 corresponds to the end of the charge. If graphite is charged to 75%, it should be in a state between the Stage 1 (LiC6) and 2 (LiC12), of which the equilibrium potential is 90 mV vs Li/Li+.24 In fact, the OCV of the graphite half-cell stays at 90 mV without drifting if the cell is charged with the C.C mode. On the other hand, if the cell is charged with the i-C.V mode at −0.1 V, the OCV starts from a significantly lower voltage, 60 mV, implying the lithium metal deposition on the electrode.25 The stepwise OCV drift in the cells that were i-C.V-charged at 0 and −0.1 V indicates that the graphite electrode self-discharges from the state between Stage 1 and 2 to between Stage 2 and 3 or 4. The self-discharge, i.e., the oxidation and delithiation of graphite, is known to mainly occur as a charge compensation of the reductive decomposition of the electrolyte.26,27 The stepwise OCV drift suggests the incomplete SEI film formation on the graphite electrode when it charged rapidly with the i-C.V mode in the first cycle.27 One may suspect that the low (60 mV) OCV after charge should result from the incomplete SEI film formation because it is essential for the proper operation of the graphitic carbon electrodes in LIBs.28,29 However, as shown in Fig. S1 (available online at stacks.iop.org/JES/167/110518/mmedia), even if the graphite electrode was in advance cycled with the C.C mode, during which the SEI film should be sufficiently formed, the electrode ended up in an OCV lower than the conceivable equilibrium potential after the i-C.V charge, while the stepwise drift has been eliminated. On the other hand, regardless of the charging mode, i.e., whether the C.C, i-C.V at 0 V or at −0.1 V, the GLG700 electrode follows a similar trend. The greater OCV drift of GLG700 than graphite stems from the voltage relaxation towards the higher equilibrium potential of the former than the latter at 75% SOC. The trend suggests that the electrode can catch up with the rapid i-C.V charge to reach the state close to that attainable with a slow C.C charge.

Figure 3. OCV drift of (a) the GLG700 and (b) graphite half-cells after charged with the i-C.V mode at 0 or −0.1 V and with the C.C mode at 0.25 C-rate until their charge capacity reaches to 75% of the one observed during the first charge process in the C.C test (Fig. 1).
Download figure:
Standard image High-resolution imageFigure 4 shows SEM images of the GLG700 and graphite electrodes extracted from the half-cell just after charged with the i-C.V mode at −0.1 V. The deposits on the graphite electrode are clearly distinguishable from the graphite particles, which were even visible as white spots when disassembling the cell. The shape of the deposits appears to be lithium metal,30,31 suggesting that, together with the low OCV (60 mV, see Fig. 3b), the i-C.V charge at −0.1 V triggers the lithium metal deposition on the graphite electrode. On the other hand, no deposit is observed on the GLG700 electrode. The deposit-free GLG700 half-cell, of which the OCV is not influenced by the charging mode, suggests that the GLG700 electrode can tolerate a very rapid charging even at slightly below 0 V vs Li/Li+; however, other in situ or operando measurements may be needed to further substantiate that no lithium deposition occurs on the GLG700 electrode. Incidentally, charging the GLG700 half-cell with the i-C.V mode at −0.2 V resulted in the low OCV after the charge (shown in Fig. S2), like the graphite half-cell charged at −0.1 V, suggesting the lithium deposition, which implies that the limit in the potential of the i-C.V mode is about −0.1 V vs Li/Li+ even for GLG700.
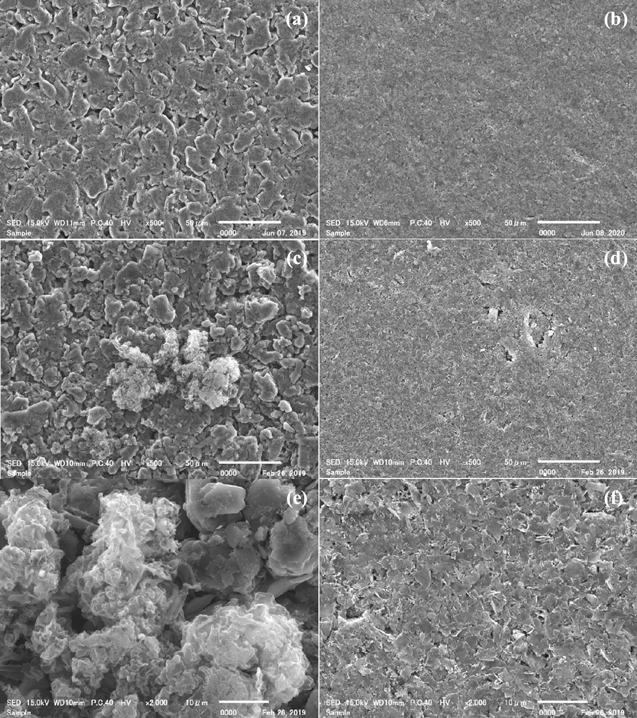
Figure 4 SEM images of the graphite (left) and GLG700 (right) electrodes as-prepared (a), (b) and extracted from the half-cells just after charged at −0.1 V (c)–(f). The bottom images are magnified views. The states of charge of each electrode is the same as that of the i-C.V charge test in Fig. 2.
Download figure:
Standard image High-resolution imageFigure 5 shows XRD patterns of the GLG700 electrodes as prepared and charged with the i-C.V or C.C mode, where the diffraction angle is converted to the value corresponding to the Cu Kα radiation from Mo Kα. The peak at 25.5°, corresponding to the lattice spacing 0.35 nm, of the as-prepared GLG700 electrode derives from the graphene layers, which is close to the (002) diffraction of graphite (0.34 nm). The peak shifts to around 18° after charging, which indicates that the graphene layer distance expands to 0.48 nm by Li+ insertion as previously reported [18]. Since the graphene layer distance in fully lithiated graphite (Stage 1; LiC6) is 0.37 nm, Li+ storage mechanism of GLG700 is considered essentially different from that of graphite. The peak position of the GLG700 electrode charged by the i-C.V mode coincides with that by the C.C mode, suggesting that GLG700 rapidly accommodates Li+ by the i-C.V charge through a similar structural change during the C.C charge.
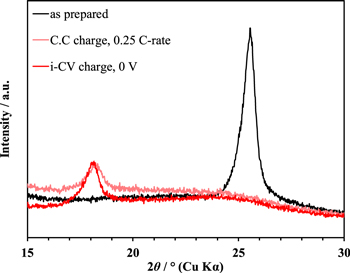
Figure 5. XRD patterns of the GLG700 electrodes as prepared and extracted from the half-cells charged with the i-C.V mode at 0 V or with the C.C mode at the 0.25 C-rate. The cut-off current and voltage are 1C-rate for the i-C.V charge and 0.01 V for the C.C charge, respectively.
Download figure:
Standard image High-resolution imageFigure 6 shows (a) cycle performances and (b) charging time of the graphite half-cells charged with the C.C mode at 0.25 C-rate or the i-C.V mode at 0 V. The i-C.V charge of the graphite electrode resulted in a significantly lower Coulombic efficiency (CE) during the first cycle than the C.C mode. The CE of the cell charged with the i-C.V mode never reached to that of the cell charged with the C.C mode during a few subsequent cycles. This may be due to the incomplete SEI film formation as mentioned above when discussing the OCV drift. When the first C.C cycle, during which the SEI is considered to be formed, is followed by the i-C.V cycle, its CE is understandably improved. The CE, however, does not reaches that of the C.C cycle during the subsequent cycles, implying that irreversible lithium deposition/dissolution on the graphite electrode may be taking place during the cycles with the i-C.V charge even at 0 V, which is not apparent in the OCV drift in Figs. 3 and S1. The time required for the i-C.V charging of the graphite half-cells is about 20 min on average and the discharge capacities are 280–310 mAh g−1, of which the discharge curves are compared to that of the C.C cycles (see Fig. S3), corresponding to charging 80%–90% of the capacity at the 3 C-rate. Consequently, the rapid charging of the graphite electrode would result in an unsatisfactory rate performance and only increase the risk of short-circuit by the lithium deposition.

Figure 6. (a) Cycle performance and (b) charging time of the graphite half-cells cycled with the C.C mode at 0.25 C-rate or the i-C.V charge at 0 V followed by the C.C discharge at 0.25 C-rate. The cut-off current and voltages are; 1C-rate for the i-C.V charge, 0.01 V for the C.C charge, and 1.50 V for the C.C discharge.
Download figure:
Standard image High-resolution imageFigure 7 shows (a) cycle performances and (b) charging time of the GLG700 half-cells charged with the C.C mode at 0.25 C-rate or the i-C.V mode at 0 V. Figures S5 and S6 show the OCV drift of the half-cell after fully charged during the first cycle by the i-C.V mode at 0 V, and SEM images of the GLG700 electrode taken out of the cell just after charging, respectively, where no stepwise drift and no dentdritic particle imply that the electrode is free from the lithium metal deposition. Despite the remarkably short period of the i-C.V charging, 3–6 min, the GLG700 electrode delivers the reversible capacity equal to that obtained by the C.C charging at 0.25 C-rate, which overwhelmingly excels in both the charging time and capacity over the high-rate charging in the C.C mode such as at the 10 C-rate (see Fig. S7). The discharge curves of the GLG700 half-cells charged with the i-C.V mode is are almost indistinguishable from that charged with the C.C mode (see Fig. S4). This result means that the i-C.V charge allows the GLG700 electrode to be fully charged within several minutes while maintaining high safety. The CE of the GLG700 half-cells is almost independent of the charging mode, whether the C.C or i-C.V mode, throughout the cycles. Although we cannot draw at present a clear picture about the mechanism, numerous nanopores on GLG700 may enable it to rapidly accept lithium ions. In addition, the fact that the CE is not influenced by the charging rate, unlike graphite, implies that the SEI film is formed quite differently in GLG from graphite, or alternatively that the stable reaction is achieved via other mechanisms than the SEI film.

Figure 7. (a) Cycle performance and (b) charging time of the GLG700 half-cells cycled with the C.C mode at 0.25 C-rate or the i-C.V charge at 0 V followed by C.C discharge at 0.25 C-rate. The cut-off conditions of the charge process is are the same as in Fig. 6 and the cut-off voltage of the discharge process is 2.00 V.
Download figure:
Standard image High-resolution image
Conclusions
We have proved that the negative electrode made of graphene-like graphite, GLG, can be extremely rapidly charged only by the constant voltage (i.e., potentiostatic) mode at 0 V or even at −0.1 V, during which the current momentarily exceeds 80 A g−1, allowing the electrode to be fully charged within several minutes. Despite the intensive current at the cell voltage below 0 V, no lithium deposition occurs on the GLG electrode. These features markedly contrast the graphite electrode, which cannot be charged with such an intensive current. The XRD patterns suggests that the GLG electrode rapidly accommodates Li+ without undergoing any structural deformation, leading to a stable cycle performance comparable to the graphite counterpart.
Although it is unlikely in a practical use of the LIBs that the negative electrode is intentionally polarized less negative than 0 V vs Li/Li+, the present study demonstrates that the GLG electrode warrants a wide safety margin even if the cell voltage accidentally dropped during the high rate charging. The practical use of GLG needs not only to increase the energy density, e.g., a higher capacity and a lower potential, but also to solve the irreversible capacity, which is presumably caused not by the SEI formation but by the lithium trap in GLG. A solution for the latter can be, for instance, the lithium pre-doping.32 Nonetheless, not only is the high-rate charging safely achievable by the outstanding input performance of the GLG electrode, but also its constant voltage operation facilitates the battery control, having a potential to pave a way to developing new LIBs. While GLG700 may allow us to rapidly charge the new LIBs, we also need a charging system that tolerates the intensive current.
So much for the battery performance. What remains unaddressed in the present study is the mechanism by which GLG rapidly and stably accommodate Li+. We are now investigating the reaction mechanism of GLG, of which the results will be publicized as our future task.
Acknowledgments
This work was supported by the Advanced Low Carbon Technology Research and Development Program (ALCA) of the Japan Science and Technology Agency.