
Abstract
Using 1,2-Acenaphthenedione as an example, cyclic voltammetry, chronoamperometry, coulometry, electrolysis and digital simulation were used to show that electroreduction of carbonyl compounds in the presence of nitromethane in 0.1 M Bu4NClO4/DMF proceeds via the ECE mechanism gives rise nitromethane anion initiating cyclic nitroaldol (Henry) process leading to β-nitroalcohols.
Export citation and abstract BibTeX RIS

This is an open access article distributed under the terms of the Creative Commons Attribution 4.0 License (CC BY, http://creativecommons.org/licenses/by/4.0/), which permits unrestricted reuse of the work in any medium, provided the original work is properly cited.
The electrochemical initiation of the Henry reaction generally occurs upon generation of a base,1–5 which protonation with nitromethane gives an anion that in turn initiates the cyclic reaction. At the same time, we are not aware of examples where radical anions or dianions of a carbonyl compound are used as a base, although the pKa of nitromethane (17.2) in polar aprotic solvents is close to the pKa of phenol (18.0),6 and examples of protonation of radical anions of aromatic compounds by the latter,7–11 including carbonyl derivatives,12 are available in literature. In this work, we made an attempt to use the radical anion formed upon electroreduction of 1,2-acenaphthylenedione (1) as the base in DMF solutions containing tetrabutylammonium perchlorate (reaction 1). Compound 1 (Scheme

Scheme 1. Structures and designations of compounds and intermediates studied.
Download figure:
Standard image High-resolution imageExperimental
Electroanalytical instrumentation, experimental techniques and reagents
Chronoamperometry (CA) and cyclic voltammetry (CV) were implemented on an IPC-Pro computer-assisted potentiostat manufactured by Econix (scan rate error 1.0%, potential setting ±0.25 mV). The experiments were performed in a 10-ml five-necked conic glass electrochemical cell with a water jacket for thermostatting. Polarization curves were recorded using the three-electrode scheme. All the electrodes were lab made. A disc glassy-carbon electrode was used as the working electrode. Electrode surface was polished with diamond powder (2 μm), which was dispersed in glycerin. The exact active area of the working electrode (equal to 2.0 mm2) was determined by simulation of the CV curves of ferrocene electro-oxidation using the known ferrocene diffusion coefficient in DMF.15
A platinum wire served as the auxiliary electrode. A saturated calomel electrode (SCE) was used as the reference electrode and was connected to the solution by a bridge with a porous ceramic diaphragm filled with the background electrolyte (0.1 M Bu4NClO4 solution in N,N-dimethylformamide (DMF)). The uncompensated resistance (Ru = 800 ± 12 Ω.) and active area of working electrode (equal 2.27 mm2) were determined by the procedure described earlier.16 Redox potential of ferrocene vs SCE in the conditions used was stable and equal +0.470 ± 0.005 V.
In a typical case, 5 ml of a solution was utilized. The solutions to be tested were thermostatted at 25 ± 0.5°С. Solutions were deaerated by passing argon before recording each CA and CV curves. To prevent contact between the solution surface and ambient air during the experiment, argon was continuously fed into the free cell space above the solution surface.
For CA and CV curve analyses, the current values in the presence of the substrate were corrected for the current of the background electrolyte at the given potential. The concentrations of 1 (C1) was varied from 2.5 to 10 mmol l–1 and concentrations of 2 (C2) from 4.5 to 72.0 mmol l–1. In the case of CV, the cathodic and anodic peak currents at the potential scan rates (v) of 0.025, 0.050, 0.100, 0.225, 0.400, 0.650, 1.000, 2.000, 3.000, and 5.000 V s–1 were used as the response functions. The sampled current voltammograms17 (a subtype of steady-state voltammograms18) were plotted using the values of the current from the CA curves at a transient time (t) of 2 s at the corresponding potentials.
Cathodic (i1c) and anodic (i1a) peak currents and cathodic (ic) currents at t equal 2 s were used as the response functions in the case of CV and double step CA respectively.
Compound 1 was purchased from Sigma-Aldrich and used without further purification. Compound 3 was obtained by method.1 Tetrabutylammonium perchlorate, DMF ("extra dry" grade) and 2 were supplied by Acros Organics.
Digital simulations
Digital simulations of the CA and CV curves were carried out using DigiElch Professional, version 8 F (Build 8.222), from ElchSoft. Computation of the model curves took the edge effect and uncompensated resistance into account. The rate constants were determined from CA and CV data using the procedure described previously16,19 that involved the variation of kinetic parameter λ20,21 equal λ = RTC1C2/Fv and λ = C1C2t in the case of CV and CA, respectively.
The diffusion coefficient D for 1 in DMF was taken to be 10−5cm2 s−1. It was based on the value which we found earlier for compounds of similar size.19,22
The use of the values enabled us to achieve a good agreement between the experimental and theoretical peak currents in the entire range of concentrations and potential scan rates studied. Electron transfer reaction 1 were considered to be fast and reversible. The values of the transfer coefficients (α) were taken to be 0.5. Proton transfer reactions considered to be fast. Default values of electron transfer constants (ks) equal 104 cm s−1 provided by the software to imitate Nernstian boundary conditions was used for simulation of the fast heterogeneous reactions. In case of homogeneous processes rate constants for fast reactions were taken to be equal average value of diffusion-controlled rate constants in DMF, 4 109 M−1 s−1.23 Formation of π-dimer24 was neglected as having no effect on the first peak parameters (see Ref. 17 in Ref. 24). Standard potentials (E0) as well as homogeneous rates and equilibrium constants magnitudes were determined by optimization using standard DigiElch Professional techniques to attain the best match of the model and the experimental curves over the ranges of potential scan rates and concentrations indicated above, followed by determination of the average values. The best agreement between the simulated and experimental response functions were obtained for the following set of simulation parameters: in the case of CV E01 = −0.735 V, K2 = 10−2, k2 = 25 M−1 s−1, K4 = 5·10−2, K5 = 5·103, k5 = 2.5·104 M−1 s−1, K6 = 5·10−2.
Results and Discussion
In order to prevent any possible competition with the reaction of 1− protonation with 2, the electroreduction process of 1 in the absence of 2 was studied by cyclic voltammetry and chronoamperometry.
The cyclic voltammograms of 1 in 0.1 M Bu4NClO4/DMF (Fig. 1) contain two cathodic peaks. By analogy with the electroreduction of other diones and quinones in aprotic environments,24–27 it may be assumed that the first peak corresponds to the formation of the 1·− radical anion, while the second one, to the dianion (12−). Indeed, the observed number of electrons (napp) calculated as the ratio of the current of the first cathodic peak (i1c) to the current of the diffusion process peak is constant over the entire studied range of 1 concentrations (C1) and the potential sweep rates (v) and equals 1.01 ± 0.04. The ratio of the cathodic (ic1) and anodic (ia1) peak currents corresponding to the transfer of the first electron, ia1/ic1 = 0.75 ± 0.03, is close to the theoretical value of 0.79 for the diffusion process.
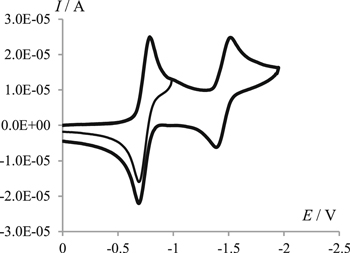
Figure 1. Cyclic voltammograms of 4.5 mmol l−1 of 1 in 0.1 M Bu4NClO4/DMF at a potential scan rate of 0.1 V s−1.
Download figure:
Standard image High-resolution imageThe one-electron nature of the process and its chemical reversibility are supported by the results of chronoamperometric studies. As one can see from the figure (Fig. 2), the experimental currents at the potentials of the limiting current on the current-voltage curve (Fig. 2, curve 1) coincide with the theoretical values for a diffusion-controlled one-electron process.
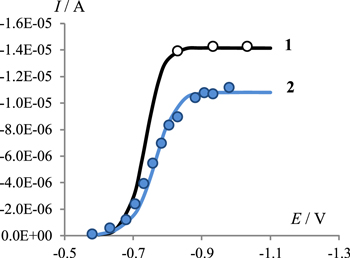
Figure 2. Currents on CA curves (in 2 s after applying an impulse) for in 0.1 M Bu4NClO4/DMF containing 5 mmol l−1 1 (empty circles) and mixture of 5 mmol l−1 1 and 10 mmol l−1 2 (filled circles). Simulated curves for one electron diffusion controlled process and (2) for mechanism (1–6). Simulation parameters used for calculations of theoretical curves are given in the Experimental section.
Download figure:
Standard image High-resolution imageThus, the electroreduction of 1 under these conditions is not complicated, neither by ECE type processes nor by EC processes.
Addition of 2 to a solution of 1 is accompanied by a decrease in the currents of both the cathodic and anodic peaks corresponding to the formation of 1·− and by the appearance of a new peak (ic2), (Fig. 3, curve 2) whose potential coincides with the potential of 2-hydroxy-2-(nitromethyl)acenaphthylen-1(2H)-one (3) (Fig. 3, curve 3).
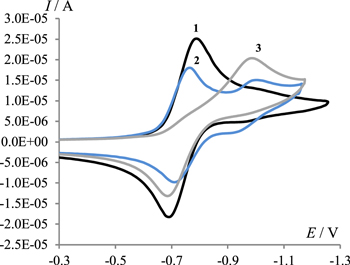
Figure 3. Cyclic voltammograms at a potential scan rate of 0.1 V s−1 in 0.1 M Bu4NClO4/DMF solutions of (1) 4.5 mmol l−1 of 1, (2) mixture of 4.5 mmol l−1 of 1 and 9 mmol l−1 of 2, (3) 4.5 mmol l−1 of 3.
Download figure:
Standard image High-resolution imageSince, as noted above, the formation of 3 by the Henry reaction is observed in solutions containing 1, 2 and a base,1,3,4,14 it can be assumed that during the electroreduction of 1 in the presence of 2, the role of the base is played by 1·−, while anion 2− is generated in an ECEC process (reactions 1, 2, 3, 3a, 4). Indeed, as one can see from the figure (Fig. 4), the decrease in the ia1/ic1 ratio with an increase in the concentrations of 1 and 2 and a decrease in v is in line with the expectations for an ECEC process.
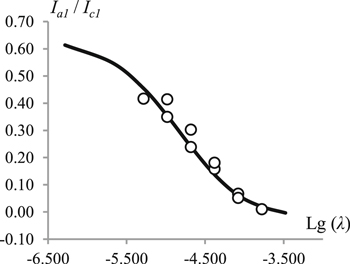
Figure 4. Experimental (circles) and simulated for mechanism 1–4 (line) dependences of the ratio of anodic and cathodic peak currents on operational parameter λ. For simulation parameters see section Digital simulations.
Download figure:
Standard image High-resolution imageThe decrease in the absolute values of the currents ic1 and ia1 may result from a decrease in the near-electrode concentration of 1 due to Henry reaction (reaction 5). This assumption is confirmed by the fact that, as one can see from the figure (Fig. 5), the decrease in the current of the reduction peak of 1 and the increase in the current of the peak of 3 reduction occur simultaneously. It should also be noted that along with reactions 2 and 4, the reaction of 3− protonation (reaction 6) is an additional source of the 2− anion.


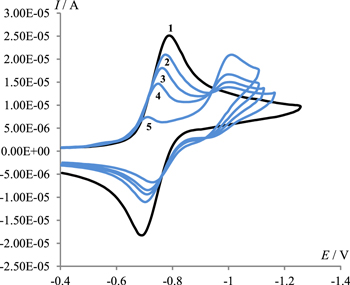
Figure 5. Cyclic voltammograms at a potential scan rate of 0.1 V s−1 in 0.1 M Bu4NClO4/DMF solutions of 4.5 mmol l−1 of 1, containing 0 (1), 4.5 (2), 9 (3), 18 (4), 36 (5) and 72 mmol (6) l−1 of 2.
Download figure:
Standard image High-resolution imageIf the electroreduction of 1 in the presence of 2 occurs by a mechanism involving reactions 1–6, the value of ic1 and hence napp should depend on the reagent concentrations and the potential sweep rate. Indeed, the value of napp decreases with an increase in kinetic parameter  (Fig. 6).
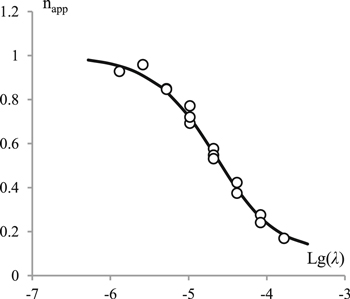
Figure 6. Experimental (circles) and simulated for mechanism 1–6 (line) dependences of the apparent number of electrons on operational parameter λ. For simulation parameters see section Digital simulations.
Download figure:
Standard image High-resolution imageComparison of cyclic voltammetry data (Figs. 4, 6 and 7) and chronoamperometry data (Fig. 2) with the simulation results allows us to assume that the electroreduction of 1 under these conditions occurs by the mechanism involving reactions 1−6.
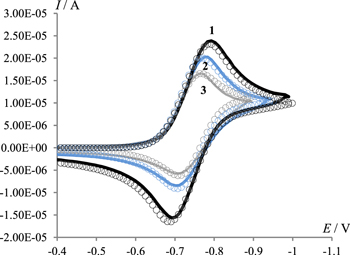
Figure 7. Cyclic voltammograms at a potential scan rate of 0.1 V s−1 in 0.1 M Bu4NClO4/DMF solutions of 4.5 mmol l−1 of 1, containing 0 (1), 4.5 (2), 9 (3) mmol l−1 of 2 (line) in comparison with the theoretical curve (circles). For simulation parameters see section Digital simulations.
Download figure:
Standard image High-resolution image
Conclusions
The results obtained show that the 1,2-Acenaphthenedione radical anion generated electrochemically in an aprotic medium is sufficiently basic to deprotonate nitromethane, while the resulting nitromethane anion initiates the cyclic Henry reaction. Thus, the Henry reaction can be performed by electroreduction of solutions containing only a carbonyl compound and nitromethane, even in cases where protonation of the anion radical of the carbonyl compound is a relatively slow process. The advantage of this reaction variant is that starting catholyte contains only two reagents: carbonyl compound and nitromethane.