
Abstract
Aqueous corrosion, atmospheric corrosion, and ionic liquid dissolution studies were performed on commercial alloys AZ31B, AM60, and AZ91D and compared with previously reported results for single-phase binary Mg–Al alloys containing similar Al concentrations (αMg-2 at% Al, αMg-5 at% Al, and Mg-8 at% Al). Polarization studies in 0.6 M NaCl were used to characterize the aqueous free corrosion behavior during 20-h free immersion. Accelerated corrosion testing was performed using a rotating-disk electrode which revealed the evolution of an Al-rich mud-cracking and platelet morphology. Atmospheric droplet testing showed rapid pH increases that depended on the Al concentration in the alloy. Time-dependent contact angle measurements showed that the degree of droplet wetting increased during free corrosion by ∼50° over 20 h in 0.6 M NaCl. Ionic liquid dissolution studies in 1:2 M choline chloride:urea deep eutectic solvent were performed in order to examine the current-voltage behavior of these alloys in the absence of water and hydrogen reduction. The results of these studies revealed the formation of nanowire corrosion morphologies within a honeycomb lattice structure which we attribute to selective dissolution of Mg via a two-dimensional step-flow process.
Export citation and abstract BibTeX RIS

This is an open access article distributed under the terms of the Creative Commons Attribution 4.0 License (CC BY, http://creativecommons.org/licenses/by/4.0/), which permits unrestricted reuse of the work in any medium, provided the original work is properly cited.
Magnesium is a material of interest for many industries, such as aerospace, automotive, and biomedical, due to its range of desirable structural material properties including high abundancy, high strength-to-weight ratio, biocompatibility, and low density.1–3 Industrial implementation has remained limited, however, due to the corrosion susceptibility introduced by magnesium's high electrochemical activity4 and propensity towards secondary phase formation in alloys.5 While the use of coatings,6–8 alloying agents, and processing methods2,3,9–22 may delay or impede corrosion attack, a more complete understanding of the complexities of the behavior of magnesium alloys in aqueous and atmospheric environment is required to develop new corrosion-resistant magnesium alloys.
Recent work by our group has examined the dissolution behavior of single-phase Mg–Al alloys (2–8 at% Al) in both aqueous and ionic liquid electrolytes.23 Henceforth, in discussing the behavior of single phase Mg–Al alloys, we will be referring to this previous work.23 The use of single-phase alloys eliminates multi-phase galvanic coupling effects that are present in the typical commercial alloy systems, which often contain small amounts of Mn and Zn in addition to Al. While aqueous corrosion of Mg has been extensively studied, the use of ionic liquid electrolytes allows for the study of Mg dissolution in absence of water. This eliminates the reactions associated with hydrogen evolution, which can be a large fraction of the Mg dissolution current during anodic polarization.1–3
Aqueous corrosion studies of single-phase Mg–Al alloys showed significant corrosion potential, morphology, pH, and contact angle changes during free immersion in NaCl solution. While aqueous static studies produced typical polarization behavior and mud-cracking morphology consistent with previous results reported in the literature,2,3,24 accelerated corrosion experiments with a rotating electrode measured significant surface enrichment of Al compared with experiments performed under static, non-rotating conditions. Localized surface atmospheric testing using droplets applied to the surface showed that increasing Al concentration generally slowed the rate of pH increase and contact angle decrease over time.
Linear sweep voltammetry and potentiostatic dissolution were used to observe Mg dissolution and morphology evolution in binary Mg–Al alloys in absence of water in an ionic liquid under an inert atmosphere. Linear sweep voltammetry measured similar maximum current densities for pure Mg and Mg–Al alloys, although the potential at which the maximum current density occurred varied, depending on the Al concentration and presence of secondary phases (i.e. Mg-8 at% Al). Potentiostatic dissolution in single-phase Mg–Al alloys revealed a mud-cracking morphology for low Al concentration (i.e. 2 at%). For higher concentrations of Al, a self-organized honeycomb-like network of fiber bundles was formed within the grains, which we attribute to a step-flow dissolution mechanism. Significant Al enrichment was measured in both morphologies.
In continuation of this work, we have examined the effects of alloying and secondary phases on Mg dissolution behavior using a combination of aqueous, atmospheric droplet, and ionic liquid testing on commercial alloys AZ31B, AM60, and AZ91D. These commercial alloys were selected based on similar Al concentrations to the previously studied single-phase binary Mg–Al alloys (αMg-2 at% Al, αMg-5 at% Al, and Mg-8 at%Al). We report our results, which include mud-cracking, platelet, and nanowire morphology evolution, and compare them with those observed in single-phase binary Mg–Al alloys with similar Al concentrations.
Experimental Methods
Alloy synthesis and characterization
Synthetic alloys used to examine galvanic effects were produced using photolithography techniques, which have been outlined in greater detail in our previous work.23 The photolithographic mask pattern (Chrome/Quartz, Photo Sciences) was designed to produce 5% areal coverage of Al. The mask was used during photoresist development to reveal 7.3 μm diameter holes of exposed substrate located on the corners and edges of a 50 μm square lattice. The newly exposed areas were sputtered for 1 min under vacuum using an ultra-high purity Ar plasma to remove any residue and oxide followed by a 100 nm Al layer deposited on a α-Mg-5%Al substrate, hereinafter referred to as "synthetic AZ91D". To preserve the surface patterning, no additional sample preparation prior to experimentation was performed on synthetic alloys.
Electrical discharge machining (EDM) was used to cut cylindrical samples (5 mm diameter) of commercial alloys—AZ31B (Magnesium Elektron), AM60B (nanoMag), and AZ91D (US Magnesium)—and component phases elemental Mg (99.95%, Alfa Aesar), β-phase Mg (Mg17Al12), and elemental Al (99.9999%, Goodfellows).
For corrosion testing, commercial alloy samples were prepared by polishing the surface to 1200 grit using silicon carbide paper and ethanol lubricant, followed by ethanol rinse and drying under nitrogen gas flow.
Samples were characterized using X-ray diffraction (XRD), scanning electron microscopy (SEM), and energy dispersive X-ray spectroscopy (EDS). For characterization, samples were polished to a mirror finish using a silicon carbide paper down to 1200 grit, followed by a series of oil-based diamond slurries down to 0.5 μm particle size. After polishing, samples were rinsed with ethanol and dried under nitrogen flow. For enhanced imaging, an acetic picral etchant was then used to selectively attack grain boundaries and secondary phases on the alloy surface.25 Compositions of all alloys and component phases were confirmed using XRD. Secondary confirmation of the alloy compositions was performed using energy dispersive EDS.
Aqueous free corrosion
Kapton tape was used to encase samples with a copper tape backing, providing an extended electrical connection while maintaining an exposed surface area of 0.124 cm2. Samples were immersed in 30 ml 0.6 M NaCl.
Linear sweep voltammetry
Linear sweep voltammetry (LSV) was performed from −0.1 to 1 V vs the initial open circuit potential at a sweep rate 10 mV s−1. A Ag+/AgCl reference electrode and Pt mesh counter electrode were used in the cell.
Accelerated aqueous corrosion
Accelerated corrosion experiments were also performed in a rotating disk electrode (RDE) configuration in 30 ml 0.6 M NaCl at 1600 rpm using a Pine RDE710 Rotator (0.196 cm2 exposed area). Samples were then soaked in ultra-pure water for 20 min to remove excess corrosion product and chloride buildup and left to air dry overnight in a desiccator.
Atmospheric corrosion
Atmospheric corrosion can be simulated by the application of solution droplets to a sample surface.26 In a series of experiments the pH of a droplet (<1 ml) on sample surfaces was observed using a universal dye-indicator in ultrapure water. The dye-indicator solution was synthesized via dye extraction from universal pH strips (Advantec) using a procedure similar to that outlined by Hiromoto.6 A drop of universal dye-indicator solution was then placed on a prepared sample surface and images were taken using a Nikon D3200 camera with lens extension tube set.
Contact angle measurements were performed on samples following aqueous free corrosion, where samples were immersed in 30 ml 0.6 M NaCl for variable duration, rinsed with ultrapure water, and left to air dry overnight in a desiccator. A 5 μl drop of 0.6 M NaCl was then placed on the dried sample surface and imaged immediately using a Nikon D3200 camera with lens extension tube set. The contact angle was then analyzed using ImageJ software.
Ionic liquid dissolution
Alloy samples were encased in Kapton tape with copper tape backing, providing an extended electrical connection while ensuring an exposed surface area of 0.124 cm2. Mg dissolution was examined in 15 ml of a 1:2 molar ratio choline-chloride:urea (CC-urea) at 150 °C in an argon glove box. LSV was performed from −0.6 V to +0.6 V (vs Al3+/Al) at 10 mV s−1 using an Al wire as a quasi-reference electrode and a Pt mesh counter electrode. Following dissolution, the CC-urea was rinsed from the surface using 1.0 M propylene carbonate heated to 150 °C, followed by rinsing in acetonitrile.
Results
The as-received compositional analysis of the three commercial alloys is summarized in Table I. Initial sample characterization was performed using a combination of XRD and SEM. XRD spectra of the three commercial alloys are shown in Fig. 1. The reference lines confirm α-phase Mg–Al in all three alloys with significant β-phase and small quantities of MnAl3 in AZ91D. AM60 shows a moderate amount of β-phase with a small amount of MnAl3. AZ31B shows no signal for β-phase and MnAl3. SEM imaging confirms the presence of secondary phases and/or intermetallic particles in all three alloys (Fig. 2). As expected, the volume fraction of these secondary phases increases with increasing Al concentration. The AZ31B sample contained small intermetallic particles randomly dispersed throughout the ∼5 μm grain size matrix (Figs. 2a–2c). AM60 showed ∼3 μm grain size with β-phase (Mg17Al12) precipitation near the grain boundaries (Figs. 2d–2f). AZ91D contained larger ∼110 μm grains with β-phase precipitates at the grain boundaries accompanied by the presence of a distinct eutectic region connecting the α- and β-phases (Figs. 2g–2i). Using EDS (Fig. 3), ∼34 at% variation in the Al concentration was measured from the β-phase rich grain boundary (∼38 at% Al) to the α-phase rich grain center (∼4 at% Al).
Table I. Composition analysis of commercial alloys.
| Alloy | Composition (at%) | ||||||||||
|---|---|---|---|---|---|---|---|---|---|---|---|
| Mg | Al | Cu | Fe | Ni | Zn | Mn | Si | Be | Sn | Pb | |
| AZ31B | 96.73 | 2.70 | 0.019 | 0.002 | 0.002 | 0.373 | 0.088 | 0.087 | 0.0000 | 0.0000 | 0.0000 |
| AM60 | 94.25 | 5.39 | 0.004 | 0.002 | 0.001 | 0.082 | 0.185 | 0.087 | 0.0019 | 0.0000 | 0.0000 |
| AZ91D | 90.72 | 8.77 | 0.011 | 0.002 | 0.001 | 0.255 | 0.147 | 0.087 | 0.0038 | 0.0021 | 0.0012 |
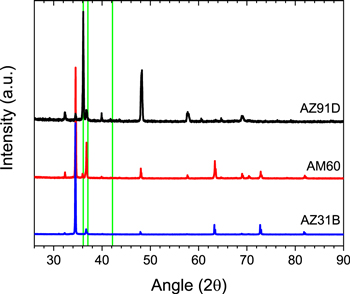
Figure 1. XRD patterns for commercial alloys AZ31B, AM60 and AZ91D. Reference lines (green) are provided for Mg17Al12 (36.113°), Al10Mg90 (37.073°), and MnAl3 (42.158°).
Download figure:
Standard image High-resolution image
Figure 2. SEM microstructural characterization of untreated commercial alloys at various magnifications for (a)–(c) AZ31B, (d)–(f) AM60, and (g)–(i) AZ91D. Bright regions indicate secondary phases and/or intermetallic particles.
Download figure:
Standard image High-resolution image
Figure 3. Distribution of Al concentration within a AZ91D grain. The Mg17Al12 β-phase is proximal to the grain boundary, a solid solution α-phase 4–8 at% Al is located inside the grain, and between the two phases exists a eutectic region consisting of both α- and β-phase.
Download figure:
Standard image High-resolution imageCorrosion behavior was characterized using polarization studies for synthetic and commercial alloys, along with component phases, shown in Fig. 4. The polarization results show positive corrosion potential shift, ΔEcorr, in commercial alloys and component phases during 20-h free immersion in 0.6 M NaCl, with the exception of AM60, which shows near negligible change. These results are consistent with those reported in the literature2 and are summarized in Table II. The measured Ecorr of commercial alloys unsurprisingly fall between those of elemental Mg and Al. Regarding synthetic AZ91D, while the initial Ecorr was nearly identical to commercial AZ91D, the synthetic alloy did not follow commercial AZ91D corrosion behavior during long-term free corrosion. While the commercial AZ91D alloy Ecorr shifted by +0.42 V over 20 h, synthetic AZ91D showed little change—only +0.02 V. The Al islands on synthetic AZ91D remained intact and were not undercut during the free corrosion time period, indicating surface composition stability not seen in the commercial AZ91D.

Figure 4. Shift in corrosion potential (vs Ag+/AgCl) for (a) synthetic AZ91D, (b) commercial alloys, and (c) component phases following free corrosion in 0.6 M NaCl. Solid lines indicate polarization results after 1 min while dotted lines indicate polarization results after 20 h. LSV was performed from a lower limit −0.1 V (vs OCP) to an upper limit of 1 V (vs OCP) at 10 mV s−1.
Download figure:
Standard image High-resolution imageTable II. Summary of corrosion potential shifts (vs Ag+/AgCl) for synthetic AZ91D, component phases, and commercial alloys during 20 h free immersion in 0.6 M NaCl.
| Ecorr (V.vs Ag+/AgCl) in 0.6 M NaCl | |||
|---|---|---|---|
| SAMPLE | 1 min | 20 h | Δ Ecorr |
| Synthetic AZ91D | −1.51 | −1.49 | 0.02 |
| AZ31B | −1.44 | −1.22 | 0.22 |
| AM60 | −1.55 | −1.56 | −0.01 |
| AZ91D | −1.53 | −1.11 | 0.42 |
| Al | −0.86 | −0.66 | 0.20 |
| β-Mg | −1.38 | −1.13 | 0.25 |
| Mg | −1.56 | −1.46 | 0.10 |
Accelerated free corrosion conditions were achieved using an RDE system to increase the concentration gradient in the electrolyte immediately adjacent to the electrode surface by minimizing the extent of the diffusion boundary layer, increasing liquid-phase transport. The diffusion boundary layer thickness is related to the rotation speed by Eq. 127:

where δ is the boundary layer thickness (cm),  is the diffusion constant (1 × 10⁻⁵ cm2 s−1), ω is the angular frequency (rad s−1), and υ is the kinematic velocity (1.01 × 10⁻² cm2 s−1). For a 1600 rpm rotation speed, the diffusion boundary layer thickness is ∼12 μm.
Figure 5 shows post-mortem SEM imaging of commercial alloy samples freely corroded at 1600 rpm in 0.6 M NaCl. Platelet or "cracked mud" morphology is observed on all three alloys. This morphology is easily observed in AZ31B (Fig. 5a) and AZ91D (Fig. 5e) at low magnification. In AM60 smooth regions surrounded by deep cracked edges are formed (Fig. 5c). At higher magnification, however, it becomes apparent that these smooth regions are actually composed of a smaller-scale "cracked mud" morphology (Fig. 5d). Similar morphologies are reported in the literature for commercial Mg–Al alloys treated under static aqueous and atmospheric conditions and are attributed to the corrosion process itself.3

Figure 5. Post-mortem SEM images of commercial alloys following accelerated free-corrosion at 1600 rpm in 0.6 M NaCl. (a), (b) AZ31B, (c), (d) AM60, and (e), (f) AZ91D. Higher magnification images (right panel) includes EDS data of the overall Al composition (at%) normalized to the Al + Mg composition indicated at top right (black). The Al composition normalized to Al + Mg is also indicated for platelets (blue) and the exposed substrate (red). Note in the case of AM60 the absence of exposed substrate compositions due to the lack of a clearly exposed substrate area.
Download figure:
Standard image High-resolution imageTo evaluate the pH evolution at the surface during the static free corrosion process, a standard glass electrode was placed near a 0.124 cm2 exposed surface area and monitored for 20 h duration (Fig. 6). After less than 2 h of immersion, Mg reached a peak ∼9.5 pH followed by slow decay to ∼8.75 pH during the remaining observation period. Commercial alloys AZ31B, AM60 and AZ91D also showed rapid pH increases during the first 2–3 h of immersion to ∼9 pH (AM60 and AZ91D) and ∼8.5 pH (AZ31B), followed by slow elevation to ∼9 pH (AZ31B and AM60) and ∼9.5 pH (AZ91D). Note that these results are influenced by convection due to hydrogen evolution.

Figure 6. pH monitoring of Mg (black), Al (blue), AZ31B (magenta), AM60 (green), and AZ91D (red) in 30 ml 0.6 M NaCl using a standard glass electrode over 20 h.
Download figure:
Standard image High-resolution imageA closer examination of pH evolution under atmospheric conditions—occurrence within a drop on the surface—was completed using a universal dye indicator in ultrapure water. Our initial attempts at this using a universal dye indicator in 0.6 M NaCl revealed virtually instantaneous pH increases, preventing time-dependent measurement. As seen in Fig. 7, the general trend is that stabilization time at pH 10–11 within the droplet increases with increasing Al concentration. Due to the stability of Al2O3 at neutral pH,4 elemental Al experiences no pH change, as expected.

Figure 7. Atmospheric corrosion test showing the pH evolution of a drop of ultra pure water. (a) Elemental Mg, (b) AZ31B, (c) AM60, (d) AZ91D. The numbers in (a)–(e) in the top left corner correspond to the elapsed time in seconds. (f) Reference color scale for pH.
Download figure:
Standard image High-resolution imageContact angle evolution was measured as a function of corrosion time for elemental Mg, elemental Al, AZ31B, AM60, and AZ91D (Fig. 8). Contact angles decreased from initial angle ∼70° to ∼15° following 20 h corrosion duration (Fig. 8c). Due to the high activity of the alloys in presence of 0.6 M NaCl, the surface experiences significant surface roughening and compositional changes during the free corrosion process. This results in increased wetting for surfaces with initial tendencies toward wetting (contact angle ≤90°).28,29
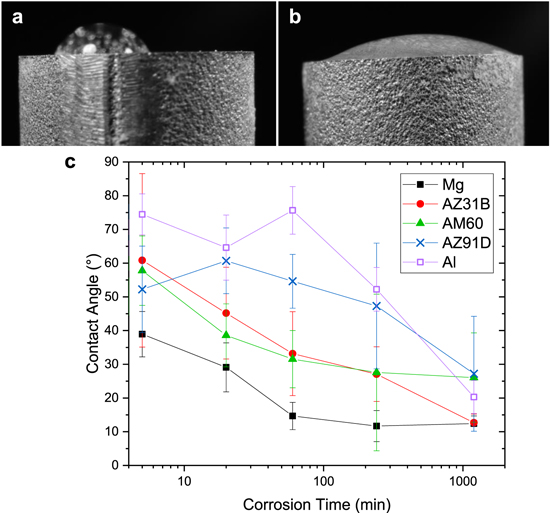
Figure 8. Contact angle images of 0.6 M NaCl on AZ91D (a) un-corroded and (b) following 20 h aqueous corrosion in 0.6 M NaCl. (c) Contact angle evolution of elemental Mg (black filled square), AZ31B (red circle), AM60 (green triangle), AZ91D (blue X), and elemental Al (purple open square). Error bars indicate standard deviation of four samples.
Download figure:
Standard image High-resolution imageTo observe dissolution behavior in absence of hydrogen evolution from water reduction, experiments were performed in ionic liquid electrolyte under an argon gas environment using an Al wire quasi-reference electrode and Pt mesh counter electrode. The LSV behavior is shown in Fig. 9. Elemental Al maintained cathodic current values within the scanned potential window (Fig. 9a). LSV of the three commercial alloys showed a rapid increase to a broad peak anodic current density. Maximum current densities of ∼9 mA cm−2 were measured in AZ31B and AZ91D at −300 mV and −220 mV, respectively. Note that these current densities are significantly higher than elemental Mg (∼3.4 mA cm−2 at 200 mV). Only AM60 showed significantly lower anodic current densities measuring from 0–175 μA cm−2.

Figure 9. Ionic liquid dissolution of binary-phase alloys and elemental components in 150 °C CC-urea. (a) LSV for 99.999% Al, (b) 99.95% Mg (black), AZ31B (blue), AM60 (red), and AZ91D (green). LSV was performed from a lower limit −0.6 V to upper limit 0.6 V (vs Al3+/Al) at 10 mV s−1.
Download figure:
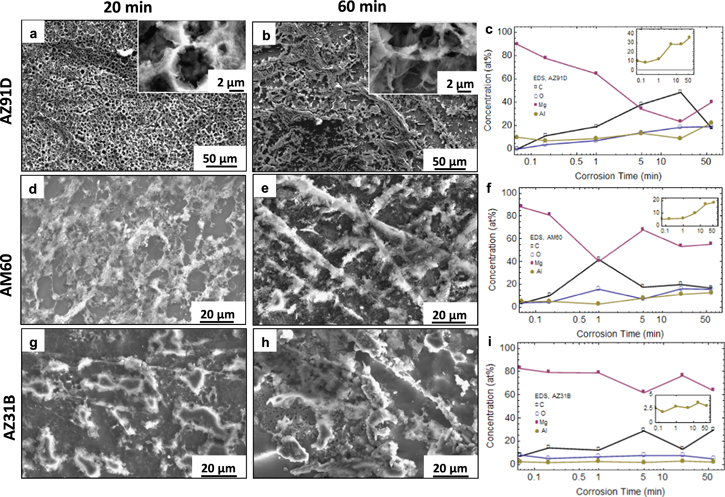
Standard image High-resolution imageSEM imaging of commercial alloys following 20 min (Figs. 10a, 10d, 10g) and 60 min (Fig. b, e, h) potentiostatic dissolution at −220 mV in the ionic liquid showed irregular surface morphologies for AZ31B and AM60 while AZ91D is characterized by a more uniform web-like morphology with ∼5 μm pit diameter. While this web-like morphology is somewhat observable in AM60, the pit diameter is highly irregular with a range of ∼2–15 μm (Fig. 10d). AZ31B forms ∼15 μm diameter islands with some pit evolution on the surface, although the island coverage is poor, leaving a high area of exposed substrate. EDS measured no significant Al enrichment in AZ31B while AM60 and AZ91D both show Al enrichment up to 20 at% Al and 40 at% Al, respectively (Figs. 10 c, 10f, 10i).
Figure 10. SEM images of commercial alloy surface morphologies following potentiostatic dissolution in CC-urea for the indicated times at −220 mV vs an Al quasi-reference electrode. Top panel: AZ91D, for (a) 20 min, (b) 60 min; Middle panel: AM60, (d) 20 min, (e) 60 min; Bottom panel: AZ31B, (g) 20 min, (h) 60 min. The corresponding insets show higher magnification images. Plots (c), (f), and (i) are the corresponding EDS compositional data with insets showing the Al concentration normalized to Al + Mg. The EDS compositional data is only included to show trends in the Al concentration with time.
Download figure:
Standard image High-resolution image
Discussion
For the following discussion, we compare our results for commercial alloys with our previously reported results for binary Mg–Al alloys with similar Al concentration—AZ31B vs αMg-2 at% Al, AM60 vs αMg-5 at% Al, and AZ91D with Mg-8 at% Al.23
During aqueous polarization studies, the initial Ecorr of all three commercial alloys were more positive compared with their binary Mg–Al counterparts, although the difference between the measured Ecorr of commercial alloys and their binary Mg–Al alloy counterparts decreased with increasing Al concentration; AZ31B measured +18 mV vs αMg-2 at% Al, AM60 measured +8 mV vs αMg-5 at% Al, and AZ91D measured +6 mV vs Mg-8 at% Al. The long-term Ecorr behavior of the commercial and binary alloys is different. For the commercial alloys, the largest ΔEcorr is measured in AZ91D and the smallest in AM60 (Table II). Focusing on the Al concentrations, the opposite trend is seen in the binary alloys, where the lowest ΔEcorr is measured in Mg-8 at% Al and the highest is measured in αMg-2 at% Al. In fact, the Mg-8 at% Al alloy behavior most closely aligns with the synthetic AZ91D sample in both measured Ecorr values and long-term stability. The Al islands galvanically coupled with the αMg-5 at% Al substrate mimic the presence of β-phase precipitates within the Mg-8 at% Al alloy.
The differences in Ecorr behavior between the commercial and synthetic alloys may be attributed to the presence of alloying agents and impurities, especially Zn, which has a much more noble standard potential of −0.76 V vs SHE compared with Al (−1.66 V vs SHE) and Mg (−2.37 V vs SHE). The AZ31B and AZ91D samples contain 0.373 and 0.255 at% Zn, respectively, while AM60 only contains 0.082 at%. AZ91D, which contains both Zn (0.255 at% Zn) and β-phase precipitates, shows the largest Ecorr shift (Δ Ecorr = 0.42 V). AZ31B, which contains more Zn than AZ91D (0.373 at%), but no β-phase, shows the second largest Δ Ecorr (0.22 V). AM60 contains some β-phase with very little Zn (0.082 at%) and shows very little Ecorr shift (Δ Ecorr = −0.02 V), similar to the behavior seen in synthetic AZ91D and Mg-8 at% Al.
In the case of accelerated rotating electrode corrosion studies, the AZ31B morphology is consistent with that seen in αMg-2 at% Al, although the platelets appear smaller and more uniform in size with larger spacing between each platelet in AZ31B. The normalized Al to Al+Mg concentration measured in both samples using EDS is ∼ 28 at%. The αMg-5 at% Al morphology aligns more closely with AZ91D compared with AM60, although the coverage in AZ91D is much more uniform with significantly less exposed substrate. This is likely the cause of the significantly increased Al enrichment measured in AZ91D (30 at% Al) compared with αMg-5 at% Al (7 at% Al). In all four of these samples, the localized platelet Al concentration is similar (∼30 at% Al). These concentrations are consistent with literature studies of oxide and corrosion product layers produced by commercial Mg–Al alloys in static aqueous or atmospheric conditions where additions of over 4 at% Al resulted in 35 at% Al enrichment, independent of the starting Al concentration.3,30–32 The discrepancy between our results and the reported value (30 at% Al compared with 35 at% Al) can be attributed to the differences in measurement technique—EDS, a bulk measurement, compared with surface techniques (i.e. XPS, HR-AES). The smaller grain sizes of the commercial alloys (5–110 μm compared with 400 μm in the binary alloys) seems to promote greater uniformity of the mud-cracked morphology, with the platelet concentration being independent of the alloy Al concentration. This uniformity improves the robustness of the layer, as the large areas of exposed substrate in the αMg-5 at% Al are likely due to platelets falling away from the more fragile, less uniform surface.
Regarding atmospheric droplet corrosion tests, the results are in general agreement between commercial and binary Mg–Al alloys, although some differences are observed during large volume pH monitoring. None of the commercial alloys produced a maximum pH higher than elemental Mg, with AZ31B showing slowed pH evolution compared with AM60 and AZ91D. Analogous results on the binary Mg–Al alloys showed slower pH evolution with increasing Al concentration, with Mg-8 at%Al being the slowest and showing the closest resemblance to AZ31B, the commercial alloy containing the lowest amount of Al. Similar to the polarization studies, these differences are likely due to the presence of impurities and alloying agents within the Mg–Al matrix in the commercial alloys.
The surface pH evolution and contact angle evolution experiments are in good agreement between the commercial and binary alloys. In surface pH evolution studies, both commercial and binary alloys show increased time to stabilize to elevated pH (∼9–11) with increasing Al concentration. The length of time required to reach the maximum pH is shorter in commercial alloys compared with their binary alloy counterparts (e.g. 30 s in αMg-2 at% Al compared with 4 s in AZ31B). The trend in decreasing contact angle with increased free corrosion time is seen in both commercial and binary Mg–Al alloys. Comparable values are measured for αMg-2 at% Al and AM60, although the contact angle stabilizes at ∼15° in αMg-5 at% Al compared with ∼30° in AM60 for longer corrosion times.
The linear sweep voltammetry in the ionic liquid (deep eutectic CC-urea) showed higher maximum current densities for AZ31B (9 mA cm−2) and AZ91D (8.5 mA cm−2) compared with αMg-2 at% Al (6.8 mA cm−2) and Mg-8 at% Al (4 mA cm−2). Additionally, the corresponding peak potentials are more negative in the commercial alloys (−300 mV in AZ31B and −220 mV in AZ91D vs +100 mV for the 2 at% alloy and −100 mV in the 8 at% alloy). AM60 showed significantly lower anodic current densities measuring from 0–175 μA cm−2. Although αMg-5 at% Al similarly showed reduced kinetics compared with αMg-2 at% Al and Mg-8 at% Al, this is the lowest observable maximum anodic current density of all commercial and binary alloys tested by a full order of magnitude (102 μA cm−2 compared with 103 μA cm−2 in other tested commercial and binary alloys).
Of the ionic liquid morphologies in the commercial alloys, only AZ91D shows any strong similarity to the binary alloys. The web-like morphology seen in AZ91D is very similar to the one seen in α-Mg-5 at% Al. The pit diameter for AZ91D is smaller than that measured in α-Mg-5 at% Al (∼5 μm vs ∼10 μm), which may be attributable to the smaller grain size (∼110 μm vs ∼400 μm), although the length scale of these structures is over an order of magnitude smaller than the measured grain size in both alloys, reaffirming our previous observation23 that these nanostructures form within the grain. The web-like morphology of both alloys is characterized by a distinct hexagonal geometry. The hexagonal shape can be achieved as arrays of nanowires at dissolving step edges on opposing close-packed surface directions (e.g. 〈1120〉 on the Mg basal plane) merge. The AM60 and AZ31B show morphologies with little resemblance to binary Mg–Al alloys (platelet morphology development) containing similar Al concentration. This is likely due to the strong differences in the dissolution kinetics between these commercial and the binary alloys previously examined.23 This appears to be a stronger effect for lower Al concentrations in the alloys. Similar morphologies may be achievable between the commercial and binary alloys using alternative potentials, or even galvanostatic dissolution.
Conclusions
The Al concentration is a major factor affecting the magnitude of Ecorr shifts during free corrosion of binary single-phase Mg–Al alloys. In the commercial alloys, the presence of β-phase stabilizes the Ecorr while the presence of Zn strongly dictates the aqueous Ecorr behavior over time. The presence of impurities and alloying agents similarly affects the pH evolution within a large electrolyte volume, although surface pH evolution appears consistent with binary single-phase Mg–Al alloys for which the rate of pH change is slower with increasing Al concentration. Using accelerated free corrosion and ionic liquid dissolution, we observed platelet, mud cracking, and web-like surface morphology evolution accompanied by Al surface enrichment, consistent with our earlier observations of the single-phase alloys previously examined.23 This type of morphology evolution appears to be independent of secondary phase and intermetallic particle presence.
Acknowledgments
The authors gratefully acknowledge the Department of Energy Office of Energy Efficiency and Renewable Energy (DOE EERE), Lightweight Materials, Vehicle Technology Office (Contract No: DE-EE0006436) for supporting this work.