
Abstract
The electrolyte additive lithium difluorophosphate improves the lifetime of lithium-ion cells. This work presents the synthesis and evaluation of alternative difluorophosphate salt electrolyte additives. Ammonium difluorophosphate is readily prepared via a solid-state, benchtop reaction of ammonium fluoride and phosphorus pentoxide that requires only gentle heating to initiate. The best yield of sodium difluorophosphate (NaFO) in the present study was obtained by reacting difluorophosphoric acid and sodium carbonate in 1,2-diemethoxyethane over 3 Å molecular sieves. Tetramethylammonium difluorophosphate was prepared from NaFO via cation-exchange with tetramethylammonium chloride. NaFO is here reported to be a very good electrolyte additive, with similar performance in NMC532/graphite pouch cells as the lithium salt. The beneficial nature of both additives is attributable to the difluorophosphate anion. In contrast, ammonium and tetramethylammonium difluorophosphates are found to be poor electrolyte additives. For the former, this is suggested to be due to the formation of lithium nitride and hydrogen gas.
Export citation and abstract BibTeX RIS

This is an open access article distributed under the terms of the Creative Commons Attribution 4.0 License (CC BY, http://creativecommons.org/licenses/by/4.0/), which permits unrestricted reuse of the work in any medium, provided the original work is properly cited.
Lithium-ion cells find diverse and ubiquitous use in portable electronics, power tools, medical implants, electric vehicles, and grid energy storage.1 A critical component of contemporary lithium-ion cell design is a robust electrolyte solution containing one or more chemical additives. Electrolyte additives are introduced into the electrolyte solution on the order of just a few weight percent and yet they significantly affect the lifetime, safety, and performance of a cell. Many additives have been tested and demonstrated to limit electrochemical impedance growth, decrease the rate of self-discharge during storage, increase cell lifetime, and limit the evolution of gas.2,3 Therefore, the development of new electrolyte additives and additive combinations will support improvements to lithium-ion cell energy density, cost, and lifetime.
There are many reported classes of electrolyte additives, including cyclic carbonates,4–7 organic sulfates and sulfonates,8–11 Lewis adducts,12–14 alkyl-substituted phosphites and phosphates,15–18 and relatively uncommon heterocycles.19,20 Another important class is the lithium salts,21–23 including lithium difluorophosphate (LFO).24–32 LFO has recently shown tremendous promise both as a single additive and as a component of a mixture for preparing cells with extensive lifetimes.33 LFO has also observed as the product of the interfacial reaction between lithium hexafluorophosphate salt and aluminum oxide cathode coating materials.34 It is therefore desirable to gain a better understanding of the chemical pathways of LFO in cells, as has been done for other additives.35–37 LFO is also a relatively expensive additive, making it desirable to identify lower cost alternatives.
The present work examines several difluorophosphate salts with different cations in lithium-ion cells. Their synthesis and relative efficacies as new electrolyte additives are discussed.
Experimental Methods
Benchtop synthesis of NH4PO2F2
NH4F (Alfa Aesar, ≥98%; 0.79 g, 21.17 mmol, 6 eq) and P4O10 (Alfa Aesar, ≥98%; 1.00 g, 3.53 mmol, 1 eq) were crushed together in a mortar and pestle and placed inside a brass crucible. This crucible was placed onto a hot plate and heated to maximum heat. When the reaction mixture reached around 90 °C, it suddenly reacted, giving off a large amount of heat and a small amount of vapour. At this point the crucible was removed from the hot plate and allowed to cool. The solid was scraped out, ground up using a mortar and pestle, and placed into a 50 ml Erlenmeyer flask. 20 ml ethanol was added, and heated and stirred until the ethanol boiled. At that time the flask was removed from the heat and its contents were filtered. The liquid was evaporated under reduced pressure to give 0.468 g of product (37%). An analogous reaction was attempted substituting NaF (Sigma, 99.9%) for NH4F. The reaction did start at 145 °C and reached 244 °C when it got underway, but only gave a 7% yield of product even when 1,2-dimethoxyethane (Alfa Aesar, ≥99%, stab. with BHT) was used as the extraction solvent. Reactions run using ethanol as the extraction solvent failed to give more than a few mg of desired difluorophosphate product. This reaction failed entirely when MgF2 (Aldrich, 99.9%) was used instead of NaF, even when heated to 275 °C.
Sealed-tube synthesis of NaPO2F2
In an inert atmosphere, 1.00 g of P4O10 (3.52 mmol, 1 eq) and 0.90 g of NaF (21.12 mmol, 6 eq) were placed into a sealed stainless steel reactor and heated to 300 °C for 5 or 12 h. When the reactor cooled down the product was thoroughly crushed using a mortar and pestle, acetone (25 ml) was added, and the reaction stirred for 5 min. Rotary evaporation of the acetone gave some product as shown by NMR, but only a few milligrams at most. The remainder of the product was mainly the undesired monofluorophosphate, Na2PO3F. Whether the reaction was run for 5 or 12 h did not seem to affect the yield. Subsequent Soxhlet extraction of the white solid using acetone failed to increase product yield.
Ball-mill synthesis of NaPO2F2
The same quantities of reagents were used as in the sealed-tube synthesis above, but the reagents were placed inside a high energy ball mill vial in an inert atmosphere, and milled for 2, 6, or 13 h. As in the sealed-tube synthesis, the product was crushed using a mortar and pestle, extracted with 25 ml of acetone, and stirred for 5 min, followed by rotary evaporation. Some difluorophosphate product was detected by NMR, but the quantities were too low to be isolable (a few mg at most); the remainder of the product was mainly the undesired monofluorophosphate. The extended milling times had no effect on product yield.
Hydrolysis of hexafluorophosphate salts
2.00 g of NaPF6 (Oakwood Chemicals, 98%; 11.9 mmol, 1 eq), 2.78 g NaCl (ACP Chemicals, ≥99%; 47.9 mmol, 4 eq) were added to 8 ml of DMC in a Nalgene vial. 0.43 ml H2O (23.8 mmol, 2 eq), was added to this suspension, and the reaction allowed to stir. A slurry formed after 2 h, but no hydrolysis of hexaflurorophosphate to difluorophosphate was found by NMR even after 4 h. Adding 3 crushed pellets of NaOH in order to help remove the HCl by-product failed to improve conversion even after waiting 3 d.
Cation exchange method of making NaPO2F2 and KPO2F2 from NH4PO2F2
NH4PO2F2 (0.800 g, 6.72 mmol, 1 eq), was dissolved in 20 ml of tert-Butanol. To this, sodium tert-butoxide (Aldrich, 97%; 0.65 g, 6.72 mmol, 1 eq) was added. The mixture was allowed to stir for 1 h, and then the solids were filtered off. The tert-butanol was evaporated under reduced pressure to yield sodium difluorophosphate (0.417 g, 50%). An analogous method was attempted for the synthesis of KPO2F2, in which NH4PO2F2 (0.800 g, 6.72 mmol, 1 eq), was dissolved in 20 ml of tert-butanol. To this, potassium tert-butoxide (Alfa Aesar, 98%; 0.75 g, 6.72 mmol, 1 eq) was added. After stirring for 1 h, the tert-butanol was removed under reduced pressure, yielding 0.687 g of solid (73%), and an NMR was taken by dissolving some of the solid in deuterated methanol.
Synthesis of NaPO2F2 from difluorophosphoric acid and sodium carbonate
Na2CO3 (Alfa Aesar, ≥99.5%; 0.83 g, 7.82 mmol, 1.1 eq) and around 8 g of 3 Å molecular sieves (Acros Organics, 8 to 12 mesh) were added to 20 ml of 1,2-dimethoxyethane, resulting in a suspension. 1.00 ml of HOPO2F2·0.5H2O (Oakwood Chemicals, >97%; 7.11 mmol, 1 eq) was added, which resulted in the evolution of carbon dioxide gas. After 1 h, the reaction mixture was centrifuged twice at 2200 RPM, and the solvent removed under reduced pressure. The crude product was washed with 15 ml of diethyl ether and isolated via suction filtration, affording 1.07 g of NaPO2F2 (60%). An analogous reaction using CaCO3 failed to produce crystalline product, yielding instead a gummy mess that was hard to purify.
Synthesis of NMe4PO2F2 from NaPO2F2
NaPO2F2 (0.172 g, 1.39 mmol, 1 eq) was dissolved in 5 ml of acetonitrile. NMe4Cl (Oakwood Chemicals, 97%; 0.150 g, 1.39 mmol, 1 eq) was added. The reaction was stirred for 30 min, and the solid NaCl was filtered off. The liquid was evaporated under reduced pressure to yield 0.162 g (67%) of NMe4PO2F2. These crystals were somewhat soluble in acetone and very soluble in DMSO. Analogous reactions using NEt4Cl and NBu4Cl resulted in the formation of oils that were very difficult to purify.
Characterization of products
Products were characterized by solution nuclear magnetic resonance (NMR) spectroscopy. Spectra were collected with a Bruker 500 MHz NMR spectrometer controlled by TopSpin software. Chemical shifts are reported in ppm referenced to the residual solvent peaks (1H NMR) or were externally referenced to standard materials (19F and 31P NMR). Spectra are provided as Supplemental Material (Figs. S2–S12 is available online at stacks.iop.org/JES/167/100538/mmedia).
Products were also characterized by X-ray diffraction A Siemens D5000 diffractometer equipped with a copper target X-ray tube and a diffracted beam monochromator was used. Samples were measured in air using data collection protocols that took 90 min for the entire pattern. No degradation of the materials was observed to occur over those 90 min. In the case of NH4PO2F2, where the crystal structure is known,38 Rietveld refinement of the measured powder pattern was performed using the Rietica software.39
Materials and electrolytes
Electrolyte solutions were prepared with LiPF6 (ShenZhen Capchem, China ≥99.9%) in a 25:5:70 solvent blend, by mass, of ethylene carbonate, ethyl methyl carbonate (EMC), and dimethyl carbonate (DMC), as received from Capchem (<20 ppm H2O). Solutions were prepared by adding 1%, by mass, LiPO2F2 (Capchem) or the difluorophosphate salt additives prepared in this work (Table I). Solution preparation and materials handlingwas performed in an argon-atmosphere glove box.
Table I. Summary of difluorophosphate salts prepared in this work.
| Abbrev. | Name | Formula | CAS # |
|---|---|---|---|
| LFO | Lithium difluorophosphate | LiPO2F2 | 24389-25-1 |
| NaFO | Sodium difluorophosphate | NaPO2F2 | 15587-24-3 |
| KFO | Potassium difluorophosphate | KPO2F2 | 13767-90-3 |
| AFO | Ammonium difluorophosphate | NH4PO2F2 | 15252-72-9 |
| MAFO | Tetramethylammonium difluorophosphate | N(CH3)4PO2F2 | N/A |
Lithium-ion cells
Dry (no electrolyte), vacuum-sealed LiNi0.5Mn0.3Co0.2O2 (NMC532)/graphite pouch cells, with capacity of ∼220 mAh at 4.3 V and ∼230 mAh at 4.4 V, were received from LiFun Technology (Tianyuan District, Zhuzhou, Hunan, China). The NMC532 material was "single crystal" and had a proprietary Ti-based coating applied, as described previously by Li et al. and by Weber et al.40,41 The negative electrodes were made of an artificial graphite. The cells were cut below the heat seal in an argon-atmosphere glove box, dried under vacuum at 80 °C for 14 h, and then returned to the glove box for filling. Cells were filled with 1.00 ± 0.05 g of solution, sealed at −90 kPa gauge pressure using a compact vacuum sealer (MSK-115A, MTI Corp.), and immediately held at 1.5 V at room temperature (21 °C–25 °C) to prevent corrosion of the copper current collector during the ∼24 h wetting period that followed. Cells were then loaded into temperature-controlled boxes (40.0 ± 0.1 °C) and connected to a Maccor 4000 Series automated test system (Maccor Inc.). Because gas formation is frequently observed during formation, storage, and cycling, the pouch cells were clamped using soft rubber (at about 25 kPa gauge pressure) during all electrochemical testing, which has previously been observed to significantly improve the experimental precision.
Solid-electrolyte interphase (SEI) formation was performed by charging cells at C/20 to 4.3 V (at 40 °C), holding at 4.3 V for 1 h, discharging at C/20 to 3.8 V, and then holding cells at 3.8 V for 1 h. Cells were weighed while immersed in high purity water to evaluate the volume change due to gas evolution during formation. Cells were then degassed by cutting the pouch open in an argon-atmosphere glove box, and resealed using the compact vacuum sealer. Electrochemical impedance spectroscopy (EIS) was measured at 10.0 ± 0.1°C using a BioLogic VMP3 instrument (100 kHz–30 mHz, ± 10 mV sinusoidal amplitude). Following formation, cells were taken for either ultrahigh precision coulometry or long-term cycling.
UHPC cycling was performed at 40.0 ± 0.1 °C using a Novonix high precision charger system. Long-term cycling was performed at 40.0 ± 0.1 °C and at C/3 rate between 3.0–4.3 V or 3.0–4.4 V using a Neware testing system. Two upper cut-off voltages were chosen to evaluate the effects of the additives for relatively lower or high voltage cell designs. Generally, higher cell voltages lead to increased degradation rates at the positive electrode. A slow cycle was performed every 50 cycles at C/20 to evaluate impedance growth.
Results and Discussion
Solid-state synthesis of difluorophosphate salts
The present work originated from efforts to prepare a wider range of difluorophosphate salts for testing as lithium-ion battery electrolyte additives. Of particular interest was sodium difluorophosphate (NaFO) for its chemical similarity to the well-known LFO additive. However, this compound is relatively rare and a commercial supplier could not be located. Therefore, this study begins with a detailed summary of the in-house preparation of NaFO and several related difluorophosphate salts. The first method considered in this work is the solid-state synthesis described by Garcia-Juan and Schulz,42 in which LFO is prepared by mixing together solid lithium fluoride and phosphorus pentoxide powders and heating in a sealed tube (1). Both this method and the analogous reaction for producing NaFO (2) were tested under a wide variety of conditions; the oven temperature ranged from 250 °C–300 °C and the heating time ranged from 10 min–5 h. Nonetheless, following isolation of the difluorophosphate salts via Soxhlet extraction, synthetic yields were low, ranging from 10%–20% (Figs. S4–5).


In contrast to the alkali salts, when the reaction was repeated with ammonium fluoride (3), good yields of ammonium difluorophosphate (AFO) were readily prepared on the benchtop (Figs. S6–7). It is noted that unlike the alkali salts, which require a sealed pressure tube and a high-temperature oven, the synthesis of AFO by this method may be performed open to air and requires only minimal heating on a hot plate to initiate the reaction. Therefore this approach was deemed suitable for the synthesis of AFO, but an alternate method for preparing NaFO was still needed.

Synthesis from another difluorophosphate via cation exchange
It was next considered whether a cation-exchange reaction could be performed with AFO to prepare NaFO (4) or other alkali difluorophosphate salts, such as potassium difluorophosphate (KFO) (5). This method was successfully used to prepare NaFO, albeit with moderate reaction yield (50%). The results were better for reaction (5), which was successfully performed to produce KFO product (73%, Figs. S8–9).


The synthesis of NaFO was reattempted according to the method of Tan, who prepared a large series of difluorophosphate salts from commercially purchased difluorophosphoric acid and the corresponding anhydrous metal chlorides (6).43 However, when this reaction was attempted, an insoluble mass formed in the reaction vessel and the glass walls of the flask were observed to have become severely etched. The etching was attributed to the formation of HF during the reaction, possibly due to water or other contaminants in the HPO2F2. Adding the acid to the metal chloride via distillation, as recommended previously,43,44 yielded similar unsuccessful results. The reaction also became very hot as the acid was added, making it unfavourable for practical use and, thus, a milder approach was pursued.

The evolution of hot gaseous acid in reaction (6) is a key point to avoid. Therefore, the reactions of difluorophosphoric acid with sodium carbonate (7) or with sodium bicarbonate (8) were considered. In both cases, the reaction is expected to be thermodynamically driven by the evolution of carbon dioxide gas, although both produce water as an unwanted by-product. Since reaction (7) produces half the stoichiometric quantity of water as reaction (8), sodium carbonate was used in this work.


It is important to perform reaction (7) over a drying agent to avoid hydrolysis of the reactants or products. Use of a sodium sulfate, a relatively weak drying agent, produced a low yield of NaFO (14%). When reaction (7) was retried using 3 Å molecular sieves, a very strong drying agent, the yield improved significantly (60%) and sufficient quantities of the product could be prepared for testing in lithium-ion cells. This is the method used to prepare the NaFO used for electrochemical testing in this work.
Synthesis of tetraalkylammonium difluorophosphate salts
Quaternary ammonium salts find diverse use as antimicrobial disinfectants,45,46 phase-transfer catalysts,47–49 and fabric softeners.50,51 They are also widely used as non-reactive, supporting electrolytes.52–54 It was decided that quaternary ammonium difluorophosphate salts could yield useful or interesting results as electrolyte additives in lithium-ion cells and, thus, their synthesis was attempted. Tetramethylammonium difluorophosphate (MAFO) was previously prepared by Tan from difluorophosphoric acid and tetramethylammonium chloride.43 However, given the difficulty repeating the analogous reaction (6), another approach was adopted in the present work. The appropriate alkylammonium chloride salts were added to NaFO, such that precipitation of insoluble NaCl may drive the production of MAFO (9), tetraethylammonium difluorophosphate (10), and tetrabutylammonium difluorophosphate (11).
Reaction (9) gave good yield (67%) and high purity product, as determined by NMR (Figs. S10–S12). Reactions (10) and (11) were unsuccessful; following removal of the solvent, a small volume of oily residue remained in each reaction flask. Attempts to isolate any product from the residues were unsuccessful. Although the methods employed here are different, Tan similarly reported difficulty preparing the tetraethylammonium and tetrabutylammonium difluorophosphate salts due to the formation of viscous oils.43


X-ray diffraction of difluorophosphate salts
Figure 1 shows diffraction patterns of the diphosphate salts prepared in this work compared to those measured by Reed in 1965 with a Debye–Scherrer camera.55 Reed's film images were "cut and pasted" from his thesis and scaled by scattering angle to give the best match to our measured patterns. [Aside: It is wonderful that Reed taped actual films into the appendix of his thesis and that these were subsequently scanned by library staff at the University of British Columbia to make a permanent record]. The X-ray patterns of LiPO2F2, KPO2F2 and NH4PO2F2 match well with those of Reed. The pattern of NaPO2F2 shows a reasonable qualitative match. The crystal structure of NaPO2F2 has not yet been reported in the literature.
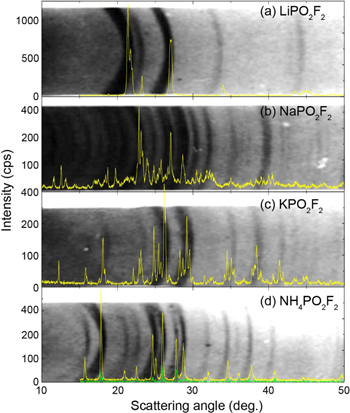
Figure 1. X-ray diffraction patterns of (a) the commercially purchased LFO and the (b) NaFO, (c) KFO, and (d) AFO materials prepared in this work, overlaid on Reed's diffraction patterns taken on film with a Debye–Scherrer camera.55
Download figure:
Standard image High-resolution imageFigure S1 shows the Rietveld refinement of the NH4PO2F2 diffraction pattern based on the crystal structure information provided by Harrison and Trotter.38 The agreement between the measured and calculated patterns in Fig. S1 is very good, confirming that NH4PO2F2 of high quality has been made.
NMR characterization of the difluorophosphate additives
The reaction products were characterized by 19F and 31P NMR spectroscopy. The spectra of NaFO are shown for example in Fig. 2. Additional spectra are provided as Supplemental Material (Figs. S2–S12). The 19F spectra of the difluorophosphate salts contain a doublet centred at approx. −83 ppm and the 31P spectra contain a triplet centred at approx. −15 ppm. The J-coupling between 19Fand 31P atoms is on the order of 940 Hz. This is consistent with previously published spectra of the PO2F2– anion.34 In the case of the commercial LFO material, there are additional peaks in the 19F and 31P spectra that are shifted 0.13 ppm and 0.07 ppm, respectively (Figs. S2–3). These extra peaks are attributed to LiPO2F2 ion pairs. This assignment is supported by a weak 7Li–19F J-coupling constant of 8 Hz in one of the 19F doublets.
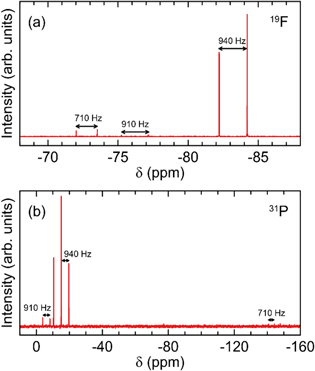
Figure 2. (a) 19F and (b) 31P NMR spectra of NaFO prepared in this work via cation exchange (7) over 3 Å molecular sieves, measured in acetone-d6. 19F–31P J-coupling constants are indicated on the figure (rounded to the nearest 5 Hz).
Download figure:
Standard image High-resolution imageThe 19F and 31P spectra each contain an additional doublet, centred at −76 ppm and −8 ppm, respectively. These peaks have a 19F–31P J-coupling constant of ∼910 Hz and are attributed to small amounts of monofluorophosphate anion impurities, PO3F2–. The monofluorophosphate salts are low solubility by-products that were formed in small amounts for all of the syntheses tested in this work. Finally, some of the spectra measured in this work contain a doublet centred at approx. −74 ppm with a J-coupling constant of ∼710 Hz is observed in the 19F spectrum of NaFO (Fig. 2a). This is a close match with the published position and splitting parameter of the hexafluorophosphate anion, PF6–.34 The corresponding 31P septet centred at −144 ppm is also observed, although only three of seven peaks are above the experimental detection limit (Fig. 2b). The NMR spectra in this work should not be viewed as quantitative measurements, but they do provide a rough estimate of the product purities. For example, the relative peak integrals of the sodium monofluorophosphate and hexafluorophosphate impurities in Fig. 2a were ∼2% and ∼3%, respectively, of the difluorophosphate peaks. This suggests an approximate purity on the order of ∼95% for the NaFO additive in this work. Similar purities are observed for the other difluorophosphate products, as seen in Figs. S4–12.
Electrochemical evaluation of difluorophosphate additives
Three new difluorophosphate salt additives were synthesized and tested as electrolyte additives in this work: NaFO, AFO, and MAFO. Although KFO was successfully synthesized, its limited solubility made it unsuitable for testing in lithium-ion cells. The behaviour of NMC532/gr pouch cells prepared with 1%, by weight, of each of the new additives are compared against the commercially obtained, well-characterized LFO additive, which is known to significantly improve battery lifetime and stability under a variety of testing conditions.24,29,30
First, the differential capacity response at low cell voltages (1.5–3.2 V) of the formation cycle was examined. In all cases, there is a peak at ∼2.9 V, corresponding to the formation of an SEI at the negative electrode via the electrochemical reduction of EC. This is consistent with previous studies on LFO-containing cells.30 Cells that contained 1% AFO display an additional feature, centered at ∼2.0 V. The additives differ only by their cations and this region corresponds to rapidly decreasing electrode potential at the negative. Therefore, this feature must correspond to the reduction of the ammonium cation. A likely reduction scheme involves the production of lithium nitride and hydrogen gas (12).

The volume change due to gas evolution was measured following the formation cycle (Fig. 4a). All cells in this work produced some gas during SEI formation, consistent with previous reports.56,57 There are no significant differences in the volume change of cells that contained LFO, NaFO, or MAFO. This is attributable to the evolution of ethylene and hydrogen as by-products of EC reduction.56 Cells prepared with AFO produced more gas than the others, consistent with the expected H2 evolution according to the proposed reaction (12). If one assumes 10 mg of additive per cell and ∼22.4 l mol−1 of gas, the expected volume of H2 for reducing all of the added ammonium is ∼3.8 ml. This is approximately the volume of gas that was produced in AFO-containing cells. It is noted that this value is not additive with the volume of gas in control cells, consistent with the observation that the EC reduction feature is mostly suppressed in AFO-containing cells in Fig. 3. This suggests that AFO reduction forms an SEI that is either passivating or at least partially passivating.
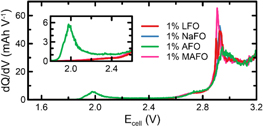
Figure 3. Differential capacity (dQ/dV) plot of SEI formation during the first charge cycle (40 °C, C/20) of NMC532/gr pouch cells prepared with 1% difluorophosphate salt additives (as indicated).
Download figure:
Standard image High-resolution imageThe charge transfer resistance, Rct, was also measured following the formation cycle (Fig. 4b). Here, Rct is taken as the diameter of the depressed semicircle in the Nyquist representation of the EIS spectrum. Rct represents a combination of Li-ion desolvation and transport of the lithium cation through the SEI layers at both the positive and negative electrodes. Similar to the gas results, there are no significant differences between the cells prepared with LFO, NaFO, and MAFO. The average Rct value from AFO-containing cells is greater than the rest of the cells in this work. However, the variability between replicate cells is too large to make a conclusive statement with any certainty. Representative Nyquist plots of the post-formation EIS data show a very similar shape for LFO-, NaFO-, and MAFO-containing cells, whereas the shape of the Nyquist plot for cells prepared with AFO is more semi-circular than the others (Fig. 5). This supports the hypothesis that the first three additives lead to identical (or very similar) SEI compositions, whereas reduction of the ammonium cation produces a new SEI component such as lithium nitride.
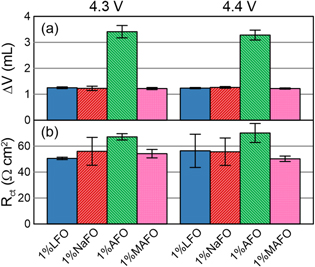
Figure 4. (a) Volume change due to gas evolution and (b) Rct measured after cell formation for NMC532/gr cells prepared with 1% difluorophosphate salt additives as indicated. Cells were formed to 4.3 V or 4.4 V, as indicated at the top of the figure.
Download figure:
Standard image High-resolution image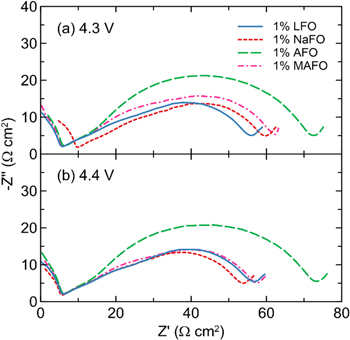
Figure 5. Representative EIS Nyquist plots measured after cell formation from NMC532/gr cells prepared with 1% difluorophosphate salt additives (as indicated). Cells were formed to (a) 4.3 V or (b) 4.4 V. The increase in the negative imaginary component at very high frequency (near the left of the spectra) is due to cable impedance in our setup.
Download figure:
Standard image High-resolution imageUltrahigh-precision coulometry (UHPC) cycling was performed on cells containing each of the four electrolyte additives (Fig. 6). The performance of NaFO is very similar to LFO suggesting that NaFO will be an excellent electrolyte additive with comparable performance and lifetime metrics to the well-characterized LFO additive. In contrast, AFO and MAFO show significantly greater capacity fade rates (Figs. 6a, 6b), greater charge endpoint capacity slippage (Figs. 6c, 6d), lower coulombic efficiency (CE, Figs. 6e, 6f), and larger ΔV slopes (Figs. 6g, 6h). All of these point to the same conclusion that AFO and MAFO are less suitable for use as electrolyte additives than LFO or NaFO.

Figure 6. (a), (b) Normalized discharge capacity, (c), (d) charge endpoint capacity slippage (normalized to the second cycle), (e), (f) coulombic efficiency, and (g), (h) ΔV (normalized to the fourth cycle) measured during UHPC cycling of NMC532/gr pouch cells at 40 °C and C/20 rate. Cells contained 1% difluorophosphate salt additives as indicated. Cells were cycled between (a), (c), (e), (g) 3.0–4.3 V or (b), (d), (f), (h) 3.0–4.4 V.
Download figure:
Standard image High-resolution imageThe long-term cycling at C/3 rate and 40 °C was measured on cells with each of the difluorophosphate salt additives (Fig. 7). The results mirror those of the UHPC tests; NaFO displays very similar behaviour to LFO as an electrolyte additive whereas AFO and MAFO lead to decreased performance. However, it is noted that the performance of AFO-containing cells cycled to the higher upper cut-off voltage in this work (i.e., those cycled 3.0–4.4 V) performed more similarly to the LFO- and NaFO-containing cells.

Figure 7. (a), (b) Normalized discharge capacity and (c), (d) normalized ΔV measured during cycling of NMC532/gr pouch cells at 40 °C and C/3 rate, with one slow C/20 cycle every 50th cycle. Cells contained 1% difluorophosphate salt additives or 2% VC and 1% DTD as indicated. Cells were cycled between (a), (c) 3.0–4.3 V or (b), (d) 3.0–4.4 V.
Download figure:
Standard image High-resolution image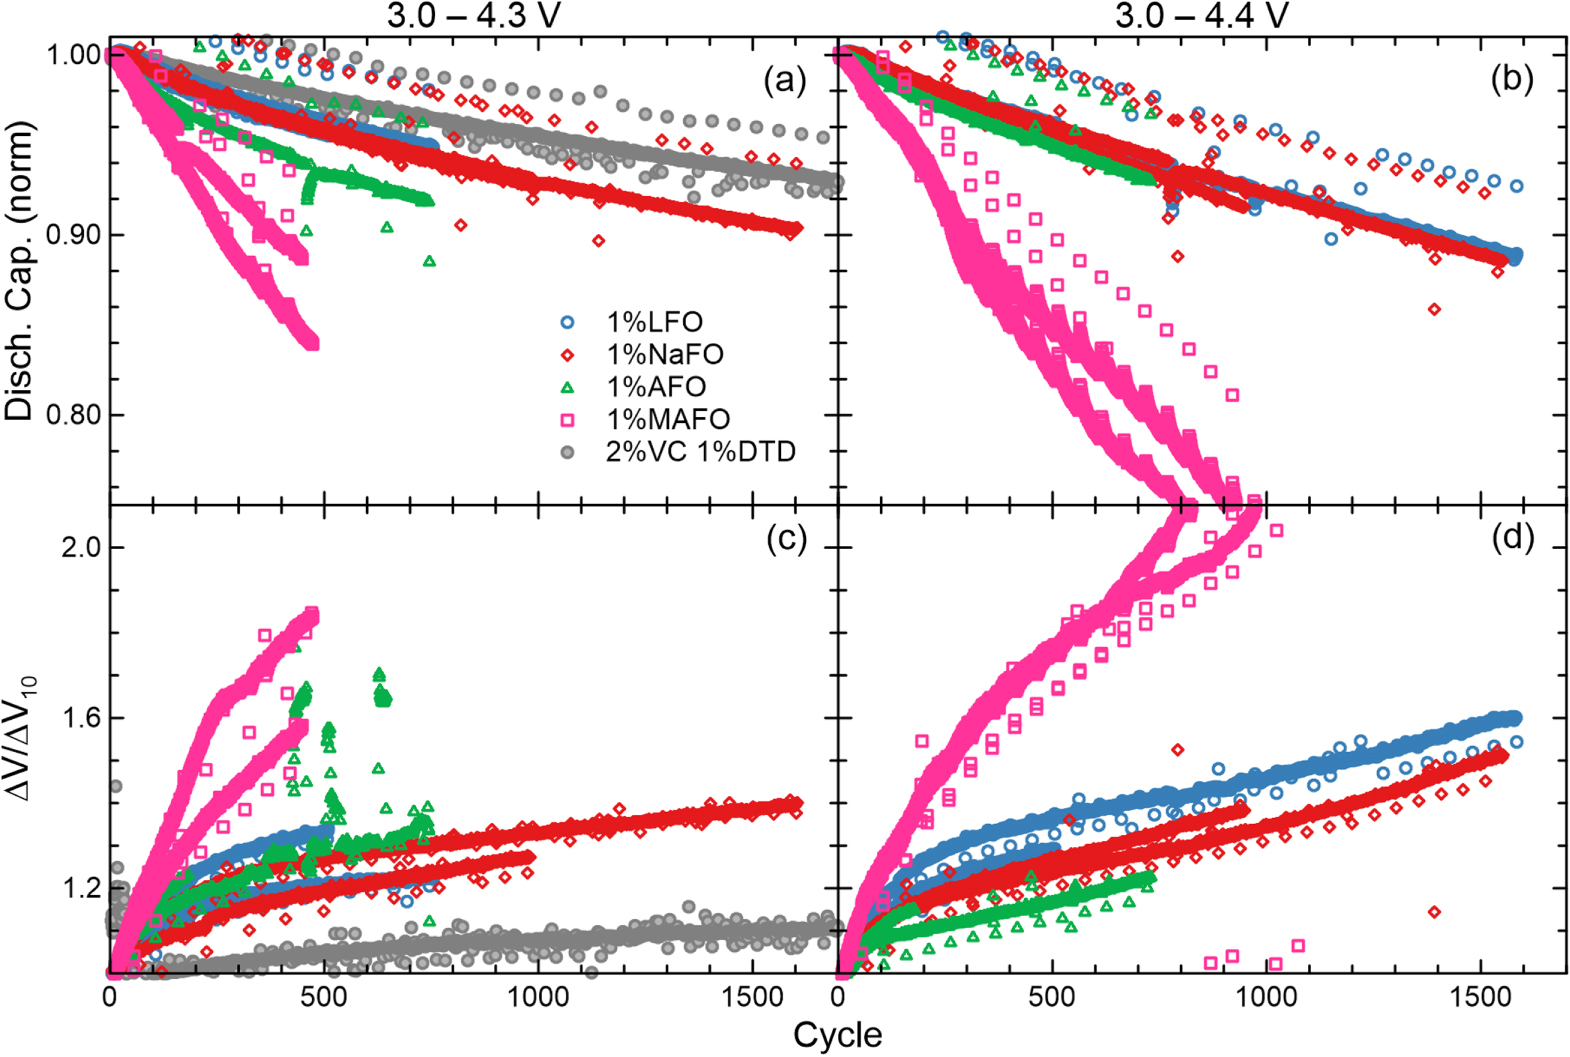
The observation that NaFO and LFO perform very similarly suggest that the beneficial nature of LFO is attributable to the difluorophosphate anion, rather than some effect of the added lithium cation. The limited solubility of KFO demonstrates that the cation cannot simply be any alkali metal. Finally, the poor electrochemical performance of AFO and MAFO as electrolyte additives demonstrate that ammonium and tetraalkylammonium cations have deleterious effects on the long-term stability of lithium-ion cells. In the case of AFO, the formation of lithium nitride at the negative electrode is suspected and suggested to be a poor SEI component. It is unknown why the tetramethylammonium cation has a negative impact on the cycling performance of cells.
Figure 7 also shows data from NMC532/graphite cells prepared with 2% vinylene carbonate (VC) and 1% ethylene sulfate (1,3,2-dioxathiol-2,2-dioxide, DTD) in a 1.0 M LiPF6 solution in 3:7 EC/EMC and cycled between 3.0–4.3 V. This data, provided by Harlow et al., is a useful benchmark for evaluating new electrolyte chemistries.58 It is observed that the capacity retention of cells prepared with 1% LFO or 1% NaFO does not quite match the long-term stability of the 2%VC 1%DTD blend promoted by Li et al.59 In particular, the difluorophosphate salt additives are less effective at inhibiting impedance growth during cycling (Fig. 7c). Future work is encouraged to explore whether further improvements are possible, for example by blending fluoroethylene carbonate (FEC) and NaFO, similar to the FEC/LFO blends reported by Ma et al.33
Conclusions
Three new difluorophosphate salt electrolyte additives were synthesized and evaluated in NMC532/graphite pouch cells. Ammonium difluorophosphate (AFO) is readily prepared via a solid-state, benchtop reaction of ammonium fluoride and phosphorus pentoxide that requires only gentle heating to initiate. The best yield of sodium difluorophosphate (NaFO) in the present study was obtained by reacting difluorophosphoric acid and sodium carbonate in 1,2-diemethoxyethane over 3 Å molecular sieves, a very strong drying agent. Tetramethylammonium difluorophosphate (MAFO) was prepared from NaFO via cation-exchange with tetramethylammonium chloride.
NaFO is here reported to be a very good electrolyte additive, with similar performance in NMC532/gr cells as the better known LFO additive, each showing ∼90% discharge capacity retention after >1,500 cycles at 40 °C. The long-term stability during cycling between 3.0–4.3 V compares favourably with, but nonetheless is less than the 2%VC 1%DTD benchmark cells reported by Harlow et al., which have ∼94% capacity retention after 1,500 cycles.58 The beneficial nature of both additives is attributable to the difluorophosphate anion. In contrast, AFO and MAFO are found to be poor electrolyte additives. This is suggested to be due to the formation of lithium nitride for the former. It is unknown why tetramethylammonium cations have a negative effect on cell stability.
Acknowledgments
This work was jointly funded by Tesla Canada and the Natural Sciences and Engineering Research Council of Canada (NSERC). CPA thanks NSERC for scholarship support.