
Abstract
Increased interest in liquid ammonia (NH3) for hydrogen storage can be attributed to its lack of carbon, high energy density to volume and mass ratios (17.6 wt% hydrogen), a ubiquitous supply and distribution network, and lower cost. Recent progress in direct ammonia fuel cells for power generation, as well as ongoing work on the electrochemical synthesis of ammonia, motivate the need for fundamental investigations of aqueous ammonia interactions with electrode materials. Porous gas-diffusion media (GDM) play a large role in facilitating liquid, gas, and charge transport and are an inherent part of these technologies membrane electrode assemblies (MEA). This work characterizes how key wetting properties such as contact angle, advancing/receding contact angles, adhesion force, and breakthrough pressure are influenced by GDM wet-proofing, thickness, and structure. These properties are studied for aqueous ammonia solutions with 0, 10, 20, and 30 wt% NH3. The higher concentrations of NH3 along an electrode surface can lead to lower contact angles as surface tension is reduced. Wet-proofing with PTFE loadings up to 10 wt% increases hydrophobicity, while higher loadings have diminishing effects. The results are useful to those involved with modeling, design, construction, and optimization of these systems.
Export citation and abstract BibTeX RIS

This is an open access article distributed under the terms of the Creative Commons Attribution 4.0 License (CC BY, http://creativecommons.org/licenses/by/4.0/), which permits unrestricted reuse of the work in any medium, provided the original work is properly cited.
A large impediment to the development of the hydrogen economy is the production and storage of hydrogen. Due to its low energy density per volume, gaseous hydrogen requires high pressures for storage which leads to additional costly infrastructure. Liquid ammonia (NH3) is an attractive carbon-free means to chemically store hydrogen (NH3 is 17.6 wt% hydrogen) while achieving energy densities on a per mass and volume basis comparable to oil and coal.1 NH3 has been the dominate source for fertilizer since the development of the Haber-Bosch synthesizing process in the early 1900s, therefore, extensive NH3 storage technologies and distribution networks exist worldwide.2 Global NH3 production and reserves in 2018 were 142,000,000 tons with an expected growth of 6% per year in the short term.3 While toxicity is a concern, there are comprehensive protocols and regulations in place to guide its safe handling and usage.4 Though current NH3 is synthesized using fossil fuels, electrochemical synthesis processes are being investigated as well as production methods utilizing biofuels or renewable electricity.5,6 As a carbon free fuel source, NH3 has been probed for use in high temperature solid oxide fuel cells (SOFC) since the 1960s, however, significant durability issues remain Ref. 7. Recent focus has been directed toward studying NH3 for power generation in low temperature alkaline fuel cells which are better suited for a direct fuel mobile applications.8
Direct ammonia fuel cells (DAFC) are promising as the NH3 solution can be introduced directly into the anode without prior reforming. A schematic of a DAFC is presented in Fig. 1 diagraming the general structure and transport pathways. A typical alkaline DAFC MEA consists of an electrolyte membrane, anode and cathode catalyst layers (CL), and gas-diffusion media. Humidified O2 or air is reduced to OH- at the cathode in the presence of water which reacts with NH3 to form byproducts N2 and H2O. In aqueous electrolyte based DAFCs fuel is a NH3 solution defined as wt% NH3 to H2O supplied at the anode. Various DAFC have been reportedly operated at temperatures between 25 °C and 200 °C.9,10 At 25 °C, the theoretical NH3/O2 open circuit voltage (OCV) is 1.17 V and the half-cell cathode/anode and overall cell reactions respectively are:


There have been a wide range of performance data reported by groups involved with DAFC. Lan et al. demonstrated a DAFC alkaline membrane fuel cell using non-noble metal catalysts and 35 wt% aqueous ammonia fuel, achieving a peak power density (PPD) of 9 mW cm−2 at room temperature.5 The authors stated that further improvements were possible with optimization of the electrode composition and microstructure. Gottesfeld achieved a PPD of 450 mW cm−2 in an ammonia aqueous base alkaline membrane DAFC at 80 °C, focusing on the sluggish ammonium oxidation reaction (AOR) kinetics.11 Experimenting with Pt and Ir catalysts, AOR activity was observed to be highest at 60 °C for PtIr suggesting further improvements are possible with other platinum group metal (PGM) combinations and that the complex electrocatalytic processes are not completely understood. Recently, Zhao et al. using a 3 mol NH3 in 3 mol KOH fuel, achieved a PPD of 135 mW cm−2 in a DAFC at 80 °C using a carbon supported PtIr anode catalyst.12 This work concluded that substantial power density improvements are needed to make DAFCs viable, highlighting the need for controlled flow of water beyond the anode and improving current membrane electrode assembly (MEA) structures.
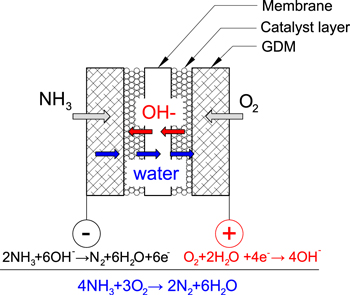
Figure 1. Schematic of direct ammonia fuel cells (DAFC).
Download figure:
Standard image High-resolution imageThe electrochemical synthesis of ammonia from air and water involves reversing reactions 1–3 via the input of electrical energy (refer to Fig. 1). NH3 synthesis from H2/N2 and H2/air, while involving reactions not presented here, achieves the same goal. The use of aqueous or solid electrolyte cells has been investigated by several groups as it could reduce the need for high temperature and pressure required in the standard production processes.6,13 If successful, this could alleviate the fossil fuel dependency of this process as wind or solar energy sources could be used. Lan et al.13 demonstrated ammonia synthesis from air and water at an applied voltage of 1.6 V achieving just over 1.1 × 10⁻⁵ mol m−2 s−1 NH3 formation rate at ambient temperature and pressure with a Faradaic efficiency of 0.55%. The work highlighted the early nature of this research and the potential for cost reduction by Pt replacement with non PGM catalysts for certain conditions. A major hurdle to achieving efficient low temperature ammonia synthesis is the stability of the N2 bond which makes its electrochemical reduction difficult.14 Significant efforts are being made to identify catalysts with low overpotential and higher selectivity toward NH3.15–18 While many other groups have reported performance data for NH3 synthesis, the focus for this study is on electrode material and reactant interactions; therefore, further details can be referred to in references.19 What these electrochemical synthesis systems have in common is the formation of liquid NH3 solution on an electrode surface that needs to be removed to maintain effective reactant transport and system efficiency.
In both fuel cells andelectrolyzers MEA design is critical to performance. The influence of the porous-electrode structure on liquid/gas transport and performance has been studied by several groups focusing on the role of gas-diffusion media (GDM).20–22 The GDM, also commonly referred to as gas-diffusion layer (GDL) or gas-diffusion electrode (GDE), if it is catalyst loaded, is an electrically conductive porous material, usually made of carbon fibers, that facilitates reactant delivery and by-product removal from catalyst sites. Capillary and viscous forces govern two-phase flow through GDMs; the dimensionless parameters that quantify them are the capillary number, Ca, and viscosity ratio, M, defined as

and

respectively, where u is the superficial velocity of the non-wetting phase, γ is the surface tension, and μwet and μnw are the wetting and non-wetting phase viscosities.23 Using thermal physical properties of NH3 water solutions contained in Appendix and air which is around 80% N2, these values can be estimated for aqueous ammonia systems. For Ca values, a range of flow rates were considered, 1 × 10⁻⁸ to 1 × 10⁻⁷ based on previous work on polymer-electrolyte fuel cells (PEFC) which have similar materials and flow regimes.23 Table I contains the approximate maximum and minimum values of M over the entire 10 °C–100 °C temperature range and 0–100 wt% solution concentration. The maximum viscosity of NH3 solution is at 20 wt%, as discussed in Appendix. A phase diagram plotted in Fig. 2 shows that nearly all these values fall clearly in the capillary fingering (CF) regime; while some of the Air/NH3 solution data lies on the viscous fingering (VF) transition zone it is closer to CF. The capillary fingering flow regime occurs when the intruding fluid has a viscosity greater then the viscosity of the displaced fluid and the flow rate of the intruding fluid is low. The viscous fingering flow regime, on the other hand, occurs when the intruding fluid has a viscosity less than the viscosity of the displaced fluid. In addition to these two flow regimes, the stable displacement flow regime occurs at viscosity conditions similar to the capillary fingering flow regime but the flow rate of the intruding fluid is higher. Considering the in-plane percolation of the intruding fluid, the capillary fingering flow regime features formation of few irregular conduits of fingers within the porous media. The viscous fingering flow regime features formation of multiple fingers of similar size. Finally, the stable displacement flow regime is characterized by a uniform percolation of the injected fluid from the point of intrusion into the porous structure. The presence of capillary-driven transport in these systems means that properties related to wetting phenomena should be characterized as they dictate GDM transport behavior and can have large implications for electrochemical performance. Progress in other chemistries of fuel cells has shown that a holistic MEA design strategy can lead to the best results.24 This work sets out to characterize key interactions for NH3 Sol./Air systems, including: contact angle, adhesion force, contact angle hysteresis, and breakthrough pressure, between liquid NH3 solutions and GDM. The hope is that this data will be useful to modelers and designers seeking to optimize MEA performance for the next generation of NH3 technologies.
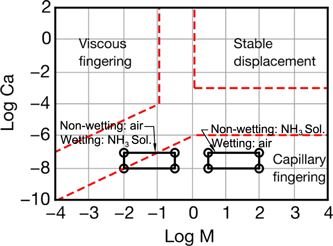
Figure 2. Drainage phase diagram showing the three flow regime of viscous fingering, stable displacement, and capillary fingering.
Download figure:
Standard image High-resolution imageTable I. Capillary number and viscosity ratio at different temperatures.
| Non-Wetting/Wetting | Temperature [°C] | wt% NH3 | M | Ca | Regime | |
|---|---|---|---|---|---|---|
| NH3 Sol./Air | Max M | 10 | 20 | 94.15 | 1 × 10⁻⁸–1 × 10⁻⁷ | CF |
| Min M | 100 | 100 | 3.01 | 1 × 10⁻⁸–1 × 10⁻⁷ | CF | |
| Air/NH3 Sol. | Max M | 100 | 100 | 0.33 | 1 × 10⁻⁸–1 × 10⁻⁷ | CF |
| Min M | 10 | 20 | 0.01 | 1 × 10⁻⁸–1 × 10⁻⁷ | CF | |
Characterization Methods
Contact angle & adhesion force
GDM surface interactions with liquids have been investigated by numerous groups; liquid water is the non-wetting phase most commonly studied.20 Measuring a sessile droplets static contact angle, θC, on a GDM surface can give insight as to the surfaces overall hydrophobicity; however, it has limitations due to deviation from Youngs equation caused by surface roughness, which can be better accounted for by the Wenzel angle θW approximation

where ε is a surface roughness factor and θY is the Young angle.21 Das et al. examined GDMs for proton-exchange-membrane fuel cells (PEMFC), describing the porous structure as not only rough but also chemically inhomogeneous due to non-uniform distribution of binding material and wet proofing (usually Teflon).21 Their work recommended using a sliding angle method to account for the total liquid/solid adhesion. A droplets sliding angle, θS, measures its propensity to detach from a surface. It is related to contact angle hysteresis, which is the difference between advancing and receding angles, θA − θR, used commonly as a qualitative method for determining droplet mobility. The sliding angle can be controlled using a tilting-stage goniometer which is discussed in the experimental section. Adhesion, fa, can be defined through the force balance25

where ρ is the liquid density, V is the liquid volume, and dw is the wetted diameter. Measuring the sliding angle at the moment of droplet detachment, which is caused by gravity, allows for estimation of the maximum adhesion between the liquid and surface. In this case fa is calculated on a force per length basis; the total adhesion force, Fa, can be calculated by Fa = faπdw. For NH3 systems, the liquid density of ammonia is a function of temperature and concentration; solution density, ρsol, is calculated using the methods in Appendix A.1. Figure 3 is a schematic showing how the geometry and angles are defined. This work will focus on room temperature conditions. Adhesion will be measured over a range of NH3 sol concentrations on several GDM that are used in both DAFC as well as electrochemical ammonia synthesis cells. The effect of adding Teflon (PTFE) will also be assessed for PTFE loadings of 5, 10, 20, and 30 wt%.
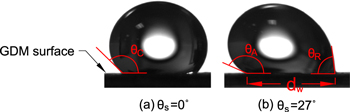
Figure 3. Droplet contact angles, (a) horizontal GDM surface, and (b) tilted GDM causing advancing and receding contact angles θA and θR, respectively. The wetted diameter is also shown in this figure.
Download figure:
Standard image High-resolution imageBreakthrough pressure
Breakthrough pressure, PBT, also referred to as threshold pressure, is related to capillary pressure, PC, and is determined by the pore structure and contact angle between a liquid and GDM. The Young-Laplace equation relates key variables

where r is the radius of a pore.20 Liquid transport between CLs and reactant channels must travel through the GDM; therefore, there is a maximum capillary pressure, PBT, that must be overcome. The breakthrough pressure method has been utilized by several groups to determine a GDMs resistance to liquid transport.22,26 In this work a range of aqueous NH3 concentrations are injected into commonly used GDM of varying thickness and PTFE loading while liquid pressure is recorded. The maximum pressure measured is considered to be the breakthrough pressure.
Experimental Setup
Aqueous NH3 solutions
Aqueous NH3 solutions were procured from the RICCA Chemical Company in nominal NH3/H2O weight ratios of 10, 20, and 30%, while pure deionized water was used for 0%. The highest wt% aqueous solution reported in literature was 35% NH3.5 This range of concentrations is of interest since DAFCs produce liquid water as a by-product which dilutes NH3, while H2O cross over in ammonia synthesis systems also leads to NH3 dilution. Key properties for each solution were calculated, along with pure NH3 for reference, using methods discussed in Appendix and are presented in Table II for room temperature (∼20 °C) conditions.
Table II. Key properties of solution calculated based on the methods discussed in Appendix.
| Nominal Solution | Actual Solution | Density | Viscosity | Surface Tension |
|---|---|---|---|---|
| (at 20 °C) | (at 20 °C) | [kg m−3] | [cP] | [mN m−1] |
| 0% (pure H2O) | 0% | 998.26 | 1.00 | 72.74 |
| 10% | 9.9–10.1% | 946.25 | 1.15 | 63.55 |
| 20% | 19.4–20.1% | 897.98 | 1.23 | 57.00 |
| 30% | 28.0–30.0% | 853.16 | 1.21 | 52.25 |
| 100% (pure NH3) | 100% | 610.22 | 0.14 | 22.13 |
GDM material selection
Previous NH3 literature was surveyed to determine what GDM materials have been utilized. Both carbon papers and cloths have been implemented in various combinations for anode and cathode electrodes.12 In some cases, while paper vs cloth was specified, the material details were not available. Table III outlines the materials selected for testing along with key properties and prior use in NH3 systems. GDM samples were purchased from Fuel Cell Store. Customized PTFE loadings were also done by Fuel Cell Store.
Table III. GDM samples tested in this study.
| Manufacturer | Series | Type | Thickness | PTFE Loading | Previous use in |
|---|---|---|---|---|---|
| [μm] | wt% | NH3 systems | |||
| Toray | 120 | Carbon paper | 370 | 5, 10, 20, 30 | 5, 12 |
| 090 | Carbon paper | 280 | 5 | ||
| 060 | Carbon paper | 190 | 5 | ||
| 030 | Carbon paper | 110 | 5 | ||
| Sigracet | 29 BA | Carbon paper | 190 | 5 | 5 |
| ELAT | HPC | Carbon cloth | 406 | 0 | 12 |
Tilting-stage goniometer
All contact angle related data as well as adhesion force measurements were completed using a Ramé-Hart tilting stage goniometer (Model 290) shown in Fig. 4a. GDM samples were fixed to a staging surface between the diffuse light source and digital camera. Automated recording of advancing & receding angles, sliding angles, wetting diameter, and volumes was accomplished with DROPImage software. Droplets were placed on the GDM surfaces using an adjustable micropipette. For the sliding angle measurements, the stage rotation rate was set to 1° s−1 to reduce the effects of motion on the droplets. An image was taken at each degree until the droplet detached and fell from the surface. The angle at which this occurred was recorded as the maximum sliding angle and used to calculate adhesion force in Eq. 6. Examples of droplet behavior and advancing and receding angle data from this process are displayed in Figs. 5a and 5b. Initially, at sliding angle 0°, hysteresis is very low and differences between left and right angels can be attributed to the rough GDM surface which varies from point to point. As the sliding angle increases the droplet shifts forward causing the advancing angle to increase while the receding angle decreases. The sudden change in these angles at a sliding angle of around 10° are due to shifts in droplet pinning as the droplet wetting perimeter changes subtly to stabilize itself. Finally, at the incipient point, the droplet falls off and the maximum sliding angle is recorded, in this case it was 27°.
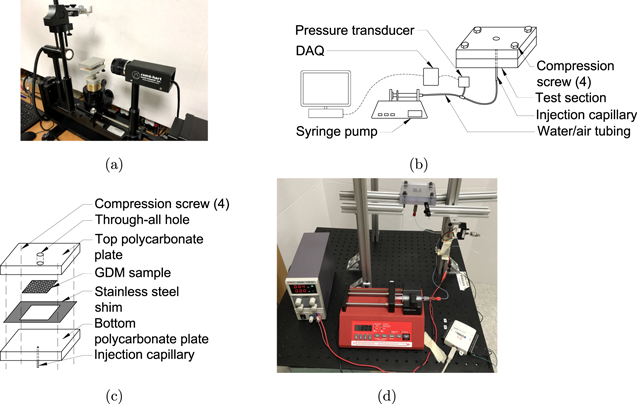
Figure 4. (a) Ramé-Hart 290 used for measuring contact angles, (b) schematic of the experimental setup used to measure the breakthrough pressure, and (c) schematic of the test section used to hold sample for breakthrough pressure experiments, and (d) setup used to measure the breakthrough pressure.
Download figure:
Standard image High-resolution image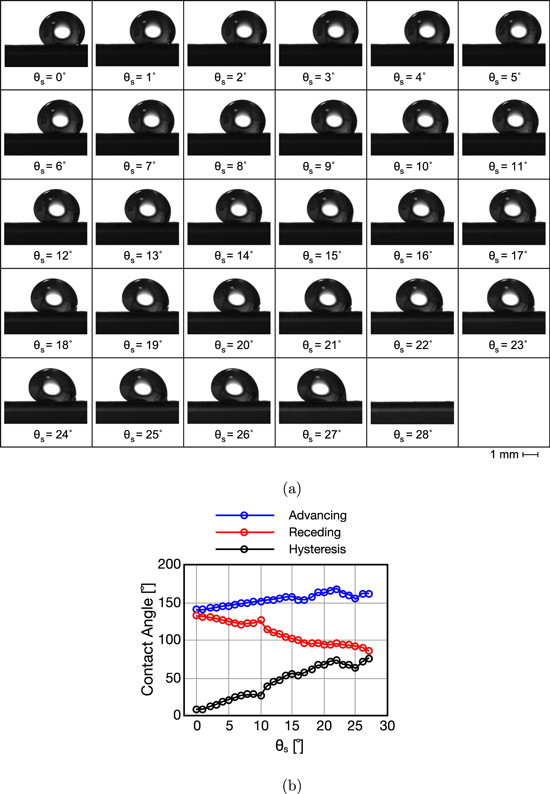
Figure 5. (a) Images of liquid water droplet deformation under the influence of gravity at different sliding angles until fall off on Toray 120, 5 wt% PTFE at θs ≈ 27°, and (b) advancing, receding, and contact angle hysteresis as functions of sliding angles.
Download figure:
Standard image High-resolution imageFluid injection system
The breakthrough pressure, defined as the pressure at which the solution emerges from the surface of the porous layer, was measured with an experimental setup schematically shown in Fig. 4b. In this setup, the aqueous NH3 was injected with a syringe pump to the bottom surface of the GDM sample at 300 μℓ h−1 flow rate and through a 250-μm-diameter stainless-steel capillary (U-111, Upchurch). The solution passed through the GDM and emerged from its top side, forming a breakthrough on the surface of the GDM. Therefore, the breakthrough occurred as the solution emerged from the surface of the GDL, on the side opposite to the injection capillary. GDM samples, prepared in 2 cm × 2 cm cuts, were sandwiched between two 0.5-inch-thick polycarbonate plates which were tightened with four screws, one in each corner of the test section. A stainless-steel shim with a thickness of 0.05 mm was inserted around GDM samples to provide a uniform compression. The injection pressure was measured at 50 Hz sampling rate and with a pressure transducer with a pressure range up to 11.7 kPa ± 1.0% (Omega, PX163-120BD5V). On the top polycarbonate plate (the emergence side), a 6-mm-diameter through-all hole was machined to eliminate any effects the GDM compression might have on the breakthrough process. For each GDM sample, three injection trials were conducted and the mean value of the three trials were considered as the breakthrough pressure. Experiments were conducted at room temperature. Table IV lists flow conditions considered in this study. The superficial velocity in this table refers to the bulk velocity of the solution within the stainless-steel capillary and is obtained by uf = q/πr2, where uf, q, and r are the superficial velocity, the volumetric flow rate, and the radius of the capillary, respectively.
Table IV. Flow conditions in this study.
| Nominal Solution | Flow Rate | Superficial Velocity | Viscosity | Surface Tension | Ca |
|---|---|---|---|---|---|
| [m3 s−1] | [m s−1] | [cP] | [mN m−1] | [–] | |
| 0% (pure H2O) | 8.33 × 10⁻¹¹ | 1.69 × 10⁻³ | 1.00 | 72.8 | 2.33 × 10⁻⁵ |
| 10% NH3 | 8.33 × 10⁻¹¹ | 1.69 × 10⁻³ | 1.15 | 63.5 | 3.08 × 10⁻⁵ |
| 20% NH3 | 8.33 × 10⁻¹¹ | 1.69 × 10⁻³ | 1.22 | 57.0 | 3.64 × 10⁻⁵ |
| 30% NH3 | 8.33 × 10⁻¹¹ | 1.69 × 10⁻³ | 1.21 | 52.2 | 3.94 × 10⁻⁵ |
Results and Discussion
Static contact angle
Liquid surface tension is related to a substances polarity. Water molecules are strongly attracted to each other due to a large dipole resulting from the differences in oxygen and hydrogen electronegativity and unsymmetrical bond shape27; water therefore exhibits a high surface tension. Ammonia, which is also polar, has a smaller dipole and a lower surface tension; therefore, increasing the concentration of NH3 reduces the solution's overall surface tension. Appendix A.3 outlines a method for calculating ammonia water solution surface tension. The effect of NH3 wt% on contact angle is displayed in Fig. 6. For each GDM type, droplets shifted toward less hydrophobic conditions at higher levels of NH3 due to the solutions reduced surface tension. Lower surface tension means liquid molecules are less attracted to each other and, in this case, more likely to wet the GDM surface. The surface tension is also plotted for reference in Fig. 6a for room temperature, using the methods of Appendix A.3. The effect of increasing PTFE content was probed using the Toray series GDM. Figure 6 results for water are similar to trends observed in earlier work. The addition of PTFE loadings greater than 10 wt% has diminishing effect on hydrophobicity. Figure 6c is the same data plotted with respect to NH3 wt%; overall, no clear differences between higher PTFE loadings and contact angle were observed. Generally, after 10 wt% PTFE wet-proofing the hydrophobicity does not increase significantly, therefore, higher PTFE content may not be necessary for electrode design in ammonia systems.
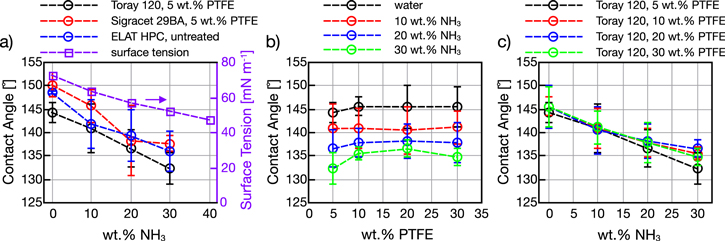
Figure 6. Droplet contact angles for different NH3 wt%, (a) for different GDM series, (b), (c) measured on Toray 120 and for different wt% PTFE.
Download figure:
Standard image High-resolution imageAdhesion
Adhesion of 18.97 ± 0.86 μℓ droplets to the GDM surface were measured on SGL 29 BA and Toray 120 5% PTFE loading GDMs. Data could be collected only up to 10 wt% NH3 as higher concentrations lead to droplets that failed to detach even at the maximum tilting angle of 90°. This is probably due to two factors: 1.) the reduced surface tension results in less hydrophobic conditions and 2.) the density of droplets at 30 wt% NH3 is ∼15% less than that of water so the net gravity force acting on them is reduced. Overall, these result in higher adhesion and insufficient gravity force rendering this method inadequate for these elevated concentrations. Larger volumes were not attempted as droplets greater than 20 μℓ have not been verified to give reliable results.21 Figure 7 displays the lower NH3 concentration adhesion data as well as total adhesion force calculated by multiplying by the wetting perimeter. Overall, the contact angle measurements show some agreement with nominal values of perimeter normalized adhesion force as the Toray 120 with 5 wt% PTFE, which had a lower contact angle than SGL, exhibits slightly higher adhesion. However, these values fall within the error tolerances and thus a correlation cannot be stated for certain. This fact highlights the usefulness of the sliding angle methodology which may capture adhesion behavior not accounted for by the contact angle measurements alone. Increasing NH3 had a clearer effect as adhesion was elevated by ∼16% in both cases while total force rose ∼22% for SGL and ∼6% for Toray. The results for the water adhesion are in the range of values reported in literature.20,21 These outcomes demonstrate that the addition of NH3 can increase adhesion force which has been shown to increase the barrier for liquid removal.
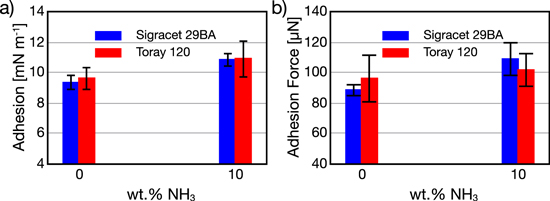
Figure 7. 10 wt% NH3 adhesion data compared to water.
Download figure:
Standard image High-resolution imageBreakthrough pressure
Figure 8 shows time series data from the liquid breakthrough process in Toray and Sigracet carbon papers. In all cases, pressure increases until a clear breakthrough point is observed. Pressure then falls quickly as fluid passes through the GDM forming a droplet on the surface. All runs conducted with carbon papers resulted in breakthrough while no breakthrough was obtained in runs with the ELAT sample. In Fig. 8a, higher NH3 concentration resulted in a longer injection duration before breakthrough which may be attributed to enhanced pore wetting due to lower surface tension. The pressure increased more slowly at higher concentrations as the lower surface tension enabled the solution to percolate more readily into the GDM pores thereby relieving the buildup of reservoir pressure. Therefore, it is expected that more pores are filled during the breakthrough process for the lower surface tension fluid. Considering the surface tension and the capillary number of the 10 wt% solution as datum, the surface tension and the capillary number of the 20 and 30 wt% solutions can be compared to qualitatively characterize transport phenomena. The surface tension of 20 and 30 wt% solutions are 10.2% and 17.7% less than the surface tension of the 10 wt% solution. Likewise, the capillary number of the 20 and 30 wt% solutions are 18.1% and 27.9% greater than the capillary number of the 10 wt% solution. This can be translated as the transport phenomena for the higher percentages of 20 and 30 wt% is more toward the stable displacement flow regime on the drainage phase diagram.23,28 Therefore, the percolation of the solution at higher concentrations (20 and 30 wt%) occurs relatively more uniform within the plane of the GDM, resulting in a relatively lower slope in Fig. 8a. While this explanation cannot be verified with the given setup, it may make an interesting candidate for X-ray based imaging studies.29 Increasing GDM thickness also increased the duration of time before breakthrough, however, for the same concentration it did not affect the pressure increase rate significantly. Thicker samples (of the same series) lead to higher breakthrough pressures as shown in Fig. 9. PTFE content had minimal effect on breakthrough pressure, meaning that a 10% PTFE loading can be implemented without restricting flow through the GDM. Finally, in Fig. 9c, increasing NH3 concentration in all cases lead to lower breakthrough pressure. Lower pressure can be attributed to both the lower surface tension, predicted in A3, as well as the lower measured contact angle. Overall, and based on the previous section's results, the Toray 30 series carbon paper with 10% PTFE may provide the highest surface hydrophobicity with minimal through plane transport resistance.
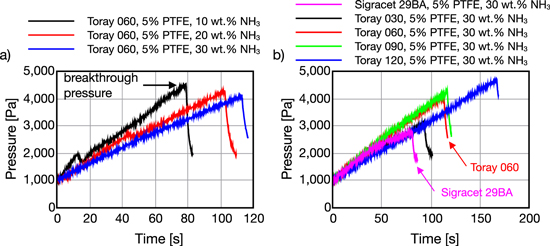
Figure 8. NH3 solutions injection pressure profiles for (a) different wt% NH3, and (b) different GDM thicknesses.
Download figure:
Standard image High-resolution image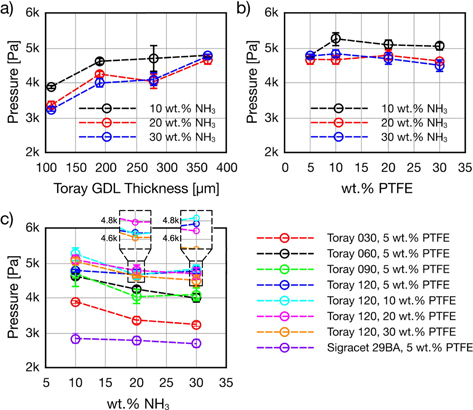
Figure 9. Breakthrough pressure for (a) different Toray thicknesses, (b) Toray 120 with different PTFE loadings, and (c) different wt% NH3.
Download figure:
Standard image High-resolution imageImplications for NH3 system design
In DAFC and NH3 electrochemical synthesis systems, bulk transport of reactants and removal of liquid byproducts is accomplished using pressure driven convective flow in channels. Decreasing contact angle and increasing adhesion force can have significant impact on liquid management and should be considered in future work. For example, several studies have analyzed droplet and gas bubble detachment behavior and highlighted that higher adhesion requires higher flow velocity for removal which also means more parasitic pumping losses.20 These results mean that regions where lower surface tension are present may require specific flow management strategies such as elevated flow rates. Increased adhesion and lower density also reduce the usefulness of gravity driven flow. All these items should also be considered for Air/NH3 Sol. scenarios where gas bubbles rather than droplets are present. Another tool for electrode design currently being developed is coupled continuum and pore network models which link CL with GDM and channel physics.30 The results uncovered in this work are useful to these pore network model inputs and demonstrate that liquid transport along an electrode may vary due to surface tension gradients. Finally, the effect of temperature on these properties may be of interest in future work as it impacts surface tension and viscosity.
Conclusions
In support of burgeoning research into ammonia based electrochemical energy conversion and storage systems, this study examined the wetting of commonly used carbon GDM electrode materials with aqueous ammonia solutions of various NH3 wt%. Key wetting parameters such as contact angle, adhesion force, and breakthrough pressure were experimentally measured. Additionally, the impact of GDM wet-proofing (PTFE loading) and thickness were examined to elucidate key trends. Such information is important toward improving multiphase transport performance in the electrode and reactant channel regions and this work is guided by prior efforts shown to be successful in PEFC literature. The investigations core findings are:
- 1.Increasing concentrations of ammonia result in lower surface tension which was shown to decrease the contact angle on GDM surfaces leading to less hydrophobic conditions. Increasing PTFE loading made the surface more hydrophobic; however, values above 10% did not have significant impact.
- 2.Adhesion was sensitive to ammonia concentration as 10% NH3 exhibited higher adhesion force than the pure water. This testing was limited as higher concentration NH3 droplets failed to detach as a result of higher adhesion and lower density.
- 3.Higher % NH3 concentration lead to lower breakthrough pressure due to its reduced surface tension and smaller contact angle. In addition, the capillary number increased at higher concentrations, suggesting relatively stronger stable displacement characteristics compared to lower concentrations and for the same injection flow rate. Thicker GDM lead to higher breakthrough pressure while PTFE loading did not have a significant impact on the results.
These outcomes should be useful to both experimental and modeling-based studies concerned with electrode design in electrochemical systems where liquid phase ammonia solutions are present. Similar to work in PEFCs, fundamental understanding of these liquid/electrode interactions will hopefully provide the basis for much progress and improvement in terms of thermo-fluid management strategies and material selection leading to overall enhanced system performance.
: Appendix: Thermal Physical Properties of Aqueous Ammonia Solutions
A.1. Density
The density of the aqueous NH3 solutions, ρsol, plotted in Fig. A·1, were estimated using a model developed by Conde31

where x is the wt% of NH3,  and
and  are the pure substance densities as a function of temperature, and
  is the excess density approximated by

where A is a parameter and a function of normalized solution temperature,  , made dimensionless by the critical temperature of water,
  = 647.14 K

Parameter A is defined as
where A1 and A2 are found in Table A·I. The density of each pure substance, L, ρL =  or
or  was calculated using

where A and b are parameters defined for each component in Table A·II, ρc,L is the critical density for each component ( ,
,  ) , and τ is calculated by

where the critical temperature for ammonia is  = 405.4 K.
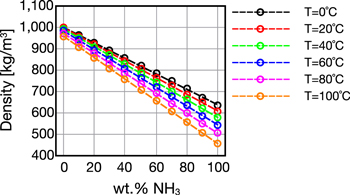
Figure A·1. Density of aqueous NH3 at different temperatures.
Download figure:
Standard image High-resolution imageTable A·I. A1 and A2 used in Eq. A·1·4.
| i = 0 | i = 1 | i = 2 | |
|---|---|---|---|
| A1 | −2.410 | 8.310 | −6.924 |
| A2 | 2.118 | −4.050 | 4.443 |
Table A·II. Values for A and b for H2O and NH3.
| H2O | NH3 | |||
|---|---|---|---|---|
| i | A | b | A | b |
| 0 | 1 | 0 | 1 | 0 |
| 1 | 1.993 771 843 | 0.333 333 | 2.024 912 83 | 0.333 333 |
| 2 | 1.098 521 16 | 0.666 667 | 0.840 496 67 | 0.666 667 |
| 3 | −0.5094493 | 1.666 667 | 0.301 558 52 | 1.666 667 |
| 4 | −1.761912427 | 5.333 333 | −0.20926619 | 5.333 333 |
| 5 | −44.90054803 | 14.333 33 | −74.60250177 | 14.333 33 |
| 6 | −723692.2619 | 36.666 67 | 4089.792 775 | 23.333 33 |
A.2. Viscosity
Viscosity for the NH3 solutions, ηsol, was calculated using the Grunberg-Nissan constituent model
where, Gij, is a binary interaction parameter.32 This model is dependent upon temperature and concentration, values over a wide range are plotted in Fig. A·2. For binary mixtures such as in the case of this work

where  and
and  are the pure substance viscosities of ammonia and water as a function of temperature. Figueiredo et al. estimated Gij using a quadratic function

which is valid for a temperature range of 283 K to 422 K.33 The pure liquid viscosities were calculated using correlations from Fernandes et al.32


Figure A·2. Mixture viscosity at different temperatures.
Download figure:
Standard image High-resolution imageA.3. Surface tension
Surface tension, γ, plotted in Fig. A·3, was calculated using a model developed by Conde31

where  , is defined as

where F(x) is calculated using

The surface tension for each pure substance as a function of temperature is calculated by

where the parameters γo,L, σ, and b are contained in Table A·III for each component.

Figure A·3. Mixture surface tension at different temperatures.
Download figure:
Standard image High-resolution image
Table A·III. Parameters γo,L, σ, and b.
| γo | σ | b | |
|---|---|---|---|
| NH3 | 91.2 | 1.1028 | 0.0 |
| H2O | 235.8 | 1.256 | −0.625 |