
Abstract
Finding new electrolyte additives could help create lithium-ion batteries with better performance at high voltage, allowing higher energy density. However, finding the perfect additive remains a tremendous challenge, since researchers still don't understand how to predict their performance. A new group of dioxazolone electrolyte additives have been tested in lithium-ion batteries alone or in combination with well-known co-additives. The new additives consist of a 3-phenyl-1,4,2-dioxazol-5-one (PDO) parent structure with or without (methoxy, fluoro and nitro) functional groups on the para position of the phenyl ring. It is found that PDO (no functional group) and p-(4-nitrophenyl)-1,4,2-dioxazol-5-one (pNDO) are the best performing dioxazolones overall and show promising results.
Export citation and abstract BibTeX RIS

This is an open access article distributed under the terms of the Creative Commons Attribution 4.0 License (CC BY, http://creativecommons.org/licenses/by/4.0/), which permits unrestricted reuse of the work in any medium, provided the original work is properly cited.
In order to sustain the current rapid growth of the renewable energy industry, including the electric vehicle and grid energy storage industry, it becomes increasingly important to improve the performance of current battery technologies. Lithium-ion batteries are one practical way to fulfill this need, especially when it comes to electric vehicles. An important low-cost approach to improve the performance of lithium-ion batteries is by replacing current electrolyte additives used in the industry with new ones or by finding new additive blends. Well-known electrolyte additives are vinylene carbonate (VC),1–4 fluoroethylene carbonate (FEC),5–7 1,3,2-dioxathiolane-2,2-dioxide (DTD, also named ethylene sulfate),8–10 prop-1-ene-1,3-sultone (PES),4,11–13 methylene methane disulfonate (MMDS),14–16 lithium difluorophosphate (LFO),17–21 tris(trimethylsilyl) phosphite (TTSPi)14,22,23 and pyridine boron trifluoride (PBF).24–27 Some of these (VC, DTD, PES, MMDS, LFO and TTSPi) have been used in this work as co-additives. Past work using 3-R-1,4,2-dioxazol-5-ones as electrolyte additives has been promising.28,29 For example, our group showed that cells prepared with 3-phenyl-1,4,2-dioxazol-5-one (PDO), as a single additive or as part of an additive blend, outperformed cells prepared with VC during long-term cycling of LiNi0.6Mn0.2Co0.2O2 (NMC622)/graphite pouch cells at 40 °C.29 Based on DFT calculations and dQ/dV experimental data, PDO has been suggested to primarily act by partially passivating the negative electrode.29 The present work presents the electrochemical evaluation of newly synthesized 3-R-1,4,2-dioxaol-5-one additives in lithium-ion pouch cells. Further, new PDO-based additive blends were evaluated. New electrolyte chemistries for improved cell lifetime are identified and discussed.
Experimental Methods
Additive synthesis
PDO was synthesized in our lab from benzohydroxamic acid and N,N'-carbonyldiimidazole using the method of Park et al. that was used in the past by our group and by Röser et al.28–30 The new dioxazolone additives pMODO, pFDO and pNDO were made in our lab starting from acyl chlorides using the one-pot synthesis method of Hynes et al.31 Synthesis methods and product purity, estimated by NMR, are given in Ref. 31. The 1H NMR of PDO is shown in Fig. S13 (available online at stacks.iop.org/JES/167/080540/mmedia). The peak at 8.2 ppm could be due to benzoic acid, an impurity. However, a purity of 94% is estimated for PDO.
Pouch cells and electrolyte preparation
The pouch cells used in this study were Li(Ni0.6Mn0.2Co0.2)O2 (NMC622)/graphite (gr) cells with either polycrystalline or single crystal positive electrode active materials. In this article, the single crystal cells are denoted NMC622(sc)/gr, while the polycrystalline cells are simply denoted NMC622/gr. Most of the present work used NMC622/gr cells, while only the last two figures of the paper show NMC622(sc)/gr data. The positive electrode particles were coated with proprietary coatings and the cell capacities at 4.3 V were ∼250 mAh during the first cycle. Furthermore, the cells were received dry (no electrolyte) and sealed from the manufacturers. Before the beginning of the experiments, each cell was cut open in an argon atmosphere and heated under vacuum at 80 °C for 14 h in order to dry them further. Electrode loadings, active areas and electrode compositions are shown in Tables SVI and SVII. All cells are balanced at 4.4 Volts meaning at 4.4 V, the N/P ratio is 1:1.
The control electrolyte used in this study was generally 1.2 M LiPF6 (Shenzhen Capchem, ≥99.9%) EC:EMC:DMC 25:5:70 (BASF, <20 ppm H2O). However, exceptions exist. For example, some cells used EC:EMC 3:7 (BASF, <20 ppm H2O) or EC:DMC 3:7 (BASF, <20 ppm H2O) as the solvent. Note that these exceptions are mentioned where they apply. The main additives used in this study were 3-phenyl-1,4,2-dioxazol-5-one (PDO), p-(4-methoxyphenyl)-1,4,2-dioxazol-5-one (pMODO), p-(4-fluorophenyl)-1,4,2-dioxazol-5-one (pFDO) and p-(4-nitrophenyl)-1,4,2-dioxazol-5-one (pNDO), while the co-additives used were 1,3,2-dioxathiolane-2,2-dioxide (DTD, i.e. ethylene sulfate, Guangzhou Tinci Materials Tech. Co. Ltd., ≥98%), lithium difluorophosphate (LFO, Shenzhen CapChem Tech. Co. Ltd.), vinylene carbonate (VC, BASF, ≥99.8%), prop-1-ene-1,3-sultone (PES, Lianchuang Medical Chemistry Co., 98%), methylene methyl disulfonate (MMDS, Guangzhou Tinci Materials Tech. Co. Ltd., 98.7%) and tris(-trimethyl-silyl)-phosphite (TTSPi, Sigma-Aldrich, >95%). Every pouch cell was filled with 1.0 g of electrolyte in an argon-atmosphere environment and then vacuum-sealed at a gauge pressure of −90 kPa and a heat-sealing temperature of 165 °C using a compact vacuum sealer (MSK-115A, MTI Corp.). Then, the cells were wetted and formed as described in the Formation subsection. Most measurements reported in this work were performed on a minimum of two replicate pouch cells to ensure experimental precision.
Formation
Immediately following filling with electrolyte, cells were maintained at 1.5 V and at room temperature for 24 h to allow time for the electrolyte to fully wet the electrodes. However, two 2% PDO, two 2% pNDO cells and all cells tested in an in situ gas apparatus were wetted at 40.0 °C ± 0.1 °C. The two 2% PDO cells were wetted at 1.5 V and 40.0 °C for 24 h in order to confirm the volume of created gas during wetting in an in situ gas apparatus as shown in Fig. 6. The two 2% pNDO cells were charged from open circuit potential (∼0.1 V) to 3.2 V at C/20 and 40.0 °C in order to confirm the DFT predicted reduction potential of pNDO. The resulting data is shown in Fig. 5. After initial volume measurement and wetting, all the other cells were moved into temperature boxes at 40.0 °C ± 0.1 °C and connected to a Maccor series 4000 for formation. Cells were held at 1.5 V for 30 min to allow time for the temperature to stabilize before they were charged at C/20 to 4.3 V and then discharged at C/20 to 3.8 V.
Full cell reference curve
In order to have a better idea, in Figs. 4 and 5, of the amount of charge consumed by additives during cell formation via a capacity vs voltage Q(V) curve, graphite/Li and NMC622/Li half-cells were built. These cells were made in order to construct a differential voltage (dV/dQ) curve of a full cell. Each half-cell was filled with ∼20 mg of electrolyte. The electrolyte used was 1.2 M LiPF6 EC:EMC 3:7 and the half-cells were cycled for 2 cycles at C/20. For the graphite/Li half-cell, the Q(V) data from the second cycle was used, while for the NMC622/Li half-cell, the Q(V) data from the first cycle was used. dV/dQ analysis was used to determine the active mass and capacity slippage of each full-cell electrode using established methods.32–36 From the dV/dQ analysis, a full-cell capacity vs voltage Q(V) reference curve could be built, as shown in Figs. 4 and 5.
Quantification of gas volume ex situ using Archimedes' method
The volume of gas produced during formation and during storage was measured ex situ using the Archimedes' principle. Before and after formation, as well as before and after storage, cells were suspended under an analytical balance (Shimadzu model AUW220D) by a metal wire and submerged in a beaker full of water. Note that cells were degassed after formation (after the second volume measurement). The volumes of gas produced during formation and storage were then calculated using the apparent change in weight due to the displacement of water, assuming the density of water at room temperature is ∼1.0 g ml−1.
Quantification of gas volume in situ using the measuring Archimedes' gas expansion (MAGE) apparatus
The evolution of gas during formation was measured using the MAGE apparatus as described previously.37 All measurements using the MAGE were done at 40 °C ± 2 °C, including the wetting of the cells. First the cells were wetted at 1.5 V for 24 h. The cells were then charged at a constant current (CC) of C/20 to 4.3 V. Then the voltage was kept constant at 4.3 V for 24 h. CC charging at C/20 to 4.4 V and constant voltage of 4.4 V for 24 h followed. Finally, the cells were charged at C/20 to 4.5 V at CC and kept at that voltage for 24 h and then the cells went on open circuit condition.
Electrochemical impedance spectroscopy (EIS)
EIS spectra were measured using a Bio-Logic VMP3 (Seyssinet-Pariset, France) using a sinusoidal amplitude of 10 mV over the frequency range 10 mHz–100 kHz. Pouch cells were maintained at 10.0 °C ± 0.1 °C in a wide range thermal chamber (Novonix, Canada) and all cells had a voltage of 3.8 V during EIS measurements. This cell voltage was originally chosen as it is near 50% SOC and has since been demonstrated to be a reliable choice for giving precise EIS measurements with a wide range of cell chemistries.38,39 In this work, Rct represents the difference along the x-axis between the high and low frequency minima in the Nyquist plots. In the case where two semi-circles were present in the Nyquist plots, Rct is defined here as the combined width of both semi-circles. In these cases, Rct includes contributions from many processes, for example lithium solvation/de-solvation and SEI film resistance.39–41 The Nyquist plots of the most relevant electrolyte (the ones containing a dioxazolone compound with or without 1% DTD) can be found in the supplementary material.
High temperature storage
Following formation and degassing, each relevant cell was placed in a temperature box at 40.0 °C ± 0.1 °C and connected to a Maccor series 4000 battery tester. Two cycles at constant current (C/10) were executed between 2.8 V and 4.3 V starting with a discharge. At the end of the protocol, the voltage was held at 4.3 V for 24 h. Then the cells were transferred to 60.0 °C ± 0.1 °C temperature boxes and connected to an automated storage system.42 Finally, their open circuit voltages were measured every 6 h for a period of 500 h.
Long term cycling and Ultra-High Precision Coulometry (UHPC) cycling
Each relevant cell was placed in a temperature-controlled chamber at 40.0 °C ± 0.1 °C and connected to a Neware battery cycler. The protocol used for long term cycling consisted of C/3 cycles between 3.0 V and 4.3 V using a CCCV charging profile (C/3 constant current to the top-of-charge, followed by a constant voltage step until the measured current decreased to ≤C/20) and a CC (C/3 constant current) discharge. A constant current C/20 cycle was performed every 50 cycles to assess what fraction of the capacity loss was due to cell impedance growth vs irreversible capacity losses. Plots showing changes to discharge capacity during cycling are normalized to the third cycle. However, in one figure (Fig. 7) the actual discharge capacities of the cells are shown so reader can notice that the cells are very reproducible and that the additives do not change actual initial capacities significantly.
Furthermore, ultra-high precision coulometry was done using the UHPC chargers at Dalhousie University.43 NMC622(sc)/gr cells were cycled between 3.0 V and 4.3 V at C/20 and at a temperature of 40 °C.
Density functional theory (DFT)
All computational chemistry calculations were done using the Gaussian software package (G09.a02).44 Geometry optimizations and thermochemistry calculations were done using the B3LYP functional at the 6-311++G(2df,2pd) level. To simulate solvation effects the integral equation formalism polarizable continuum model (IEFPCM)45,46 was used with the dielectric constant (ε) of the electrolyte set to 20.47,48 It is important to keep in mind that IEFPCM gives only an approximate representation of solvation effects and behaviors.49 However, due to its balance of speed and accuracy, this model is here preferred over more computationally expensive approaches.50–53 All optimized geometries were tested by normal mode analysis and have only positive (real) vibrational frequencies. Standard electrode potentials are reported relative to the standard lithium electrode in the same solution and were calculated as described previously, using Eref = 1.44 V.47,50 Thermal contributions to the Gibbs free energy were calculated by normal mode analysis at room temperature (25 °C).
Oxidation and reduction standard potentials of a molecule of interest S can be calculated using a method described previously47 from the general formula for oxidation [1] and reduction [2]:


Optimized energies and molecular geometries are provided as supplemental material.
Results and Discussion
Evaluation of new 3-R-1,4,2-dioxazol-5-one electrolyte additives
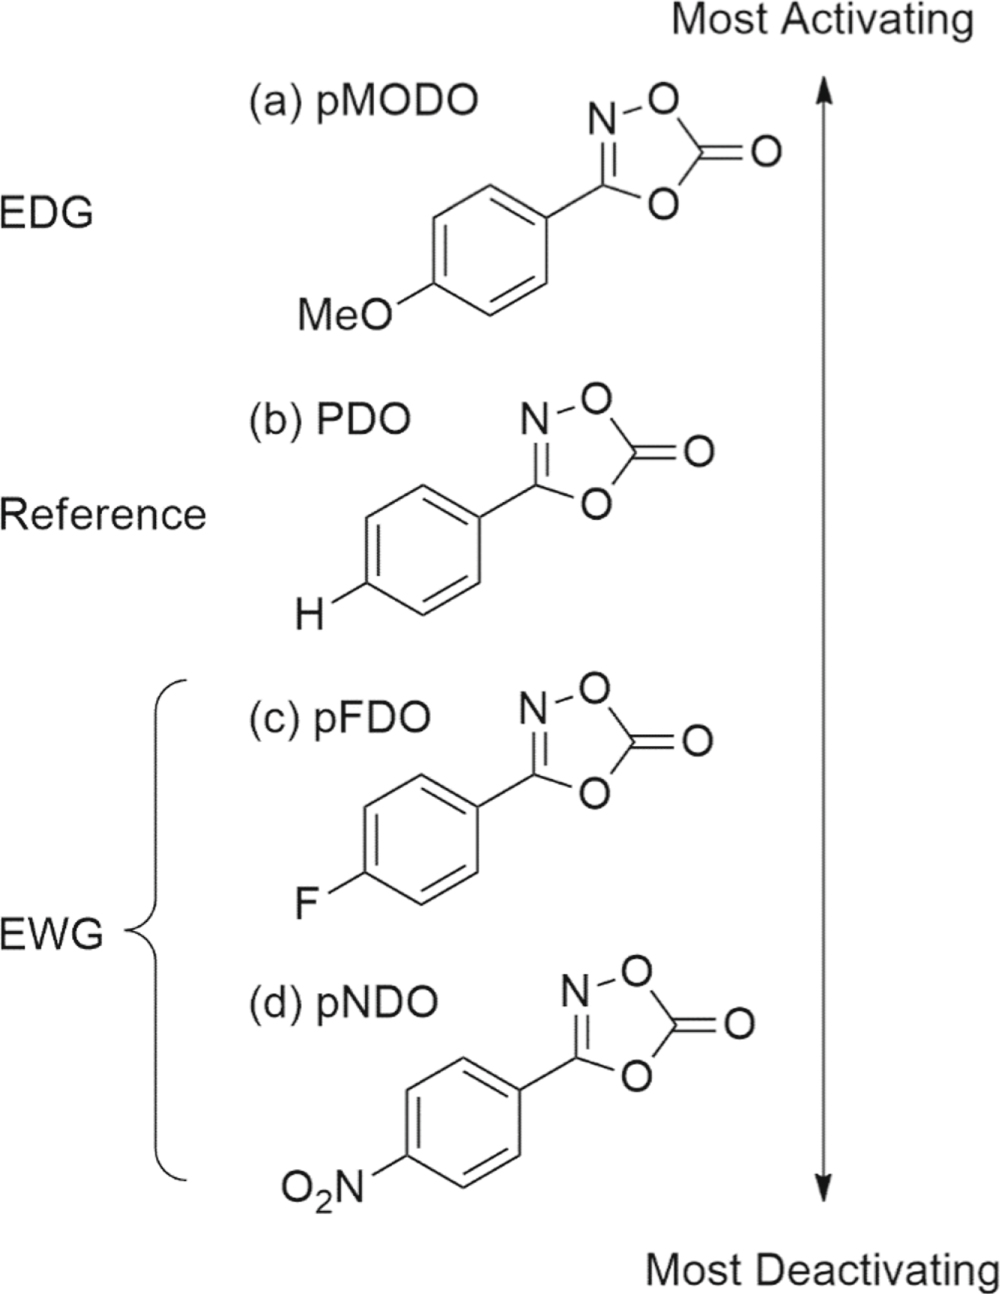
The present work was motivated by previous investigations into PDO and the structurally related electrolyte additive 3-methyl-1,4,2-dioxazol-5-one.28,29 In a two-pronged effort to identify new additives and to understand the relationship between chemical structure and additive performance, new additives were synthesized for testing in lithium-ion cells. Three new compounds were considered in this work, based on the structure of PDO with the substitution of the para hydrogen on the phenyl moiety with methoxy, fluoro, or nitro functional groups (Fig. 1). The compounds, synthesized by the one-pot method of Hynes et al.,31 are 3-(4-methoxyphenyl)-1,4,2-dioxazol-5-one (pMODO), 3-(4-fluorophenyl)-1,4,2-dioxazol-5-one (pFDO) and 3-(4-nitrophenyl)-1,4,2-dioxazol-5-one (pNDO). These functional groups were chosen for their wide range in relative electron donating or electron withdrawing properties. Relative to the phenyl parent structure, methoxy is an electron donating group (edg), while fluoro and nitro are electron withdrawing groups (ewgs).
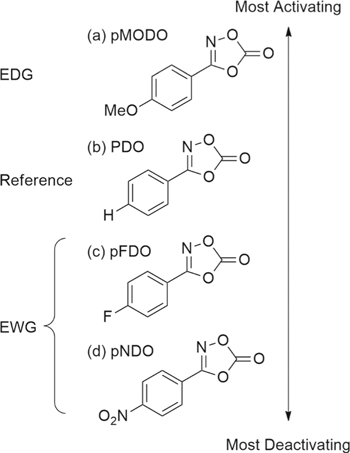
Figure 1. Molecular structures of (a) 3-(4-methoxyphenyl)-1,4,2-dioxazol-5-one (pMODO), (b) 3-phenyl-1,4,2-dioxazol-5-one (PDO), (c) 3-(4-fluorophenyl)-1,4,2-dioxazol-5-one (pFDO) and (d) 3-(4-nitrophenyl)-1,4,2-dioxazol-5-one (pNDO). The compounds are arranged by the relative activating or deactivating nature of the substituents at the para position of the phenyl moiety (EDG = electron donating group; EWG = electron withdrawing group).
Download figure:
Standard image High-resolution imageElectrolyte solutions were prepared with the three new additives and tested in NMC622/gr pouch cells. It is useful to first examine the effects of any new electrolyte chemistry on the cell formation cycle, the first time a cell is charged. It is during this cycle that an initial SEI is formed at each electrode. Although the SEIs will continue to form and evolve, the SEI formed during this first cycle is very important and directly affects cell lifetime and performance. The differential capacity (dQ/dV) of NMC622/gr cells prepared with PDO, pMODO, pFDO, or pNDO are compared with VC-containing and control (i.e., additive-free) NMC622/gr cells (Fig. 2). In the absence of electrolyte additives, a reduction peak is observed at ∼2.9 V, corresponding to the reduction of ethylene carbonate (EC) at the graphite electrode.29 The differential capacity measured from VC-containing cells show the expected reduction peak at ∼2.8 V, attributable to the electrochemical reduction of VC.54 The absence of the EC reduction feature at ∼2.9 V indicates that the SEI formed by VC reduction effectively passivated the graphite electrode surface.1 Two reduction features were measured from PDO-containing cells at ∼2.2 V and ∼2.5 V, consistent with the reported formation behavior.29 These peaks are also present in the differential capacity plots measured from cells prepared with pMODO or pFDO, whereas the cell with pNDO does not display any reduction features in the 2.0–3.2 V range. The EC reduction feature is suppressed but still present in PDO- and pMODO-containing cells, suggesting partial passivation of the graphite electrode. In contrast, the EC reduction peak is not present in cells made with pFDO or pNDO, indicating these additives are very effective at passivating the negative electrode surface. Since pNDO doesn't show any reducing peaks in the 2.0–3.2 V range, the passivation of the graphite electrode against EC reduction may seem contradictory. This apparent inconsistency will be discussed and explained later in the text.
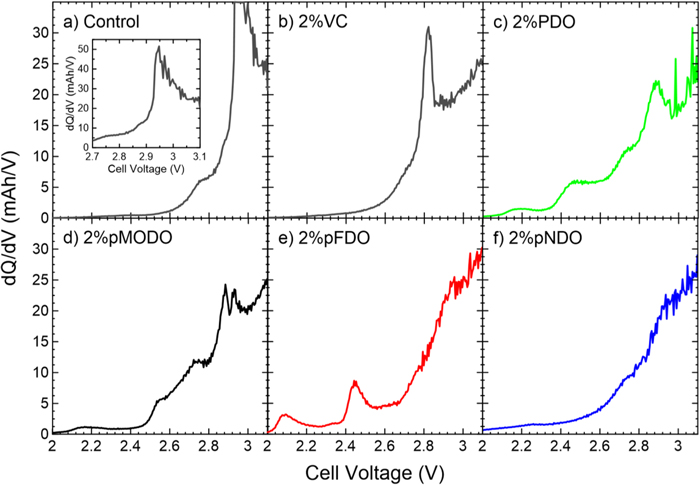
Figure 2. Differential capacity (dQ/dV) as a function of cell voltage during the formation cycle of NMC622/gr pouch cells measured at C/20 and 40.0 °C. Cells contained (a) additive-free control electrolyte or (b) 2% VC, (c) 2% PDO, (d) 2% pMODO, (e) 2% pFDO, or (f) 2% pNDO. Electrolytes contained 1.2 M LiPF6 in EC:DMC 3:7 (a)–(c) or in EC:EMC:DMC 25:5:70 (d)–(f). The inset shows the reduction of EC in control cells.
Download figure:
Standard image High-resolution imageDFT calculations are an attractive approach to predict the electrochemistry happening at each electrode, which is directly related to cell performance.. DFT calculations have been used by researchers to identify and understand these electrochemical reactions, especially to assign reduction features in dQ/dV graphs like the ones seen in Fig. 2.24,55–60 This approach can also be used to better understand the passivation of the graphite electrode for cells containing 2% pNDO. Table I shows DFT results for the absolute Gibbs free energies of the geometry-optimized additive species, including the products of one-electron oxidation or reduction. The corresponding standard potentials for oxidation and reduction were evaluated relative to the standard lithium electrode, according to established methods.47,61 In the case of reduction, a lithium ion is involved in the structure and the Gibbs free energy is calculated for five different lithium-ion sites, as shown in Fig. 3. The reduction potential can then be calculated using the lowest Gibbs free energy of the five sites. The cell voltages corresponding to the standard reduction potentials were calculated as described before.62 The cell voltages at which pFDO and PDO reduce are very similar (2.25 V and 2.24 V), while it is larger for pMODO (2.42 V) and much smaller for pNDO (0.78 V). As an example, the reduction product of PDO is shown in Fig. S6.
Table I. DFT-calculated absolute Gibbs free energies of unreacted, oxidized, and reduced pMODO, PDO, pFDO and pNDO in keV at 298.15 K. The Gibbs free energies of the reduced molecules were calculated for five different lithium atom sites (site 1–5) as illustrated in Fig. 3. The oxidation potentials and reduction potentials are shown relative to the standard lithium electrode (Li/Li+). The corresponding cell voltages are also shown in the case of reduction assuming a NMC622 cathode material.
| pMODO | PDO | pFDO | pNDO | |
|---|---|---|---|---|
| Unreacted (keV) | −19.12730 | −16.01051 | −18.71213 | −21.57734 |
| Oxidized (keV) | −19.12085 | −16.00342 | −18.70509 | −21.56976 |
| Reduced (keV) | ||||
| Li+ at site 1 | −19.33338 | −16.21680 | −18.91838 | −21.78473 |
| Li+ at site 2 | −19.33338 | −16.21674 | −18.91839 | −21.78473 |
| Li+ at site 3 | −19.33325 | −16.21663 | −18.91825 | −21.78456 |
| Li+ at site 4 | −19.33348 | −16.21686 | −18.91848 | −21.78470 |
| Li+ at site 5 | −19.33314 | −16.21655 | −18.91814 | −21.78515 |
| Eox (V vs Li/Li+) | 5.01 | 5.65 | 5.61 | 6.14 |
| Ered,1 (V vs Li/Li+) | 1.08 | 1.26 | 1.25 | 2.72 |
| Ered,1 (Vcell) | 2.42 | 2.24 | 2.25 | 0.78 |
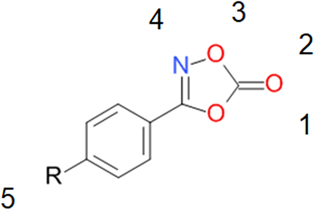
Figure 3. Illustration of the lithium ion sites 1 to 5 used in the DFT-calculation in order to deduce the reduction potentials of all dioxazolones studied in this work. Each number indicates the position at which a lithium ion was placed to calculate the corresponding reduction potential. It is noted that each molecular geometry was optimized before the single point energy calculations were performed. In addition to the inclusion of a lithium-ion, an electron was transferred to the molecule before optimization in order to calculate the reduction potential of each dioxazolone.
Download figure:
Standard image High-resolution imageThe calculated electrode potentials were then compared with the experimental features in the formation dQ/dV plots (Fig. 2). For PDO, pMODO and pFDO, the two peaks present at ∼2.2 V and ∼2.5 V are very close and care must be taken in assigning these peaks to the DFT results. The slight difference between the calculation results in the present work and those reported by Hall et al. are attributable to their use of the double hybrid functional M06-2X, rather than the B3LYP functional used in the present work.29 This difference does not affect the important conclusion that the DFT results are consistent with the experimental results for these three additives. The results shown in Fig. 4 suggest that the peaks at ∼2.5 V might be the ones matching the DFT results (the integrals of the peaks at ∼2.2 V in Fig. 2 are small). The ∼2.5 V peaks and the DFT results also seem to follow the same trend (e.g. pMODO reduces at higher cell potential than the other dioxazolones). For pNDO, the DFT result suggests that it is very likely that pNDO reduces at a very low cell voltage (0.78 V), which explains why a peak can't be seen in Fig. 2. This could also explain the passivating nature of pNDO. Note that this hypothesis will be confirmed later in the text. The proposed first reduction product of pNDO is shown in Fig. S1.
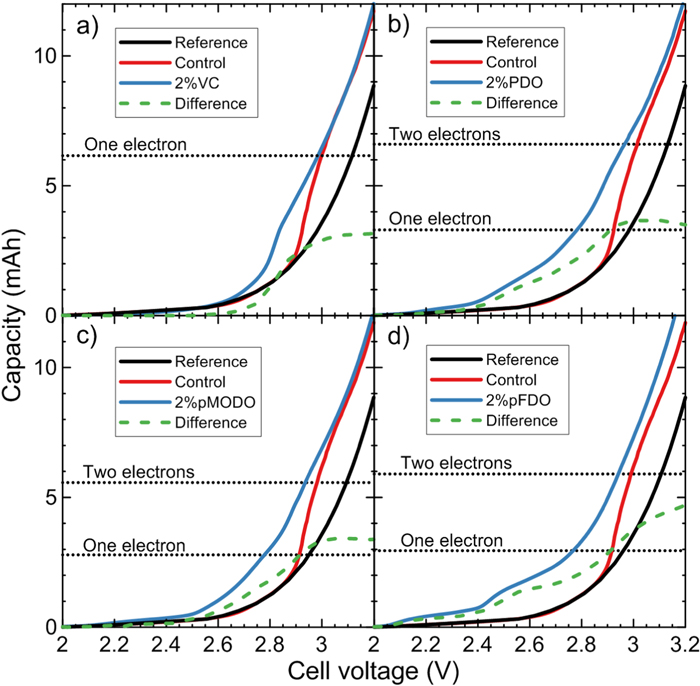
Figure 4. Capacity as a function of cell voltage of (a) 2% VC, (b) 2% PDO, (c) 2% pMODO and (d) 2% pFDO NMC622/gr pouch cell. The results are compared to those from a control cell and also a full cell reference curve obtained from NMC622B/Li and Graphite/Li half-cells data as explained in the experimental methods section. The reference curve should show no features due to reduction of solvents or additives since the second cycle of the graphite half-cell is used to create the reference curve. (a) and (b) used 1.2 M LiPF6 in EC:DMC 3:7 as the control electrolyte, while (c) and (d) used 1.2 M LiPF6 in EC:EMC:DMC 25:5:70 as the control electrolyte. The difference curve (green dash curve) correspond to the difference between the "electrolyte additive curve" (blue curve) and the reference curve (black curve).
Download figure:
Standard image High-resolution imageCapacity vs cell voltage curves of the other dioxazolones were compared to the reference curve in Fig. 4. 2% VC is included in the figure as a comparison. Since this measurement is sensitive to any overpotentials, care is needed while comparing and interpreting these curves and the difference curves in Fig. 4. The same applies for Fig. 5. The corresponding capacity in mAh for a one, two and three electron(s) reduction for each additive was calculated and included in Figs. 4 and 5 (see Table SVIII for the exact numbers and the molecular masses that were used). In Fig. 4a, the difference curve tells us that the reduction of 2% VC is about half an electron. While half an electron seems unexpected, this apparent oddity can be explained by two possible processes. The first is the passivation of the graphite electrode by half of the VC, while the other half doesn't reduce and stays in the electrolyte. The other is a one electron reduction of a VC molecule forming a radical, which can polymerize to poly(VC) without the use of further electrons, except during chain termination.63,64 In reality, a mix of both phenomena likely happens at the same time. The number of electrons involved per molecule during any initial electrochemical reduction is difficult to measure, for example if some fraction of the molecules react chemically (i.e., not electrochemically, for example by polymerisation) or if some fraction of the molecules do not react at all (e.g., due to the passivation of the graphite electrode). If no passivation or polymerization occur, the measured number of electrons per molecule is directly related to the electrochemical pathway of the reduction process or processes. Note that the results found for 2% VC in Fig. 4a) are consistent with past work by Petibon et al.65 However, the differences between Fig. 4a and the results found by Wang et al.66 are possibly due to differences in the graphite materials used (e.g. different specific surface area).
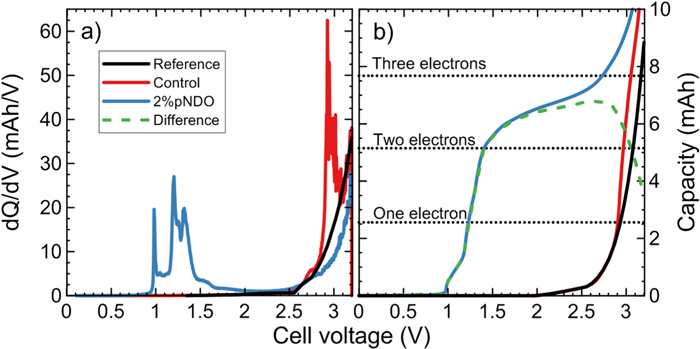
Figure 5. (a) Differential capacity (dQ/dV) and (b) capacity as a function of cell voltage of a control and a 2% pNDO NMC622/gr pouch cell. The cells are compared to the full cell reference curves obtained from NMC622B/Li and Graphite/Li half-cells data. Following an initial 15 min rest at 40 °C, the cells were charged at C/20 from 0 V to 3.2 V. In (b), the difference curve (green dash curve) correspond to the difference between the "electrolyte additive curve" (blue curve) and the reference curve (black curve). The cells contained 1.2 M LiPF6 in EC:EMC:DMC 25:5:70 as the control electrolyte. The decrease in capacity above 2.7 V in Fig. 5b for the difference curve could be due to an overpotential, since a shift is present in the same voltage range between the 2% pNDO data and the reference curves in Fig. 5a.
Download figure:
Standard image High-resolution imageSince 2% PDO and 2% pMODO didn't fully passivate the graphite electrode against EC reduction in Figs. 2c and 2d, it can be expected that the data in Figs. 4b and 4c give a very good idea of the number of electrons used during the reduction of PDO and pMODO. As such, it is likely that one electron per molecule is used by those two additives during their reduction. It is difficult to explain the first peaks in the 2.2 V region in Figs. 2c, 2d and 2e. Since the used capacity in the 2.2 V region is low, those peaks may be due to impurities. However, those peaks could also be explained by an unknown mechanism. Further studies are needed to understand the peak in the 2.2 V region.
Figure 2e shows that 2% pFDO did passivate the graphite electrode against EC reduction in Fig. 2e. Noting that the dashed curve in Fig. S8 (an extension of Fig. 4d above 3.2 V) reaches a maximum of 5 mAh at a cell voltage of 3.3 V, it is uncertain if the reduction of 2% pFDO is a one or two electron process. In fact, the passivation of the graphite electrode makes us wonder if all the pFDO in the electrolyte got reduced or not. More studies are needed to determine the number of electron transfered to pFDO molecules during reduction and to propose a mechanism that agrees with all experimental data.
In order to confirm the DFT prediction that pNDO reduces at 0.78 V, two 2% pNDO NMC622/gr cells were charged from 0.0 V to 3.2 V at C/20 and 40 °C after a 15 min rest at the same temperature. Two control cells only containing 1.2 M LiPF6 in EC:EMC:DMC 25:5:70 were also charged under the same conditions in order to make sure that any reduction peaks are indeed due to pNDO. The differential capacity (dQ/dV) results as a function of cell voltage are shown in Fig. 5a. Figure 5b shows the same data, but in a capacity vs voltage format. The 2.0–3.2 V region in Fig. 5a shows results that are consistent with Fig. 2. A peak at ∼1.0 V with an onset at ∼0.9 V in Fig. 5a, which is not present for the control cells, agrees with the DFT prediction. Further peaks are present in the 1.2–1.5 V regions, which are likely due to further reductions of pNDO.
In order to better understand the nature of these peaks, a DFT calculation and geometry optimization of pNDO with two lithium atoms describing a second reduction of pNDO, was performed. One lithium atom was placed in site 5 and the second in site 2 as indicated in Fig. 3 and Fig. S2. These sites were chosen based on the free energies shown in Table I for each lithium site. Since sites 2 and 5 correspond to the ones that have the two lowest free energies for LipNDO, these sites were chosen for the second reduction of pNDO. It is found that the second reduction potential of pNDO is 1.75 V vs Li/Li+ which corresponds to a cell voltage of 1.75 V. This result provides a suggestive explanation of the peaks in the 1.2–1.5 V regions, within DFT errors. However, it can only explain one peak. The third peak may be due to a third reduction. At first, this may seem contradictory with Fig. 5b. However, the passivation of the graphite electrode by pNDO against EC reduction in Fig. 5a is consistent with the possibility that some pNDO molecules may be still present in the electrolyte after the passivation. Furthermore, an overpotential could also explain the apparent contradiction. As a result, Fig. 5b would underestimate the number of electrons used during the reduction of pNDO. Considering this possibility, DFT was used to calculate the third reduction of pNDO (lithium ions being present in sites 1, 2 and 5; these sites were chosen based on the free energies shown in Table I for each lithium sites. In this configuration, pNDO would likely decompose into lithium carbonate and a lithium p-nitrobenzonitrile radical according to our DFT results. Figures S3 and S4 show these DFT results. It is found, using DFT, that the third reduction potential of pNDO is 5.96 V vs Li/Li+, showing that this decomposition will happen immediately after the second reduction, further supporting this hypothesis. It is likely that the lithium carbonate then contributes to the negative SEI and that the lithium p-nitrobenzonitrile radical react further. However, extensive experiments are needed to fully confirm this proposed pathway, which would comprise a complete study that is outside the scope of the present work. It is acknowledged that the accuracy of B3LYP methods is not fully known for such highly reduced compounds, which may have significant localization of charge density. Nonetheless the results of this analysis are expected to provide useful insight on reactivity trends.
It was next considered whether the DFT-calculated HOMO and LUMO energies of each dioxazolone additive can be related to cell performance (Table II). From that table, it can be concluded that the LUMO energies follows the same trend as the reduction potentials and the HOMO energies follows the same trend as the oxidation potentials. Furthermore, EC and VC have the largest band gap, followed by PDO, pFDO, pMODO and pNDO. These results will be compared to experimental results later in the text.
Table II. DFT-calculated HOMO, LUMO and band gap energies of EC, VC, pMODO, PDO, pFDO and pNDO. The energies were obtained following a geometry optimization using the B3LYP functional at the 6–311++G(2df,2pd) level. IEFPCM was used to model the surrounding electrolyte using a permittivity of 20.
| HOMO (eV) | LUMO (eV) | Band gap (eV) | |
|---|---|---|---|
| EC | −8.73 | −0.20 | 8.53 |
| VC | −7.28 | −0.29 | 6.99 |
| pMODO | −6.67 | −1.90 | 4.77 |
| PDO | −7.37 | −2.14 | 5.23 |
| pFDO | −7.30 | −2.13 | 5.17 |
| pNDO | −7.85 | −3.46 | 4.39 |
Figure 6 shows in situ gas data during formation at 40 °C for cells with electrolytes containing 2% PDO or 2% pNDO compared with control electrolyte. All three electrolytes contain 1.2 M LiPF6 EC:EMC:DMC 25:5:70 as the main component. Figure 6a shows the cell voltage vs time for each cell during the 250 h in situ gas measurement. Figure 6b shows the volume change measured as a function of time, while 6c shows it as a function of cell voltage. pNDO and control cells start producing gas around 3 V. The gases emitted by control cells during reduction contain ethylene, carbon dioxide and other gases,67 while the gas emitted by pNDO cells may be due, directly or indirectly, to lithium p-nitrobenzonitrile radicals reacting further and the products could possibly oxidize at the positive electrode. Control cells produce more gas than pNDO below 4.3 V, but pNDO cells start producing more gas than control cells above 4.3 V. pNDO cells slowly continue to create gas in open circuit conditions, and control cells start consuming gas, as has been noted by Ellis et al.68
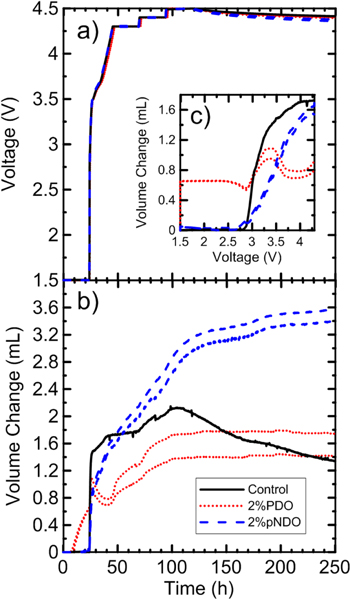
Figure 6. Volume change of control, 2% PDO and 2% pNDO in NMC622/gr cells during formation at 40 °C ± 2 °C using an in situ gas apparatus. The control electrolyte used was 1.2 M LiPF6 EC:EMC:DMC 25:5:70 for all three cells, to which the additives were added. The graph shows (a) the voltage vs time, (b) the volume change vs time and (c) the volume change vs voltage of these cells.
Download figure:
Standard image High-resolution imageControl and 2% pNDO cells don't create any net change in gas volume while wetting at 1.5 V and 40 °C while 2% PDO cells produced 0.6 ml of gas and consumed 54 mAh of charge during this period (see Fig. S7). An impurity in the PDO, acting as a redox shuttle, could explain these observations. In order to add further evidence that gas is indeed produced by PDO cells during wetting, two cells with 2% PDO in 1.2 M LiPF6 EC:EMC:DMC were held on a Maccor 4000 series charger at a constant voltage of 1.5 V at 40 °C. The volume of gas following 24 h of wetting was measured using the ex situ gas apparatus as described in the experimental methods section and was found to be 0.43 ± 0.03 ml. This shows that the in situ and ex situ gas measurements do agree. Again, in Fig. 6c, some small amount of gas consumption occurs between ∼2.5 V and ∼2.9 V in 2% PDO cells. At ∼2.9 V, gases evolve until ∼3.5 V, maybe as a result of EC reduction. Then, some consumption of gas occurs until ∼4 V. At 4 V, gas production due to oxidation starts for PDO cells and continues until open circuit conditions at ∼100 h. Then, no net gas production or consumption occurs during open circuit conditions. Note that since the cells are balanced to 4.4 V (The N:P ratio is 1.1 at 4.4 V), charging these cells to 4.5 V in Fig. 6 could have caused unwanted lithium plating. As a consequence, the net gas production after 90 h could be different than that shown in Fig. 6 if equivalent cells balanced to 4.5 V were tested similarly.
Figure 7 shows the long-term cycling data of cells prepared with the 3-R-1,4,2-dioxazol-5-one-based electrolyte additives. Figures 7a–7d show that the discharge capacity of the cells in the early cycles is very similar, indicating the reproducibility of the cells, and that the different additives do not affect the cell capacity significantly. In remaining figures in this paper only the normalized discharge capacity is shown because it is more instructive. ΔV, shown in the lowest panels of Fig. 7, corresponds to the difference between the average charge and discharge voltage. ΔV is related to the impedance of the cells by Ohm's law. Figure 7 shows that when no co-additives are added, PDO is the best additive followed by pNDO, pMODO and pFDO. 2% X + 1% DTD blends also follow this trend. However, when LFO is added, pNDO is the best additive, followed by PDO, pMODO and pFDO. When MMDS is added, pNDO also shows good performance compared to the other dioxazolones, however MMDS has not been tested with PDO, except for the ternary blends shown later in Fig. 13. When 2% VC is added, pNDO and pFDO have very similar performance, both are better than 2% pMODO + 2% VC and 2% PDO + 2% VC in term of impedance growth (indicated by the slope of ΔV vs cycle number). Overall, the best cells in Fig. 7 are 2% PDO + 1% DTD, followed by 2% pNDO + 1% DTD, 2% pNDO + 1% LFO and 2% pNDO + 1% MMDS.

Figure 7. Long-term cycling data of pMODO, PDO, pFDO and pNDO alone or with a co-additive in NMC622/gr cells at 40 °C. Cells were cycled between 3.0 V and 4.3 V at C/3. The first row (a)–(d) shows the normalized discharge capacity, the second row (e)–(h) shows the normalized discharge capacity data, while the third row (i)–(l) shows the ΔV data. Each column shows the data for a primary additive X: (a), (e), (i) 2% pMODO, (b), (f), (j) 2% PDO, (c), (g), (k) 2% pFDO and (d), (h), (i) 2% pNDO. Except for 2% X and 2% VC, the different colors/symbols correspond to a specific secondary additive. All cells contained 1.2 M LiPF6 EC:EMC:DMC 25:5:70 as the main component of the electrolyte, except for 2% VC, 2% PDO and the PDO blends which used 1.2 M LiPF6 EC:DMC 3:7.
Download figure:
Standard image High-resolution imageThe difference in performance between pFDO cells and PDO cells, especially when DTD is present, might be difficult to understand at first since DFT predicts similar reduction and oxidation potentials for these two additives in Table I. Furthermore, Fig. 2 shows that 2% PDO partially passivates the graphite electrode while 2% pFDO fully passivates it. This might seem contradictory to the data in Fig. 7. A possible explanation could be that the reduction of pFDO produces soluble products or gases that negatively affect the performance of DTD by reacting with it and/or that negatively affects the positive electrode, while the products of PDO reduction do not. pMODO could act similarly to pFDO, while not passivating the graphite electrode.
Figure 8 shows the storage performance of cells containing the newly synthesized dioxazolones (Figs. 8a, 8c, 8d), compared to PDO data (Fig. 8b). When no co-additives are present, 2% PDO is the best performing additive during storage, followed by 2% pMODO, 2% pNDO and 2% pFDO, in this order. Except for blends containing MMDS, the performance of all dioxazolone blends follow a trend. First, 2% of a dioxazolone with 2% VC is the best perforing blend but doesn't beat the performance of 2% VC cells. Then, cells with 2% of a dioxazolone with 1% LFO, 2% of diozazolone alone and 2% of a dioxazolone with 1% DTD follows in terms of performance, in this order. MMDS performs best in cells with 2% pNDO, however MMDS was not tested in 2% PDO cells.
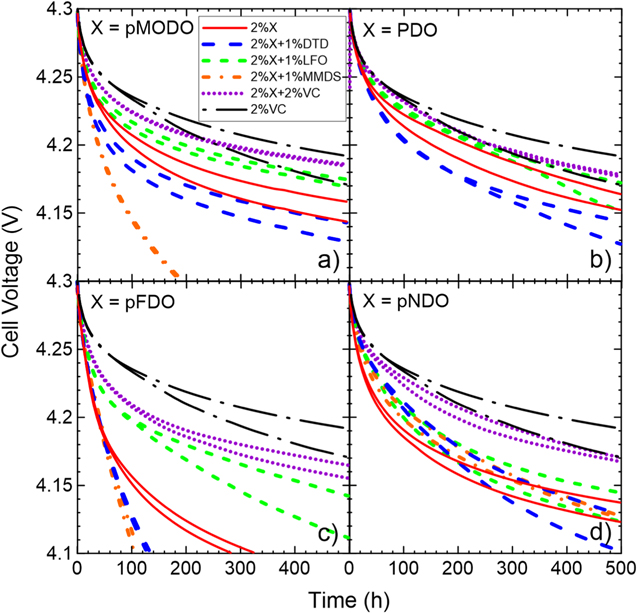
Figure 8. Storage data at 60 °C of primary additives X: (a) pMODO, (b) PDO, (c) pFDO and (d) pNDO alone or with a co-additive in NMC622/gr cells. The cell voltages in open circuit conditions are shown as a function of time. Except for 2% X and 2% VC, different lines/colors correspond to a cell with a different secondary additive, as shown in the legend. 2% VC is shown as a comparison. All cells contained 1.2 M LiPF6 EC:EMC:DMC 25:5:70 as the main components of the electrolyte, except for 2% VC, 2% PDO and the PDO blends which used 1.2 M LiPF6 EC:DMC 3:7.
Download figure:
Standard image High-resolution imageFigure 9a shows cell volume changes, due to gas production, following formation. Cells with 2% PDO produce less gas than cells with 2% of other dioxazolones during formation. This suggests that functional groups can negatively impact gas production during formation. Cells with only 2% pNDO produce the most gas during formation, an amount which is similar to the volume produced by control cells, in agreement with Fig. 6. Adding a co-additive decreases the amount of gas during formation in most cases, except for pFDO with DTD. The blends that produced the least amount of gas here are 2% PDO + 1% DTD, 2% pFDO + 1% LFO and 2% pNDO + 2% VC.
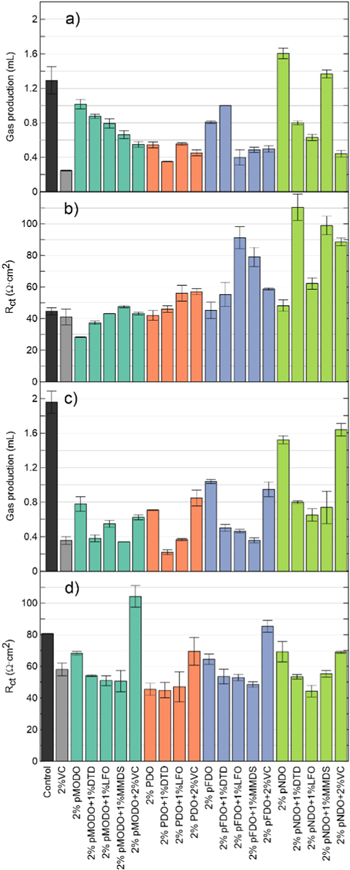
Figure 9. Gas production and Rct of pMODO, PDO, pFDO and pNDO in NMC622/gr cells, alone or combined with a co-additive, (a), (b) before storage and (c), (d) after storage. Control and 2% VC are shown as a comparison. All cells contained 1.2 M LiPF6 EC:EMC:DMC 25:5:70 as the main components of the electrolyte, except for control, 2% VC, 2% PDO and the PDO blends which used 1.2 M LiPF6 EC:DMC 3:7.
Download figure:
Standard image High-resolution imageFigure 9b shows Rct after formation for the same cells. Adding co-additives to the dioxazolones increase Rct after formation in all cases. Furthermore, it seems like more electron withdrawing functional groups on the para position of the benzene ring increase Rct on average when the dioxazolones are added to a co-additive. Interestingly, 2% pNDO + 1% LFO cells perform as well as 2% PDO + 1% LFO when it comes to this measurement. This is interesting since the other pNDO blends tested here have a Rct much higher than the PDO blends. Overall, cells with 2% pMODO had the smallest Rct after formation, being better than control and 2% VC. As an example, the EIS Nyquist plot of dioxazolones without and with 1% DTD of cells after formation are shown in Figs. S9 and S11.
Figure 9c shows gas production of the same cells after storage. The first trend that can be seen is the increase in gas production as the functional group on the para position of PDO is more electron withdrawing. For all dioxazolones, the presence of 2% VC as a co-additive or the absence of a co-additive resulted in more gas during storage, while the other blends tested produce way less gas. When a co-additive other than VC is used, the amount of gas is comparable to cells with 2%VC, except maybe for the pNDO blends which create more gas. However, cells with 2% pNDO and 2% pNDO + 2% VC produce almost as much gas as control. In term of gas production during storage, the best cell is 2% PDO + 1% DTD.
Figure 9d shows Rct after storage for the same cells. Except when VC is added, it seems like any blends of dioxazolone perform similarly in term of Rct after storage when the functional group is changed at the para position, however PDO and its blends does perform better. In the case of dioxazolone and VC blends, Rct after storage decreases as the functional group become more electron withdrawing. The best performing cells in terms of Rct after storage are cells with 2% pNDO + 1% LFO and PDO cells without VC, all being better than 2% VC cells. As an example, the EIS Nyquist plot of cells containing dioxazolones without and with 1% DTD of cells after storage are shown in Figs. S10 and S12.
The HOMO, LUMO and band gap energies in Table II can't explain any experimental trends. The very small difference in energies between PDO and pFDO shows this best, as they both have very different experimental performance during cycling.
Evaluation of new PDO-based additive blends
Since some PDO-based additive blends have been shown to be promising in NMC622/gr cells,29 some new PDO-based additive blends were tested and the PDO/DTD and PDO/LFO blends were further investigated in NMC622/gr and NMC622(sc)/gr cells.
Figure 10 shows the gas production and Rct after formation of some PDO blends. These blends include x% PDO + y% DTD blends, x% PDO + y% LFO blends, as well as two ternary blends which are 2% PDO + 1% MMDS + 1% TTSPi (PDO211T) and 1%PDO + 1%MMDS + 1%VC (PDO111V). The gas production in Fig. 10a of any PDO binary blend follows a "'U" shape when the concentration of PDO increases from 0% to 4%. In addition, the difference in gas production between 1% PDO and 2% PDO increases as more DTD or LFO are added. Binary blends with 1% PDO are the ones that create the least amount of gas. However, the ternary blends tested here produce even less gas, the amount of gas produced being comparable to 2% VC. In Fig. 10b, Rct of PDO/LFO blends increase as the concentration of PDO increases, while blends with 2% PDO have the smallest Rct among the PDO/DTD blends when the concentration of DTD is fixed. When PDO is added alone, all concentrations below 4% have the same Rct as control and 2% VC, while 4% PDO has a 20 Ω·cm2 increase in Rct. The ternary blends tested have the same Rct as the average of all binary blends in Fig. 10.
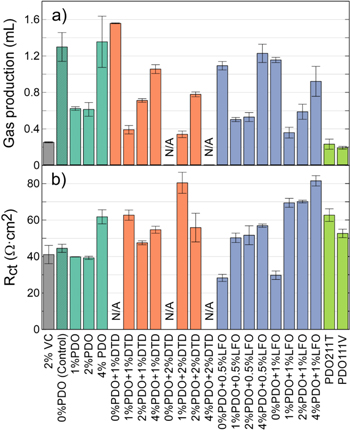
Figure 10. (a) Gas production and (b) Rct of some PDO/DTD, PDO/LFO and PDO ternary blends after formation compared to control and 2% VC in NMC622/gr cells. PDO211T corresponds to 2%PDO + 1%MMDS + 1%TTSPi and PDO111V corresponds to 1%PDO + 1%MMDS + 1%VC. All cells contained 1.2 M LiPF6 EC:DMC 3:7 as the main components of the electrolyte, except for 1% DTD which used 1.2 M LiPF6 EC:EMC 3:7.
Download figure:
Standard image High-resolution imageFigure 11 shows the long-term cycling data of blends with different PDO:DTD ratios. The first row in Fig. 11 shows the normalized discharge capacity for each cell and the second row shows ΔV. When no DTD is added, cells with 2% PDO have the best performance. By adding 1% DTD, making a PDO/DTD blend, 2% PDO + 1% DTD yields the best performing cells at 1% DTD. Furthermore, 4% PDO + 1% DTD cells have a better performance than 4% PDO cells. Cells with 1% PDO + 2% DTD are the best performing cells of all the blends in Fig. 11, retaining 90% capacity after 1500 cycles at 40 °C.

Figure 11. Long-term cycling data of NMC622/gr cells with PDO/DTD additive blends at 40 °C. Cells were charged and discharged at C/3 between 3.0 V and 4.3 V. Each column represents a different percentage of PDO: 0% PDO (a), (e), 1% PDO (b), (f), 2% PDO (c), (g) and 4% PDO (d), (h). Each color/symbol represents a different percentage of DTD. The first row (a)–(d) shows the normalized discharge capacity as a function of cycle number and the second (e)–(h) shows ΔV as a function of cycle number. All cells contained 1.2 M LiPF6 EC:DMC 3:7 as the main component of the electrolyte, except for 1% DTD which used 1.2 M LiPF6 EC:EMC 3:7.
Download figure:
Standard image High-resolution imageFigure 12 shows 1% PDO + 2% DTD and 2% PDO + 1% DTD cells compared to some of the best cells ever tested in our lab in NMC622/gr cells (applies only to polycrystalline NMC622/gr cells). 2% VC and 1% LFO are also shown to help have an idea of the relative performance. By looking at Figs. 12a and 12b, 1% PDO + 2% DTD seems to be the best performing cell ever tested in our lab for this type of cell, closely followed by 0.5% PES + 1% VC + 1% MMDS (PES0511). While it may not be perfectly clear that 1% PDO + 2% DTD has a better performance than PES0511 in Fig. 12a, the difference in slope of both cells in Fig. 12b make it clear that the ΔV of 1% PDO + 2% DTD doesn't grow as fast, which is related to the growth of the solid electrode interfaces (SEIs). A comparison of 1% PDO + 2% DTD and 2% PDO + 1% DTD shows that while they both seem to perform much better than 1% LFO in Fig. 12a, their difference in slope in Fig. 12b is important. In fact, the slope of 2% PDO + 1% DTD and 1% LFO are very similar after 500 cycles. Note that 2% PDO + 1% DTD and 1% PDO + 2% DTD are slightly better than 1% DTD in term of capacity fade in Fig. 11, showing that PDO may improve the performance of DTD. However, a 1% DTD NMC622/gr cell with longer cycling is needed to obtain a better comparison. Since 1% PDO + 2% DTD is shown to be better than 2% PDO + 1% DTD in Fig. 12, none of the cells in Fig. 7 are better than 1% PDO + 2% DTD.
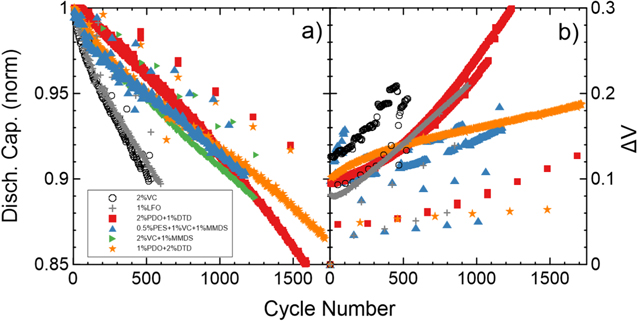
Figure 12. Long-term cycling data of some of the best NMC622/gr cells at 40 °C: (a) normalized discharge capacity and (b) ΔV vs cycle number. Cells were charged and discharged at C/3 between 3.0 V and 4.3 V. Results for cells with 2% VC or 1% LFO are also shown as a comparison. All cells contained 1.2 M LiPF6 EC:EMC 3:7 as the main component of the electrolyte, except for the PDO/DTD blends which used 1.2 M LiPF6 EC:DMC 3:7.
Download figure:
Standard image High-resolution imageIn an attempt to replicate the success of past ternary blends like (2% VC + 1% MMDS + 1% TTSPi) VC211 and (2% PES + 1% MMDS + 1% TTSPi) PES211,15 some PDO ternary blends were investigated. Figure 13 shows the performance of some of these PDO ternary blends compared to 2% VC. Both PDO211T and PDO111V show slightly better performance in both Figs. 13a and 13b. PDO111V is the best ternary blend tested, however cells with these ternary blends are not as competitive as the cells in Fig. 12.

Figure 13. Long-term cycling data at 40 °C; (a) normalized discharged capacity and (b) ΔV vs cycle number of some PDO ternary blends in NMC622/gr cells. Cells were charged and discharged at C/3 between 3.0 V and 4.3 V. Results for cells with 2% VC are shown as a comparison. All cells contained 1.2 M LiPF6 EC:DMC 3:7 as the main component of the electrolyte, except for the 2% VC cell which used 1.2 M LiPF6 EC:EMC 3:7.
Download figure:
Standard image High-resolution imageFigure 14 shows the storage performance of cells containing PDO/LFO blends. Figures 14a–14c, show that as more PDO is added, cells with y% PDO perform better and better until their performance is similar to the performance of cells with 1% LFO. Note that blends with 0.5% LFO generally perform worse than blends with 1% LFO. Also, all cells don't perform as well as 2% VC, except for some 1% LFO cells.
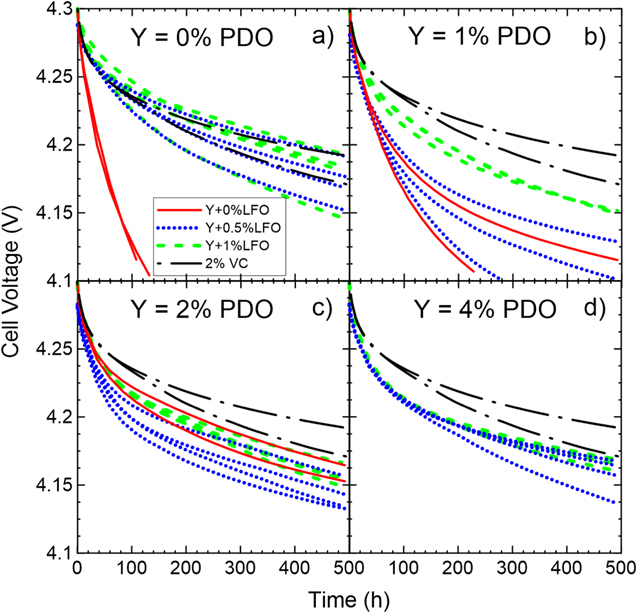
Figure 14. Storage data at 60 °C for cells with PDO/LFO blends in NMC622/gr cells. Cell voltages under open circuit conditions are shown as a function of time. The panels correspond to (a) 0% PDO, (b) 1% PDO, (c) 2% PDO and (d) 4% PDO as the primary additive. Different lines/colors represent different concentrations of the secondary additive LFO, as shown in the legend. Results for cells with 2%VC and no PDO are shown as a comparison in each panel. All cells contained 1.2 M LiPF6 EC:DMC 3:7 as the main component of the electrolyte.
Download figure:
Standard image High-resolution imageFigure 15a shows the gas volume in cells with PDO/LFO blends after storage. Figure 15 shows that all PDO/LFO blends perform similarly to LFO alone. 4% PDO cells produce more gas than all other PDO/LFO blends or other percentages of PDO alone. Figure 15b shows Rct after storage for the same cells. Adding LFO to cells with 1% PDO or 2% PDO doesn't affect Rct, but for 4% PDO adding LFO does decreases Rct after storage. Cells with PDO alone have Rct similar to or greater than control cells. 4% PDO cells without co-additives have the largest Rct, while 1% LFO cells without co-additives have the smallest Rct.

Figure 15. (a) Gas production and (b) Rct of NMC622/gr cells with various PDO/LFO additive blends after storage at 60 °C. Results for cells with control and 2% VC are shown as a comparison. All cells contained 1.2 M LiPF6 EC:DMC 3:7 as the main component of the electrolyte.
Download figure:
Standard image High-resolution imageFigure 16 shows the performance of cells with some PDO and pNDO additive blends, as well as 2% FEC + 1% LFO, 2% FEC + 1% DTD and 2% VC + 1% DTD, in NMC622(sc)/gr cells at 20 °C and 40 °C. The last three additive blends were chosen as a comparison due to their excellent performance in NMC622(sc)/gr cells. At 20 °C (Figs. 16a and 16b), cells with most PDO blends showed similar performance to cells with 2% VC and 1% LFO. However, 2% pNDO + 1% LFO performed poorly. At 40 °C (Figs. 16c and 16d), the 2% pNDO + 1% LFO cell performed worse than cells with other PDO blends at this temperature, but not as poorly as observed at 20 °C. The 2% FEC + 1% LFO, 2% FEC + 1% DTD and 2% VC + 1% DTD cells performed better than all other cells at 40 °C but cells with 2% PDO + 1% DTD show similar capacity retention after 1100 cycles in Figs. 16c, 2% VC + 1% DTD is the best performing blend in term of capacity retention and in Figs. 16d, 2% FEC + 1% DTD is the best performing cell in terms of impedance control. Figures 16b and 16d show that the slope of the ΔV vs cycle number graphs of most cells are quite similar at a given temperature.
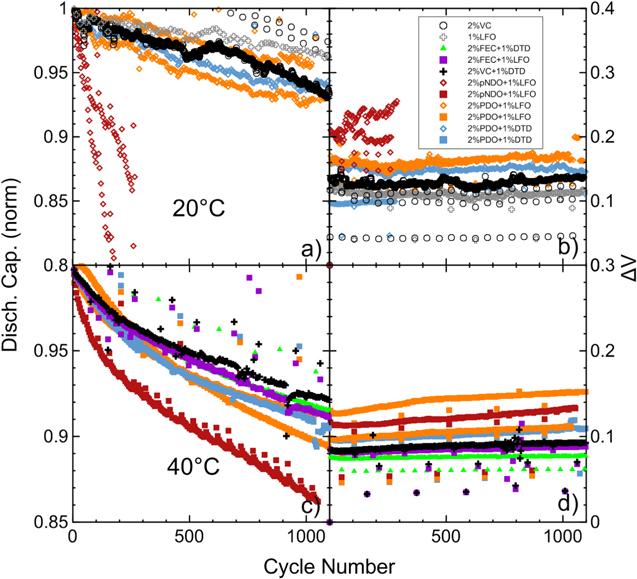
Figure 16. (a), (c) Normalized discharge capacity and (b), (d) ΔV vs cycle number of some NMC622(sc)/gr cells with PDO and pNDO additive blends at: (a), (b) 20 °C and (c), (d) 40 °C. Cells were charged (CCCV to C/20) and discharged at C/3 between 3.0 V and 4.3 V. Data for cells with 2% VC and 1% LFO tested at 20 °C are shown as a comparison. Cells contained 1.2 M LiPF6 EC:EMC 3:7, except for PDO blends which contained 1.2 M LiPF6 EC:DMC 3:7, as the main components of the electrolyte.
Download figure:
Standard image High-resolution imageFigure 17 shows the results of UHPC measurements on NMC622(sc)/gr cells prepared with PDO-based additive blends compared to results for cells made with 2% FEC + 1% LFO. Again, the 2% FEC + 1% LFO additive blend was chosen for comparison due to its excellent performance in NMC622(sc)/gr cells. For all four metrics measured (normalized discharge capacity, zeroed charge endpoint capacity, coulombic efficiency and ΔV), the best cells, for all four metrics, have the 2% FEC + 1% LFO additive blend. Considering normalized discharge capacity and ΔV, 2% PDO + 1% DTD cells are the second best and 2% PDO + 1% LFO cells are the third best. However, considering coulombic efficiency and zeroed charge endpoint capacity 2% PDO + 1% LFO cells are the second best followed by the 2% PDO + 1% DTD cells. Note that charge endpoint capacity increases as electrolyte oxidation increases.69 So the lower charge endpoint capacity of 2% PDO + 1% LFO cells vs 2% PDO + 1% DTD cells can be explained by less electrolyte oxidation. Similarly for 2% FEC + 1% LFO cells.

Figure 17. (a) Normalized discharge capacity, (b) normalized zeroed charge endpoint capacity (%), (c) coulombic efficiency and (d) ΔV of some PDO blends in single crystal NMC622(sc)/gr cells at a C-rate of C/20 and a temperature of 40 °C. The cells were cycled between 3.0 and 4.3 V. Results for cells with 2% FEC + 1% LFO cells are shown as a comparison. All cells contained 1.2 M LiPF6 EC:DMC 3:7 as the main component of the electrolyte.
Download figure:
Standard image High-resolution image
Conclusions
This work evaluated the effects of several 3-R-1,4,2-dioxazol-5-one electrolyte additives on the lifetime of NMC622/graphite lithium-ion full cells. The effects of several PDO-based additive blends were similarly tested. Overall, unsubstituted and nitro substituted dioxazolones show promising results. When no co-additives are added, 2% PDO shows the best cycling performance of all the dioxazolones tested in this work, followed by 2% pNDO, 2% pMODO and 2% pFDO. The cycling performance is significatively improved when 1% DTD, 1% LFO or 1% MMDS is added to form a binary blend. DFT results for the reduction potentials of each additive show good agreement with experiment, however further studies are needed in order to fully understand the reduction mechanisms that take place at the anode during formation. While a possible mechanism is proposed for the reduction occurring during formation of 2% pNDO cells, more studies are needed to confirm the proposed chemical pathway. Furthermore, it is found that the HOMO and LUMO energies of each dioxazolone can't explain their relative performance during cycling. Trends between gas production and Rct vs the electron withdrawing power of the functional groups added may exist and require further study.
A comparison of the cycling results showed that NMC622(sc)/gr cells containing 2% FEC + 1% LFO additives performed better than NMC622(sc)/gr cells containing dioxazolone additives in all metrics. Furthermore, 2% VC + 1% DTD was the best performing NMC622(sc)/gr cell in term of capacity fade at 40 °C. As readers will appreciate, most literature papers discussing electrolyte additives compare results for cells with additives to cells without additives. In this work, we did that and showed that electrolytes with the dioxazolones outperformed the control electrolyte. However, we have gone the "extra mile" and compared cells with the dioxazolones to cells with some of the best known (to us) additive combinations.70 We show that cells with the dioxazolone additive blends tested here do not exceed the performance of cells containing 2% VC + 1% DTD and 2% FEC + 1% LFO in NMC622(sc)/gr cells. However, PDO blends are worth studying further, especially in polycrystalline NMC cells. It is hoped that the present work can help better understand electrolyte additives and accelerate the search for better additives.
Acknowledgments
The authors acknowledge the financial support of the Natural Sciences and Engineering Research Council of Canada and Tesla Canada under the auspices of the Industrial Research Chair program. Computational facilities were provided by ACENET (Atlantic Computational Excellence Network) and funded by the Canada Foundation for Innovation (CFI), the Atlantic Canada Opportunities Agency (ACOA), and the provinces of Newfoundland and Labrador, Nova Scotia, and New Brunswick.