
Abstract
Despite being a promising technology for automotive applications, polymer electrolyte fuel cells still face challenges to reduce their complexity and cost. One challenge is to achieve good humidification, which is essential for a fuel cell membrane, without expensive external humidifiers. Here we present an evaporative cooling concept that manages humidification and cooling simultaneously, and does not require any additional layer to the structure of the cell. To this aim, water flows in the fuel cell itself through a small number of the flowfields' channels. Modified gas diffusion layers, with separate parallel hydrophilic regions, are capable of wicking the water from these supply channels and bring it in contact to the gas flow to evaporate, thus providing cooling and humidification. Our results show that this concept can provide the necessary cooling power and humidification for a cell with completely dry inlet gases at 80 °C, and has the potential for working at higher temperatures.
Export citation and abstract BibTeX RIS

This is an open access article distributed under the terms of the Creative Commons Attribution Non-Commercial No Derivatives 4.0 License (CC BY-NC-ND, http://creativecommons.org/licenses/by-nc-nd/4.0/), which permits non-commercial reuse, distribution, and reproduction in any medium, provided the original work is not changed in any way and is properly cited. For permission for commercial reuse, please email: oa@electrochem.org.
Although Polymer Electrolyte Fuel Cells (PEFCs) are an attractive alternative to current carbon-based fuel engines, cost and size reductions are still needed before large-scale commercialization is possible. Various subsystems needed to operate PEFC stacks could lead to significant cost reductions if they were simplified or removed.1 An example of such systems is the costly external humidifiers2 used to bring water vapor in the cell with the reactant gases to hydrate the membrane3 and increase its protonic conductivity.4 Some authors have reported operation with dry gases, but performances are strongly degraded, especially at high temperatures.5 To the best of the authors' knowledge, Toyota is so far the only car manufacturer, who succeeded in developing a liquid cooled PEFC stack for automotive applications without external humidifiers.6–8 Next to the humidifiers, the cooling loop is another bulky subsytem, which is needed to maintain a constant temperature, because the chemical reaction releases waste heat in the same order of magnitude as the electrical power produced.9 Cooling is therefore as necessary as humidification and has also been extensively studied.9–11 The most common technique consists in flowing a coolant, either liquid or gas, inside a dedicated space between two adjacent cells12–15 (Fig. 1a), which increases the overall volume and weight of the stack. Evaporative cooling concepts have received a lot of attention16–23 because they can reduce the complexity of the system: water is evaporated within the cell, simultaneously providing cooling power and membrane humidification. The high latent heat of evaporation implies the mass flow rate of water needed is orders of magnitude lower than with a convective cooling scheme.17 Additionally, it was shown that a PEFC stack with evaporative cooling would have the potential to regulate its own temperature without active control.18 While these characteristics make evaporative cooling schemes highly appealing, water management within the cell remains a critical challenge. Water must be well spread over the cell area in order to allow sufficient cooling and humidification, but accumulations hindering the supply of reactants must be avoided as they are detrimental to both performance and durability.24 So far, few authors working on evaporation cooling have described in detail how to achieve this aim. Snyder,20 Choi et al.21 have used nebulization to inject water droplets in the cell, but this method is penalized by its high energy consumption10 and the lack of control over where the evaporation can take place. Perhaps the most well-known method for bringing water in the cell is the porous water transport plates developed by UTC Power25 which can remove excess liquid from the channels and transport it to unsaturated regions to evaporate.17,22 This sophisticated scheme is built on bulky and most likely expensive special porous plates25 and still requires additional space between two adjacent cells for liquid transport. Here, we demonstrate the operability of a fuel cell equipped with an evaporative cooling concept that requires no additional component and no additional space for water injection, therefore bearing the promise of significant cost reduction. While the cooling power of our concept has already been demonstrated in a non-operating cell with inert gases,26 we had yet to show that it worked in an operating cell and had the potential for significant improvement over a classical cell. This is the purpose of the present article.
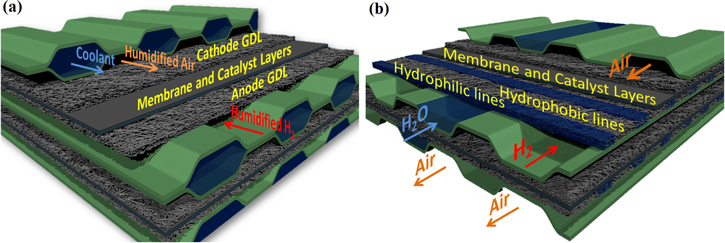
Figure 1. Classical PEFC vs evaporative cooling concept. (a) Standard PEFC with convective cooling. The humidified gases diffuse from the flowfield channels to the catalyst layers on each side of the membrane through the GDL and micro-porous layers (not represented). The coolant flows in the space between two adjacent cells. (b) PSI evaporative cooling concept. Water is injected in selected channels of the anode flowfield, and is wicked into the hydrophilic lines of the GDL, where it evaporates in contact with the gas flow.
Download figure:
Standard image High-resolution imagePaul Scherrer Institut (PSI) evaporative cooling concept
The core of the PSI evaporative cooling concept lies on the modification of the gas diffusion layer (GDL). GDLs are thin porous media which enable on one hand the transport of the reactant gases from the supply channels to the catalyst layers (CL)19 where the reaction takes place, and on the other hand the transport of the water produced by the reaction from the CL to the gas channels where it can be removed by the gas flow. It is vital for the cell that enough pores of the GDL remain free of water to let the reactant gases diffuse. While GDLs are originally hydrophobic, a process developed at PSI27–29 enables us to tune their wetting properties selectively and locally. Hydrophilic portions are created, which are equally spaced 500 μm-wide lines, placed orthogonally to the gas and liquid channels (Fig. 1b). In our concept, instead of flowing in a dedicated space between two adjacent cells, the cooling water is brought into the cell in some of the anode flowfield channels, parallel to the gas channels, and is wicked into the hydrophilic lines of the modified GDL. The high wettability (i.e. low contact angle) of these lines enables water wicking at negative capillary pressures, while the hydrophobic portions remain dry for capillary pressures as high as 40 mbars.30 The excellent segregation prevents flooding of the GDL's hydrophobic pores, and ensures dry pathways towards the CL for the reactant gas. The water filling the hydrophilic lines is brought by capillarity in direct contact with the gas channels, where it evaporates thanks to anode gas convection. Since there is no more need for a space between adjacent cells for the coolant, thin monolithic plates can replace bulky and complex bi-polar-plates (BPP) for the transport of gases (Fig. 1). Assuming that the thickness occupied by a thin monolithic plate is about the same as that of the membrane electrode assembly itself (400–500 μm), and that a BPP is about twice as thick as the monolithic plate, we estimate that the cell-to-cell pitch for our evaporative cooling concept will be about two thirds of that of a conventional system with convective cooling. This amounts to a reduction of up to 33% of the stack volume, or an increase of up to 50% of the power density. The same reasoning shows that weight and cost reductions are also possible. Last but not least, the entire system's complexity and volume will be reduced thanks to the removal of the external humidifiers.
Experimental
The cooling power of our concept has already been investigated in a non-operating cell in a previous work,26 demonstrating heat removal rates in the order of magnitude of the waste heat released by a PEFC. To investigate the evaporation during operation, we have designed a thermal test setup that enables precise and fast regulation of temperatures, precise and accurate characterization of heat fluxes and electrochemical performance, at the same time as visualization of the liquid water distribution within the cell thanks to neutron radiography (NR).31 This test setup is described in more details in the next paragraphs, and in Figs. S4 and S5 (available online at stacks.iop.org/JES/167/084518/mmedia).
Cell description
In order to have a detailed view of all relevant phenomena in the PEFC, the test cell was of small dimensions, with an active area of 20 × 22 mm2 and high stoichiometric ratios were selected to have representative gas velocities and evaporation rates.
The test fuel cell had 1 mm-thick stainless steel flowfields with a 5 μm-thick gold coating. The anode flowfield had one channel dedicated to the transport of liquid water, surrounded by five gas channels on each side. The cathode flowfield had eleven gas channels. All channels were 1 mm wide and 0.5 mm deep. The ribs between them were 1 mm wide. Water and gas channels were both supplied from separate inlets, as is described in Fig. S5 (available online at stacks.iop.org/JES/167/084518/mmedia).
On the anode side, the GDL was originally a 190 μm-thick Toray TGP-H-060 carbon paper with a bulk density of 0.44 g.cm−3 and a porosity of 78%, that was dipped into a fluorinated ethylene propylene (FEP) solution to get a coating load of 70% (relative to the carbon weight). The GDL was selectively irradiated through a mask in an electron beam EBLab 200 sealed laboratory emitter system (Comet A. Switzerland) at FHNW Brugg. The sample was then immersed in a hydrophilic monomer, N-vinylformamide (NVF) during 60 min at 70 °C, which resulted in graft co-polymerization in the previously irradiated regions. These regions thus became hydrophilic, while the rest of the sample remained hydrophobic.28,29 While providing concrete wettability values is challenging for a classical gas diffusion layer due to the roughness and heterogeneity of the fibers, it is especially difficult when molecules such as hydrophobic coating and polymers are added. Still, our previous studies29 allow us to provide a range of contact angles for both the hydrophilic and the hydrophobic regions. For the hydrophilic patterns, the intrinsic contact angle is in the range of 20–60° (lower for high FEP coating loads) and, for the hydrophobic domains, the intrinsic contact angle is in the range of 95–110° (higher for high FEP coating loads).
The used pattern was 500 μm wide hydrophilic lines and the separation between two lines was 930 μm, meaning that the distance center-to-center between two hydrophilic lines was 1430 μm. Our choice was based on a thorough parametric study by Forner-Cuenca et al.,30 who examined the impact of the geometry of the wettability pattern on the saturation of the hydrophilic and hydrophobic regions. Neutron Radiography images showed that thinner patterns than the one we use here led to a degraded separation between the hydrophilic and the hydrophobic regions. Additionally, it was observed that thinner hydrophilic lines required higher capillary pressures to be saturated.
A self-standing MPL with an initial thickness between 50 and 65 μm and an average pore size less than 0.1 μm (Carbel MP30Z, W. L. Gore and Associates) was used on the anode side. An additional thin microporous layer was spray-casted on the MP30Z layer to improve the interface between the MPL and the GDL. The ink was prepared using 2.4 g of carbon black (acetylene, 50% compressed, Alfa Aesar) and 0.80 g of FEP (FEPD121 DuPont 55% solids) dispersed in a solution consisting of 60%wt miliQ-water and 40%wt 2-Propanol (PROLABO, VWR). Afterwards the MPL was sintered at 270 °C under air.
A catalyst coated membrane (CCM) Primea 5710 (W. L. Gore & Associates, Inc., USA) was used, with platinum loadings of 0.1 mgPt cm−2 on the anode and 0.4 mgPt cm−2 on the cathode side.
On the cathode side, unmodified commercial GDLs were used with a MPL containing 23% in weight of PTFE (SGL 24BC, SGL Carbon Group).
Instrumentation of the thermal test cell
Three current collectors, equipped with resistive thermometers and in direct contact to the flow fields on each side of the cell (anode and cathode), were used to draw the current and to measure the flow fields temperatures and the cell voltage. The temperatures were used as a feedback for three PID regulated Peltier thermo-electric coolers (TEC). These Peltier TECs allow precise and fast temperature regulation for heating and for cooling. Three Captec® tangential gradient heat flux sensors (HFS) were placed between the TEC and the current collectors, and deliver a voltage proportional to the net incident heat flux. A 3D diagram of the thermal test cell is available in Fig. S4 (available online at stacks.iop.org/JES/167/084518/mmedia).
Heat flux measurements
Heat flux measurements can measure the thermal signature of the electrochemical reaction32 and can provide information on heat transfer within a fuel cell.33 In our case, they allow the determination of the heat consumed by the evaporation and its evolution with current density. Although there were three HFS on each side of the cell, only the middle one corresponds to the active area. The purpose of segment 1, upstream of the active area, was to define precise boundary conditions, and to guarantee that the mass transfer coefficient was constant when the gas and liquid reach segment 2. Segment 3 helped monitoring that there is no significant drop of gas temperature due to evaporation.
The heat flux offset due to thermal losses was corrected using the following procedure. First, heat fluxes were measured for every segment in the following conditions:
- –No liquid water supplied in the water channel
- –Nominal gas flows as specified in Table I
- –Temperature and pressure at their nominal values (80 °C and 2 bars)
Table I. Operating conditions.
| Anode | Cathode | |
|---|---|---|
| Gas | H2 | Air for operando N2 for evaporation only experiments |
| Gas flow rate | 400 Nml min−1 | 1600 Nml min−1 |
| Stoichiometric ratio @ 1 A.cm−2 | 13 | 22 |
| Temperature | 80 °C | 80 °C |
| Pressure | 2 bars | 2 bars |
| Inlet Relative Humidity | Case Aa): 0% Case Bb): 75% | Case Aa): 0% Case Bb): 20% |
a)Case A: with evaporation cooling. b)Case B: without evaporation cooling and with externally humidified inlet gases.
Heat fluxes at these values are due to convection by the gas flow and heat losses to the environment. When water is supplied and evaporation takes place, heat fluxes due to the evaporation are measured by substracting the heat fluxes measured previously from the new values:

The total heat flux is the sum of the heat fluxes measured on the anode and the cathode sides of the active area:

Note that the heat fluxes measured on segments 1 and 3 do not change significantly during different experiments, and can therefore be neglected.
In the case where no current is drawn, and the total heat flux is only due to evaporation, the evaporation rate  can be computed as:

where  is the active area surface (4.4 cm2), and
  is the latent heat of vaporization of water.
As noted previously, vapor exits either on the anode or on the cathode side. As a result, the total evaporation rate is the sum of the mass flow rates of vapor exiting on the anode and on the cathode sides:

Neutron imaging setup
Neutron Radiography (NR) was performed in two series of experiments at the ICON beamline34 of the Swiss Spallation Source (SINQ) of the Paul Scherrer Institute (Villigen, Switzerland). For the first series, a neutron sensitive scintillator screen (6LiF/ZnS, thickness 50 μm) was used perpendicular to the beam axis. Images were recorded with a cooled CCD camera (Andor iKon-L, 2048 × 2048 pixels) with optical lenses (ZeissMakro-Planar, 100 mm focal length). The resulting pixel size was 50.9 μm, and the effective resolution including the effect geometrical blurring was 143 μm (defined by the half-period of the 10% MTF cutoff). NR images and results stemming from this series of experiments are presented in Fig. 2 and Fig. 3. Exposure time was 10 s. For the second series of experiments a 30 μm thick Gadolinium Oxysulfide (Gd2O2S) scintillator was used to convert neutrons to photons and a 1340 × 1300 pixels light-amplifying CCD camera (PI-Max 1300, Princeton Instruments) for image acquisition. The resulting pixel size was 120 μm, with an effective resolution of approximately 250 μm. NR images and results stemming from this series of experiments can be seen in Figs. 4, 5 and Fig. S1 (available online at stacks.iop.org/JES/167/084518/mmedia).
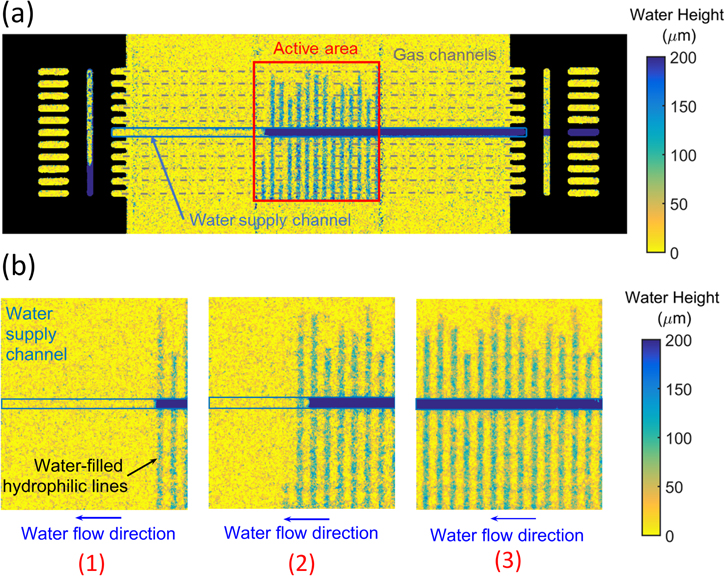
Figure 2. Through-plane Neutron Radiography of the fuel cell with PSI evaporative cooling concept. (a) The entire test cell is visible, the active area is highlighted by a red rectangle, the water supply channel by a dark rectangle and the gas channels by grey dotted lines. (b) Magnification of the active area for various mass flow rates of the water supply: 2 g hr−1 (1), 5 g hr−1 (2) and 8 g hr−1 (3).
Download figure:
Standard image High-resolution image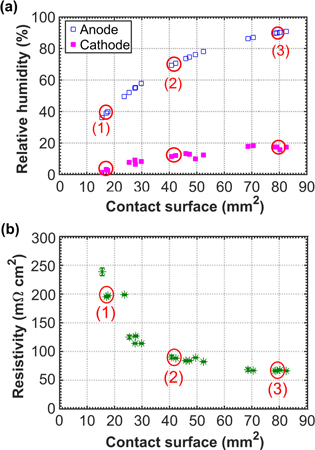
Figure 3. Humidification levels reached in the non-operating test cell due to evaporation. (a) Relative humidity at anode and cathode outlets with respect to the contact surface between the water in the hydrophilic lines and the anode gas. (b) Resistivity of the cell with respect to the contact surface between the water in the hydrophilic lines and the anode gas. The circled points correspond to the three NR images shown previously in Fig. 2: 2 g hr−1 (1), 5 g hr−1 (2) and 8 g hr−1 (3).
Download figure:
Standard image High-resolution image
Figure 4. Top: Comparison of the cell's performance and resistivity with and without evaporative cooling. Bottom: Neutron Radiography images, (1), (2) and (3): water distribution inside the cell with evaporation cooling for different current densities.
Download figure:
Standard image High-resolution image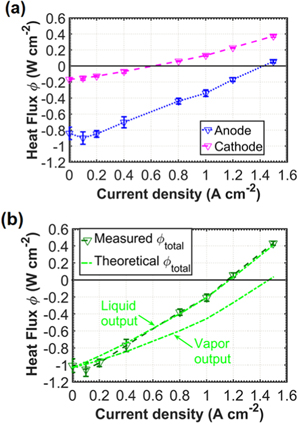
Figure 5. Heat fluxes evolution vs current density. (a) Evolution of the measured heat fluxes on the cathode  and on the anode
  (b) Evolution of the total measured heat flux
  compared to the theoretical heat flux
  based on the heat losses if the chemically produced water leaves the cell as liquid or as vapor.
Download figure:
Standard image High-resolution imageImage processing
Neutrons are attenuated by any given material in accordance with the Beer–Lambert law.

where  and
and  are the beam intensities respectively upstream and downstream the sample;
  the absorption coefficient of this material and
  its thickness. When the sample to be imaged is made of different materials, the intensity of the neutron beam is attenuated by each of them according to its absorption coefficient and its thickness. By dividing every image of a working fuel cell pixel-wise by a reference image of the same fuel cell in dry conditions, the contribution of liquid water to neutron attenuation can be isolated. Using the Beer–Lambert law, it is then possible to determine the thickness of liquid water present in a fuel cell. It must be noted that a certain number of corrections must be made on all images before the thickness of the liquid water can be accurately quantified. These corrections have to account for spatial inhomogeneity of the neutron beam, camera background, neutron scattering by the sample, as well as small displacements of the cell during the experiments.35 Corrected images were averaged over 5 to 10 min of stable operation.
Electrochemical measurements
The performance was characterized by a polarization curve, which was obtained by measuring a series of galvanostatic steps (in increasing order of current density) stabilized over at least 15 min. The averages and standard deviations were computed over the last 15 min. Current was drawn using a DC electronic load (IT8511, ITech), and a power supply was connected in series with the cell in order to get a sufficient voltage for the load. The cell voltage was measured using an analog acquisition card (PXI-6284, National Instruments) having a precision of 5 μV. To measure the high frequency resistivity (HFR), a sinusoidal current of 10 mA amplitude with a frequency of 4793 Hz was added to the DC current using a frequency generator (Agilent 33210A). This specific frequency was chosen in order to avoid aliasing effects in the measured signals.The sinusoidal current was measured over a 100 mOhm shunt resistor using the same analog acquisition card as for the voltage. The impedance was extracted online from the measured current and voltage signals by extracting the components corresponding to the excitation frequency. The real part of the impedance measured with this method, multiplied to the active cell area (4.4 cm2) was used as a measurement of the high frequency resistivity.
Results and Discussion
This experimental set-up helped us to demonstrate that the evaporated water is carried out of the cell either directly on the anode or indirectly on the cathode after diffusion through all the layers of the cell (anode and cathode porous layers, CLs and GDLs). We established one-dimensional relations to link the evaporation rate on each non-operating half-cell (anode and cathode) to the inlet gas flow rates, the cell's temperature and pressure, and the surface of water in the hydrophilic lines in contact with the anode gas flow. Now, we turn our attention to the behavior of our concept in operando conditions, including its humidification and cooling characteristics, as well as the resulting cell performance.
Humidification performance
The importance of humidification for PEFCs cannot be overstated, as the hydration of the membrane controls the protonic conductivity and insufficient humidification can lead to severe performance losses. However, relative humidity of the reactant gases does not need to be the same on the anode and the cathode. Studies performed on small cells (with an active area of a few square centimeters) with external humidification have shown that, in locations where the anode is fully humidified, a dry cathode will not lead to a strong degradation of the performances.36–38 On the other hand, full humidification on the cathode can lead to condensation and flooding.39 Because of this asymmetry, water injection on the anode is preferred. Since the vapor has to diffuse through all the layers to the cathode gas channels, the relative humidity can be expected to be lower on the cathode than on the anode. To study the effectiveness of the humidification, the cell was first imaged using NR in non-operating conditions, with N2 instead of air on the cathode. Because evaporation is mostly driven by convection from the anode gas flow, an important parameter is the surface of water-filled lines in contact with the gas flow. In order to test this parameter without changing the cell design, the mass flow rate of the supplied water was varied from 2 to 8 g.hr−1. These values are lower than the maximum achievable evaporation rate (based on the experiment's temperature, pressure, mass flow rates and total number of hydrophilic lines). Consequently, for all the points in our experiment, the water supplied entirely evaporates in a limited fraction of the active area, and the waterfront never reaches the end of the active area. Instead, for each value of the liquid flow rate supplied, the waterfront reaches a quasi-steady-state where it oscillates between two hydrophilic lines, the line for which the evaporation rate is slightly above the liquid flow rate, and the line for which the evaporation rate is slightly below the supplied liquid flow rate. For example, for 2 g.hr−1 of liquid injected in the cell, the waterfront will oscillate between three to four hydrophilic lines imbibed (Fig. 2b point (1)). As a result, the heat flux measured will be a series of plateaus, each long and stable enough to assume steady-state and to average the heat fluxes and the images of the imbibed hydrophilic lines. When the liquid flow rate increases, the distance reached by the waterfront and the number of imbibed lines increases strongly (plus/minus one line), allowing control over the contact surface between liquid and gas (Fig. 2). A video
As explained in a previous work,26 an algorithm based on Otsu's automatic intensity threshold detection method40 allows us to extract the surface of water in the hydrophilic lines in contact with the anode gases from the NR images. Measurements of the anode and cathode heat fluxes allow us to determine the total evaporation rate, and with the help of a one-dimensional model established previously26 for the evaporation rate on the anode, we evaluate the relative humidity at anode and cathode outlets. They both increase with contact surface (Fig. 3a), and the anode flow is saturated quicker than the cathode flow, because vapor transfer to the cathode is slowed by diffusion through all the layers of the cell, and because the water uptake capacity of the cathode flow is much higher due to its higher flow rate. These results are consistent with the evolution of resistivity with contact surface. Resistivity is an important parameter for the performance of a PEFC: a low value means low ohmic losses and requires a good humidification of the membrane. With evaporative cooling, the resistivity of the cell decreases quickly with increasing contact surface (Fig. 3b). For a contact surface of about 70 mm2, while the cathode's relative humidity is still below 20%, the resistivity reaches 60 mΩ.cm2, a value close to this state-of-the-art membrane's optimal resistivity of 40 mΩ.cm2 (measured in an operating PEFC with 100% relative humidity on both sides36). Additional conclusions can be drawn from the visualization of this series of experiments (see video in Supplementary Information 1). First, since no water is observed outside the hydrophilic lines, we can confirm that the hydrophobic portions remain dry pathways for the hydrogen. Note that this is the case even for the hydrophobic areas directly above the water supply channel. While the saturation of these regions cannot be directly determined on these NR images because of the 0.5 mm-deep water channel superimposed to them, Forner-Cuenca et al.30 showed that they remain dry for all capillary pressures in the range used for our experiments. Second, the filling process of the hydrophilic lines was observed to be faster than the temporal resolution of 20 s used for this setup, despite high evaporation rates. Last, the fact that water can be supplied to the whole active area from the centre channel indicates that the heat dissipation is homogeneously spread over the different gas flow channels, because, once sufficient water is supplied, the evaporation rate will only depend on the gas flow and on the local diffusion resistance. In conclusion, for dry inlet gases at 80 °C and 2 bars, a single water channel is enough for a near constant imbibition of the lines over most of the area covered by ten gas channels and for a homogeneous spread of the heat dissipation. It is interesting to note that our concept could easily be optimized for different operating conditions (e.g. higher temperatures) by increasing the ratio between the number of water supply channels and the number of gas channels, which would allow the lines to sustain higher evaporation rates.
Operando measurements
To assess the impact of our concept on a PEFC, we compare the performances of our test cell with evaporation cooling and with classical operation (Fig. 4). For a fair comparison, isothermal boundary conditions are used in both cases, and, in the latter case, gases are humidified upstream from the cell, at similar levels to the average ones achieved with evaporation cooling (Table I). For current densities from 0 to 1.2 A.cm−2, voltage is very similar for both cases. Only at 1.2 A.cm−2 and higher, we see slightly lower voltage with evaporative cooling. On the other hand, at low current densities, resistivity is lower with evaporative cooling (Fig. 4), and already very close to the optimal value of 40 mΩ.cm2, as expected. At higher current densities, the difference is much smaller since the water produced at the cathode provides the additional humidification needed in the case of classical operation.
Voltage in a PEFC decreases with current density because of losses, typically classified as charge transfer losses due to sluggish kinetics of the oxygen reduction reaction, ohmic losses due to the electrical and ionic resistivity of the cell, and mass transport losses due to slow diffusion of oxygen to the reaction sites. Mass transport losses are relevant at high current densities or when water accumulation in the GDL or flowfield channels hinders the reactants pathways. Here, because both cases have similar resistivity at current densities higher than 1.2 A.cm−2, we attribute the slightly lower performance of the evaporative cooling scheme to higher mass transport losses. NR images seem to confirm this assumption: while at low current densities (Fig. 4 point (1)), water is only seen in the hydrophilic lines, at intermediate current densities it starts accumulating in the GDL along the ribs of the flowfields (Fig. 4 point (2)), and even invading the gas channels at high current densities (Fig. 4 point (3)). Several remarks must be made here. First, from the images of the cell in operation, as long as there is no water in the gas channels, the hydrophilic lines can always be seen separately, indicating that the hydrophobic regions of the anode GDL remain free of water. Second, the invasion of gas channels by water was identified as a limitation of the evaporative cooling concept and more systematically analysed. A lack of control over the water pressure was identified as the source of this issue. When the capillary pressure—defined as the difference between water and gas pressures—rises above 1 mbar, water in the hydrophilic lines starts dripping into the gas channels, eventually clogging them (Fig. S1 is available online at stacks.iop.org/JES/167/084518/mmedia). Among various possible mitigation strategies we found that rising slowly the water flow rate to the same value as the evaporation rate allowed us to achieve a constant capillary pressure, at a value low enough to prevent water invasion of the gas channels. This strategy has been proven to work and yield higher performance (Fig. S2). However, additional testing have also confirmed that performance is still slightly better at higher current densities for classical operation (Fig. S3), indicating that mass transport losses are slightly higher for evaporative cooling even when flooding of the gas channels is avoided. We estimated a difference of up to 10% in the maximal reached power (W.cm−2). However, this small decrease is more than compensated by the overall reduction of the stack volume (up to 33%) and the simplification of bipolar plates made possible by our evaporative cooling concept. Indeed, the reduction of 33% in volume is equivalent to an increase of up to 50% in power density (defined as the total power divided by the total volume). Once a 10% decrease in the maximal reached power (W.cm−2) as observed on this particular cell (Fig. S3) is factored in, the power density would still be higher by 35% (0.9 × 1.5) compared to a classical system.
Impact of operation on heat management
In this section, we present how our concept performs as a cooling system for the PEFC, especially at high current densities. To determine the cooling power, we considered the evolution of the measured anode and cathode heat fluxes with respect to current density (see Fig. 5a). Measured heat fluxes at open-circuit voltage are only due to evaporation, and negative values on anode and cathode indicate that evaporation is cooling both sides of the cell. The lower absolute value on the cathode is attributed to the fact that evaporation takes place on the anode side, and to the thermal resistance of the different layers between the anode GDL and the cathode flowfield. Because of the various losses described previously, PEFCs releases waste heat, which increases with current density and leads to an increase in the measured heat fluxes. At 0.65 A.cm−2 the cathode heat flux changes direction, meaning heat is being released by the cell on this side (Fig. 5a), while the total heat flux remains negative (Fig. 5b). The total heat flux reaches 0 at around 1.15 A.cm−2 (Fig. 5b). For a PEFC stack, this means that the heat released on the cathode by the reaction is entirely consumed for the evaporation on the anode of the adjacent cell. The point where each cell would be cooling its neighbor is the operation point that should be used. The maximum current density for this operation point still has potential for improvement, for example by increasing the temperature.
Knowing the heat fluxes due to evaporation only, a theoretical value for the heat flux released by the fuel cell during operation can be computed directly from the performance of the cell as:

with the theoretical voltage  —based on the enthalpy change of the hydrogen oxidation reaction—being equal to either 1.48 V if all the water produced by the reaction leaves the cell as liquid or 1.23 V if it leaves as vapor,
  the measured voltage,
  the current density and
  the measured total heat flux due to evaporation only (when no current is drawn).
We compare the evolutions with respect to the current density of the total measured heat flux  and the theoretical heat flux
  computed if the water produced leaves as liquid or as vapor (Fig. 5b). The measured heat flux is in good agreement with the theoretical value for liquid water as the reaction product. This can be interpreted as the fact that the overall evaporation rate is not increased by the production of water by the chemical reaction, and that this additional water leaves the cell in liquid state.
Impact of operation on water management
The previous statement only applies to the global amount of vapor leaving the cell. More insight was gained by placing a relative humidity sensor (RHS) at the outlet of the cathode flow, which enables quantification of the mass flow rate of vapor exiting on the cathode and thus the anode/cathode distribution of vapor. RHS are very fragile instruments, which accuracy decreases strongly for very high relative humidity (above 80%), and which are easily broken by liquid droplets. As a result, it was not possible to have such a sensor on the anode outlet, and precautions had to be taken on the cathode outlet. The instrument was heated at a temperature 5 degrees higher than the cell, so as to prevent condensation, and to ensure that the relative humidity measured would always be in the range of values where accuracy was highest. Our RHS was a Driesn and Kern DKRF417, with an accuracy of +/−1.8% between 20 and 80%RH, and which could withstand a range of temperature between −40 °C and +120 °C.
While the total evaporation rate remains approximately constant, the vapor mass flow rate at the cathode outlet increases with the current density, and, as a consequence, the mass flow rate of vapor exiting on the anode side decreases with increasing current densities (Fig. 6).
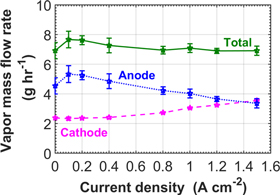
Figure 6. Evolution of the total vapor mass flow rate exiting the cell and vapor mass flow rate at the cathode outlet as a function of current density.
Download figure:
Standard image High-resolution imageThis seems contradictory with the known convection-driven evaporation on the anode, which we confirmed experimentally26 and which predicts that the evaporation from the hydrophilic lines to the anode channels only depends on the contact surface and on the gas flow. The electro-osmotic drag, i.e. the transport of vapor molecules by protons crossing the membrane from anode to cathode, could explain this behavior. Indeed, the electro-osmotic drag, which increases with current density, needs to be supplied by vapor in the liquid-free hydrophobic regions, resulting in a lower net output of vapor at the anode (see Fig. 7). In any case, while the evaporation remains globally constant, the balance of vapor is altered in favor of transport to the cathode side. This is of high importance in the perspective of applying this concept to cells of larger dimensions, as is discussed next. This seems contradictory with the known convection-driven evaporation on the anode, which we confirmed experimentally, and which predicts that the evaporation from the hydrophilic lines to the anode channels only depends on the contact surface and on the gas flow. The electro-osmotic drag, i.e. the transport of vapor molecules by protons crossing the membrane from anode to cathode, could explain this behavior. Indeed, the electro-osmotic drag, which increases with current density, needs to be supplied by vapor in the liquid-free hydrophobic regions, resulting in a lower net output of vapor at the anode (see Fig. 7). In any case, while the evaporation remains globally constant, the balance of vapor is altered in favor of transport to the cathode side. This is of high importance in the perspective of applying this concept to cells of larger dimensions, as is discussed next.

Figure 7. Schematic representation of the water vapor transport with (a) and without (b) current.
Download figure:
Standard image High-resolution image
Upscaling Perspectives
In order to gain a good level of understanding, the cell was scaled down to small dimensions while the flow rates of gases were kept equal in order to have representative values for the gases velocities, leading to very high stoichiometric ratios (Table I). The stoichiometric ratio on the anode for 400 Nml min−1 at 1 A.cm−2 is 13, and on the cathode for 1600 Nml min−1 at 1 A.cm−2 is 22. A way to look at it is to consider that the cell tested shows how the first 20 mm of a cell 10 times longer (200 mm) is behaving at 1 A.cm−2 with a stoichiometric ration the anode of 1.3. This must be taken into account when interpreting the results. In particular, humidification of a larger cell will be easier, due to the water buildup along the channels. On the other hand, the evaporation on the anode side will be limited, as our results show that the gas flow becomes nearly saturated with water vapor already after 20 mm (Fig. 3). The enhanced transfer of vapor to the cathode side when current is drawn is therefore very helpful, as it will help sustain the cooling power over the entire length of the cell.
Another point to consider is the configuration of the anode flow. In principle, a dead-ended anode would be possible with this concept; however, the water vapor would have to be entirely removed from the cell through the cathode outlet only, which would slightly diminish the total cooling power. In addition, the consumption of hydrogen on the anode would strongly decrease the H2 partial pressure, leading to an increase in the vapor partial pressure above its saturation pressure and to strong condensation and accumulation of water in the gas channels. Therefore, there are reasons to think dead-ended anode might not be the ideal configuration. In order for some water vapor to be removed also on the anode side, a re-circulation of the H2 could be used, together with a condenser to make sure that the recirculated hydrogen is always dry at the anode inlet.
The reason for injecting the water on the anode side is that is it beneficial from the humidification point of view, since a fuel cell naturally tends to transfer water vapor from the anode to the cathode by electroosmotic-drag. However, the total cooling power may be higher with cathode side injection, which also would be preferred from the system point of view. Future work is expected to elucidate the effectiveness of cathode side injection.
Regardless of these constraints—which are shared by all evaporative cooling designs as a given gas flow can only take up a limited amount of vapor—the experimental results presented in this paper have demonstrated that the imbibition rate of the GDL with patterned wettability is fast enough to sustain evaporative cooling power of up to 1.2 W.cm−2. Optimizations of the components (e.g. geometry of the hydrophilic/hydrophobic regions, characteristics of the porous substrates, flowfield geometries), and operating conditions (e.g. temperatures, pressures and mass flow rates, cell compression) are expected to further increase this cooling power while reducing cell overpotentials.
Conclusions
Despite their potential to enable pollution-free, long-range, and fast-refilling transportation, commercialization of PEFCs is hindered by elevated costs, which are mainly driven by complex and bulky system components. Evaporative cooling is a promising concept to reduce fuel cell complexity by eliminating the need for separate humidification and cooling systems. Here, we present a novel method, based on capillarity-driven water injection through the anode porous diffusion layer, which enables simultaneous cooling of the cell and humidification of the membrane. While we measured a slight loss in maximal power, the reduction in volume is such that the entire system could still see an increase of up to 35% in power density. We thoroughly investigated the coupled mass and heat transport phenomena by employing a combination of electrochemical diagnostics, thermal devices, and neutron radiography. We demonstrate that the method is robust, flexible, and scalable which opens an encouraging route for low cost, compact polymer electrolyte fuel cells for automotive applications.
Acknowledgments
The Swiss Competence Center for Energy Research: Efficiency in Mobility (SCCER Mobility) and the Swiss National Science Foundation (project grants no. 143432 and 172474) are gratefully acknowledged for their financial support.