

Abstract
The stoichiometric 1:1 combination of LiX (X = OCH2CF3, OC(H)(CF3)2, CO2CF3) with BF3·D (D = dimethyl carbonate, ethylene carbonate, ethyl methyl carbonate, propylene carbonate and diethyl ether) yields an electrolyte with a significantly increased conductivity in comparison to pure LiX in EC:EMC (3:7 wt%). The combination of Li[CO2CF3] and BF3·EC displays with 5.8 mS·cm–1 (1.5 mol·L–1) the highest conductivity of all investigated systems, which is also higher than that of LiBF4 in the same solvent. NMR studies of all composite electrolytes show the presence of various boron species like BX3, Li[BF3X], Li[BF2X2] and Li[BFX3], which distribute characteristically for each LiX. The investigation of the electrochemical behavior of the composite electrolytes in Li[Ni0.33Mn0.33Co0.33O2]/graphite cells showed a direct relation between cycling behavior, impedance and boron content on CEI/SEI. In the differential plots of the first cycle, an irreversible oxidation was observed in all cells, which is attributed to the formation of the SEI of the composite electrolyte. Ex situ analysis of the electrodes with XPS showed an increase of the boron content on the surface of both electrodes in the order of Li[OC(H)(CF3)2] < Li[OCH2CF3] < Li[CO2CF3]. This ordering was also found for the growth of the impedance of the cells.
Export citation and abstract BibTeX RIS
Lithium ion batteries (LIBs) enable the widespread and continuous use of electronic devices as portables and power electromobility with growing importance. In most of the LIBs, a LiPF6 based electrolyte is used for the lithium ion transport between the electrodes. The advantages of LiPF6 like high ionic conductivity at moderate temperature and the formation of a stable solid electrolyte interface (SEI) overcome the many disadvantages,1–3 i.e. its high toxicity and the occurrence of side reactions in the presence of already trace water or at higher temperature.4–6 Many attempts have been made to replace LiPF6 as conductive salt.7 For example, LiBF4 was investigated, but its ionic conductivity is not high enough due to the low dissociations constant/ionicity.8,9 The clear advantages of LiBF4, like low toxicity, better passivation of the Al current collector or better cycling performance at elevated temperatures, do not compensate the low room temperature conductivity.6
Inspired by this, the replacement of fluorine in [BF4]– by a weakly coordinating group (X) should lower the affinity between the lithium ion and the anion and thus decrease ion pairing, but increase the ionic mobility.10,11 Several patents describe LIB electrolytes based on Li[BX4] (with X = OCH2CF3,12–16 OC(H)(CF3)2,12,17–24 CO2CF325–43). Furthermore, patents for Li[BF3X] (with X = OCH2CF3,44 OC(H)(CF3)2,44 CO2CF336,45), Li[BF2X2] (with X = CO2CF335,36,46) and Li[BFX3] (with X = CO2CF335,36) were claimed. Investigations of such weakly coordinating anions47,48 (WCAs) of the general type [BFxX4−x]– as LIB electrolyte salts are known for the tetrasubstituted versions Li[BX4] (with X = OCH2CF3,5 OC(H)(CF3)2,49 CO2CF350). Both lithium salts of Li[BX4] (with X = OCH2CF3, CO2CF3) display a good thermal stability (Li[B(OCH2CF3)4] T > 271 °C and Li[B(CO2CF3)4] T > 94 °C) and electrochemical stability between 0 V and 4.8 V vs Li+/Li. Furthermore, Li[B(OCH2CF3)4] is long term stable in water, while Li[B(CO2CF3)4] displays high ionic conductivity (8.1 mS·cm–1 in PC:DMC (1:2 vol%) at 1.0 mol·L–1).5,50 Closely related, Olah et al. reported [CF3CH2OH2][BF3(OCH2CF3)] as a superacidic catalyst with an acidity comparable to 100% anhydrous sulfuric acid.51 Also Li[BF3(OC(H)(CF3)2)] was synthesized and identified though NMR spectroscopy.49
Here we present the full investigation of electrolyte systems resulting from the combination of our recently reported BF3 carbonate adducts—that were favourably studied as additives for LIBs52—and LiX forming WCAs of the type [BFxX4−x]–. The composite electrolytes were studied by concentration-dependent conductivity measurements to find optimized concentration-conductivity-relationships, and NMR studies on the nature of the [BFxX4−x]– anions present in the electrolytes mixtures. Electrochemically, the systems were studied up to the full-cell level in Li[Ni0.33Co0.33Mn0.33O2]/graphite cells followed by an ex situ analysis of both electrodes after cycling.
Experimental
General methods and materials
All syntheses and measurements were done in an inert argon atmosphere using standard Schlenk techniques or glove boxes (Jacomex GPT4 or MBraun, H2O and O2 content ≤ 1 ppm). BF3 (UHP 2.5, Linde GmbH) and carbonates (battery grade, BASF SE) were used for the adduct syntheses as well as for electrolyte preparation. BF3·D (with D = dimethyl carbonate (DMC), ethylene carbonate (EC), ethyl methyl carbonate (EMC) and propylene carbonate (PC)) was synthesized by introducing an excess of gaseous BF3 into the corresponding carbonate as recently described.52 BF3·O(CH2CH3)2 (>98%, Merck) was distilled under vacuum. The solvent free lithium alkoxides Li[OCH2CF3] and Li[OC(H)(CF3)2] were synthesized by reaction of the alcohols HOCH2CF3 (99+%, AlfaAesar) and HOC(H)(CF3)2 (99+%, AlfaAesar) with LiH (> 97%, Merck) in n-Hexane (99%, Sigma/Aldrich).53 The commercial lithium salt Li[CO2CF3] (97%, AlfaAesar) was dried prior to use under dynamic vacuum (10–3 mbar at 150 °C).
Conductivity measurements
For concentration-dependent conductivity measurements, 1:1 stoichiometric amounts of LiX (with X = OCH2CF3, OC(H)(CF3)2, CO2CF3) and BF3·D were weighed into a flask and dissolved in EC:EMC (3:7 wt%, battery grade, water content ≤ 50 ppm, L57, BASF SE) and stirred overnight. The concentration-dependent conductivity measurements were carried out using a Mettler Toledo InLab710 conductivity electrode and a Mettler Toledo S30 SevenEasyTM conductometer under argon atmosphere inside a glove box (Jacomex GPT4, H2O and O2 content ≤ 1 ppm). NMR measurements of all mixtures were carried out before conductivity measurements with a Bruker Avance II + WB 400 MHz and Bruker Avance III HD 300 MHz spectrometer in 5 mm NMR tubes with the deuterated solvent CD3CN. The corresponding spectra were analyzed and visualized by the software package Topspin 4.0.6. Further experimental details, procedures and NMR spectra of the mixtures are deposited in the supplementary information (SI) (available online at stacks.iop.org/JES/167/080507/mmedia).
Quantum chemical investigations
DFT optimizations were carried out with TURBOMOLE54,55 (Version 7.2) in the highest possible point group at 0 K using the BP8656,57 functional with RI-J approximation58,59 in combination with the def2-TZVPP60–62 or def-TZVP63 basis set in combination with D3(BJ) dispersion correction. The frequency analyses for the calculations of vibrational frequencies and zero point energies were executed with AOFORCE.64,65 The absence of imaginary vibrational frequencies was checked. The reaction enthalpies and the Gibbs reaction energies were corrected by zero point energies and thermal corrections of the enthalpy and entropy at 298 K. Equation 9 (see Table III) below is the only non-isodesmic investigated reaction, which in addition produces the much smaller, and thus much better solvated ion [BF4]– together with very polar carbonate molecules. Only here, ΔrG0 was corrected for solvation by the COSMO model66 at (RI-)BP86(BJ)/def-TZVP level by using the published permittivity of L5767 of 18.5.
Cyclic voltammetry
The cyclic voltammograms were recorded with a Metrohm Autolab PGSTAT101 potentiostat inside a glove box (Jacomex GPT4, H2O and O2 content ≤ 1 ppm) with a three-electrode setup of the electrochemical cell. The working electrode consisted of platinum (Metrohm 6.1204.190 Pt, 1 mm diameter) or glassy carbon (Metrohm 6.1204.600 GC, 2 mm diameter). The reference and counter electrode consisted of lithium (lithium foil, BASF SE). All measurements were carried out with a sweep rate of 0.01 V·s–1. The spectra were analyzed by the software package NOVA 2.0.
Cell assembly
CR 2032 coin cells were prepared in an argon filled glove box (MBraun, H2O and O2 content ≤ 1 ppm). Positive electrode tapes consisting of Li[Ni0.33Co0.33Mn0.33O2] (93% active material with 3% conductive carbon Super C65 and 4% poly(vinylidenedifluoride) binder (PVDF), 14 mm diameter, NCM, BASF SE) and negative electrode tapes consisting of graphite (95.7% graphite with 0.5% conductive carbon Super C65 and 3.8% binder composed of sodium carboxymethyl cellulose (CMC) and styrene butadiene rubber (SBR), 15 mm diameter, BASF SE) were used. A three-layered system was used as separator to ensure the extraction of the electrode of the cells after cycling for ex situ surface analysis. The sequence of separators was: Celgard 2500 (19 mm diameter) / GF/D (19 mm diameter, Whatman)/ Celgard 2500 (19 mm diameter). LiX and BF3 carbonates (1:1 stoichiometric ratio) were mixed and stirred overnight as electrolytes and had a lithium ion concentration of 1.0 M in L57 (3:7 wt%, EC:EMC, battery grade, water content ≤ 50 ppm, BASF SE).
Electrochemical testing
An Arbin BT2000 battery cycler was used for constant current charge/discharge measurements in a potential range between 3.0 V to 4.2 V at 25 °C. The cycling protocols started with an open circuit voltage (OCV) measurement, followed by five formation steps (specific nominal capacity of 150 mAh·g−1 per step. Formation: one step with a current rate (C-rate) of C/20, two steps with C/10, followed by two steps with C/5) and cycling for 50 steps with a constant charge/discharge C-rate of C/2. All cells were prepared in duplicate to confirm reproducibility of the cycling behavior. Representative cycling data are presented below.
After the 55 cycles, at 0% state of charge (SOC) electrochemical impedance spectroscopy (EIS) measurements were performed on a Bio-Logic potentiostat with a perturbation of 10 mV and in the frequency range of 300 kHz–10 mHz. EIS measurements were carried out at 25 °C and repeated three times (with an OCV step before each EIS measurement).
Ex situ surface analysis
All cells were transferred and disassembled in an argon filled glove box (MBraun, H2O and O2 content ≤ 1 ppm) after EIS measurements. The positive and negative electrodes were rinsed three times with ethyl methyl carbonate (3 × 500 μL) to remove residual electrolyte from the electrode surface and dried overnight in the glove box prior to surface analysis. X-ray photoelectron spectroscopy (XPS) was acquired with a Thermos K-Alpha system using monochromatized Al K α radiation (hν = 1486.6 eV) under ultra-high vacuum (8.1·10−8 Pa). Therefore, samples were transferred into the XPS chamber with a vacuum transfer vessel from Thermo Scientific. The spectra obtained were analyzed by using the Thermos Advantage software (Version 5.988). The binding energy was corrected based on the C 1s orbital energy of hydrocarbon at 284.8 eV for all spectra.68 The assignments of the binding energy of the components are from the NIST XPS database.69
Results and Discussion
Basic idea underlying the investigations was to increase the ionic conductivity of electrolytes that are related to LiBF4, which—although principally having many positive aspects such as low toxicity, good availability and increased stability towards water—suffer from the insufficient ionic conductivity values that typically reach 3.0 mS·cm–1 to 3.7 mS·cm–1 for 1.0 mol·L–1 solutions in typical battery solvents.70–72 Thus, by including a larger anionic fragment X– (Eq. 2) instead of the F– in [BF4]– (Eq. 1),


we intended to prepare [BF3X]– anions, in which the negative charge is well delocalized and which should be favorable in terms of suppressing ion pair formation and induce increased dissociation as schematically shown in Eq. 3,

However, often the symmetrical compounds are more stable than the mixed anions like [BF3X]– and thus they may dismutate according to Eqs. 4 to 7,


possibly giving the full range of solvated [BFxX4-x]– anions with x = 0–4. This may—positive or negative—influence the ionic conductivity values in a given solvent. It can be easily followed by 11B and 19F NMR measurements.
Thus, we used three lithium salts LiX (X = OCH2CF3, OC(H)(CF3)2, CO2CF3) and suitable BF3·D compounds to prepare according to Eq. 2 electrolytes with the [BF3X]– anion that should supress ion pairing as described by Eq. 3, but may be influenced by dismutation reactions according to Eqs. 4–7. As orienting investigations, we set out to determine the right stoichiometry between LiX and the BF3·D compound, before looking in more detail at the concentration-dependent conductivities obtained using the preferred stoichiometric ratio (1:1) and investigating the speciation in these mixtures by NMR spectroscopy. The speciation was also studied by DFT calculations, before the mixtures were used for electrochemical testing in NCM/graphite cells.
Orienting conductivity measurements
The pure lithium salts LiX (X = OCH2CF3, OC(H)(CF3)2, CO2CF3) display poor ionic conductivity (0.05 mS·cm–1 to 0.46 mS·cm–1 at 1.5 mol·L–1) in mixed carbonate solvents like L57 (3:7 wt% EC:EMC, EC = ethylene carbonate; EMC = ethyl methyl carbonate). For comparison, LiBF4 or LiPF6 in L57 with a concentration of 1.0 mol·L–1 have conductivities of 3.5 mS·cm–1 or 7.5 mS·cm–1. The reason for the low ionic conductivity of pure LiX presumably is the good accessibility of the negative charge of the anions X–, which leads to ion-tuple formation/association with Li+ and to a lower mobility of the lithium ions.
Upon addition of commercially available BF3 OEt2 in a 1:1 or 1:2 stoichiometric ratio to LiX as a pre-test, all measured conductivities increased significantly (Table I). The ionic conductivity is increasing from 0.05 mS·cm–1 to 1.44 mS·cm–1 for Li[OCH2CF3], 0.21 mS·cm–1 to 3.22 mS·cm–1 for Li[OC(H)(CF3)2] and 0.46 mS·cm–1 to 3.08 mS·cm–1 for Li[CO2CF3] for the stoichiometric ratio of 1:1. The doubling of LiX from 1 to 2 equivalents led only for Li[OC(H)(CF3)2] to an increase of the ionic conductivity (from 3.08 mS·cm–1 for 1:1 to 4.69 mS·cm–1 for 2:1), while the others display lower conductivities due to the maximum of solubility of LiX in L57.
Table I.
Ionic conductivity of pure lithium salts LiX (with X = OCH2CF3, OC(H)(CF3)2, CO2CF3) and composite electrolytes of LiX with BF3·OEt2 and BF3EMC in different stoichiometric ratios (1:1 and 2:1) in L57 at a concentration of 1.5 mol·L–1 at 25 °C. For comparison, the ionic conductivity LiBF4 and LiPF6 in L57 with a concentration of 1.0 mol·L–1 is added.
| LiX | BF3·D | Ratio of LiX:BF3·D | σ [mS·cm−1] |
|---|---|---|---|
| Li[OCH2CF3] | — | 0.05 | |
| BF3·OEt2 | 1:1 | 1.44 | |
| BF3·EMC | 1:1 | 2.06 | |
| BF3·OEt2 | 2:1 | 1.11 | |
| BF3·EMC | 2:1 | 0.77 | |
| Li[OC(H)(CF3)2] | — | 0.21 | |
| BF3·OEt2 | 1:1 | 3.22 | |
| BF3·EMC | 1:1 | 3.39 | |
| BF3·OEt2 | 2:1 | 4.69 | |
| BF3·EMC | 2:1 | 4.26 | |
| Li[CO2CF3] | — | 0.46 | |
| BF3·OEt2 | 1:1 | 3.08 | |
| BF3·EMC | 1:1 | 5.21 | |
| BF3·OEt2 | 2:1 | 3.03 | |
| BF3·EMC | 2:1 | 2.78 | |
| LiBF4 (1.0 mol·L–1) | 3.5 | ||
| LiPF6 (1.0 mol·L–1) | 7.5 |
Since several studies have shown that ethers are not suitable for applications in LIBs,7 BF3 adducts containing organic carbonates, which are anyway present as solvent in LIBs, were synthesized according to our recently published protocol.52 The exemplarily tested composite electrolytes prepared from BF3·EMC and LiX in L57 showed significantly higher ionic conductivities in both stoichiometric ratios (1:1 and 1:2) than the pure lithium salts. The highest ionic conductivity was observed for Li[CO2CF3] and BF3·EMC (1:1 ratio) with 5.21 mS·cm–1. In addition, and used in 1:1 ratio, the carbonate donor EMC induced considerably higher conductivities than the ether donor. Since the ionic conductivity differences between 1:1 and 1:2 mixes were not too drastic and for keeping the electrolytes economic, in the following measurements always a stoichiometric ratio of 1:1 was used for the combination of LiX with BF3·D.
Concentration-dependent conductivity measurements in combination with NMR spectroscopy of LiX and BF3·D
Starting from the concentration of 1.5 mol·L–1, all composite electrolytes containing LiX (with X = OCH2CF3, OC(H)(CF3)2, CO2CF3) and BF3D (with D = dimethyl carbonate (DMC), ethylene carbonate (EC), ethyl methyl carbonate (EMC), propylene carbonate (PC), diethyl ether (OEt2)) in L57 as solvent were diluted stepwise until the final concentration of 0.1 mol·L–1 was reached. Moreover, all starting mixtures (1.5 mol·L–1) were investigated by NMR spectroscopy before measuring the conductivities. In the SI, tables including all measured conductivities (Tables SI–SIII) are listed and the respective NMR spectra are displayed (Figs. S1–S15).
Concentration-dependent conductivity measurements of the composite electrolytes
The overall ionic conductivity is increasing as [OCH2CF3]− < [OC(H)(CF3)2]− < [CO2CF3]−, which follows the increasing strengths of the corresponding acids H−X as evaluated by their aqueous pKa-values, i.e. 12.40 < 9.30 < 0.23.73–75 For all electrolyte mixtures, the ionic conductivities displayed in Fig. 1 were lower, if the ether adduct BF3·OEt2 was used in conjunction with any LiX. The spread of the ionic conductivity values, if using composite electrolytes of BF3·D (with D = carbonate) with LiX, were astonishingly rather widespread as a function of D. For the least favorable composite electrolytes of BF3D (with D = carbonate) and Li[OCH2CF3], the conductivities were similar within 0.25 mS·cm–1 (Fig. 1, left). The highest conductivities reached rather low 2.06 mS·cm–1 to 2.31 mS·cm–1 at a concentration of 1.5 mol·L–1.

Figure 1. Concentration-dependent conductivity measurements of LiX (with X = OCH2CF3 (left), OC(H)(CF3)2 (middle), CO2CF3 (right)) and BF3·D (with D = DMC, EC, EMC, PC, OEt2) with the stoichiometric ratio of 1:1 in L57 at 25 °C. For comparison the ionic conductivity of LiBF4 in L57 with a concentration of 1.0 mol·L−1 is added as gray hatched lines. The color notation in the left plot giving the BF3·D used is valid for all three graphics.
Download figure:
Standard image High-resolution imageBy contrast, and changing to the superior Li[OC(H)(CF3)2] and Li[CO2CF3] salts, their composite electrolytes with BF3·D showed a larger spread of the conductivities as a function of D that may reach about 1 mS·cm–1. The highest electrical conductivities with Li[OC(H)(CF3)2] and BF3·D were found at the concentration of 1.1 mol·L–1 (3.43 mS·cm–1 to 4.41 mS·cm–1, Fig. 1, middle), while those with Li[CO2CF3] and BF3D showed the highest conductivities between 1.3 mol·L–1 and 1.5 mol·L–1 and reached 5.03 mS·cm–1 to 5.81 mS·cm–1 (Fig. 1, right). For both salts, the mixtures with BF3·EC, including the organic carbonate with the highest dielectric constant (εr = 90)76 of all used carbonates, led to the highest conductivities. The combination of Li[CO2CF3] with BF3·D (with D = carbonate) in L57 showed the highest conductivities of all the investigated mixtures. Starting with a concentration of 0.5 mol·L–1, they are consistently higher than that of a 1.0 molL–1 solution of LiBF4 in L57 used as a reference.
11B NMR spectra of the composite electrolytes at 1.5 mol·L–1
To investigate the dismutation according to Eqs. 4–7, NMR measurements were done. The 11B NMR spectra display three borates in all composite electrolytes (Table II). Of those, [BF4]− and the single substituted [BF3X]– are with 24%–65% and 8%–67% typically the main components. Only for Li[OC(H)(CF3)2], the anion [BF2X2]− is with 22%–26% a dominant part of the mixture. For all LiX/BF3·D systems, the product distribution is in equilibrium at room temperature and chemical exchange between different borate species in solution occurs according to 19F,19F NOESY NMR spectroscopy (Figs. S23–S31).77 Only the mixtures with Li[OCH2CF3] furnished a larger portion of the neutral borane BX3 that may have formed according to Eq. 8,

or a related path. Since the neutrals are not participating in the lithium ion transfer and the fluoride F– would react further or ion pair with Li+, Eq. 8 probably accounts for the low ionic conductivity of the respective composite electrolytes including Li[OCH2CF3] that are all lower than that of pure LiBF4. The threefold substituted [BFX3]− was observed only for Li[OC(H)(CF3)2] at a low relative concentration of 3%–4%.
Table II.
Integrals of the observed borane and borate species in the 11B NMR spectra of LiX (with X = OCH2CF3, OC(H)(CF3)2, CO2CF3) and BF3·D (with D = DMC, EC, EMC, PC, OEt2) in L57 in percentage [mol%]. Conductivities of LiX and BF3D at a concentration of 1.5 mol·L−1 are added.
| BX3 | [BF4]− | [BF3X]− | [BF2X2]− | [BFX3]− | ||
|---|---|---|---|---|---|---|
| 1:1 ratio of LiX:BF3·D | all in [mol%] | σ [mS·cm–1] at 1.5 mol·L–1 | ||||
| Li[OCH2CF3] with | ||||||
| BF3·DMC | 24 | 58 | 10 | 8 | — | 2.30 |
| BF3·EC | 27 | 59 | 9 | 5 | — | 2.31 |
| BF3·EMC | 27 | 65 | 8 | — | — | 2.06 |
| BF3·PC | 33 | 58 | 9 | — | — | 2.31 |
| BF3·OEt2 | 27 | 59 | 8 | 6 | — | 1.44 |
| Li[OC(H)(CF3)2] with | ||||||
| BF3·DMC | — | 29 | 41 | 26 | 4 | 3.54 |
| BF3·EC | — | 32 | 42 | 23 | 3 | 4.12 |
| BF3·EMC | — | 31 | 43 | 22 | 4 | 3.39 |
| BF3·PC | — | 32 | 43 | 22 | 3 | 4.06 |
| BF3·OEt2 | — | 30 | 42 | 25 | 3 | 3.22 |
| Li[CO2CF3] with | ||||||
| BF3·DMC | — | 24 | 66 | 10 | — | 5.03 |
| BF3·EC | — | 28 | 65 | 7 | — | 5.81 |
| BF3·EMC | — | 26 | 67 | 7 | — | 5.21 |
| BF3·PC | — | 46 | 51 | 3 | — | 5.18 |
| BF3·OEt2 | — | 50 | 48 | 2 | — | 3.08 |
Although the ionic conductivity values using one type of LiX vary considerably as a function of D = carbonate, the typical compositions of the electrolytes are rather stable and just differ by a few percent. Exceptions present only D = OEt2 and PC combined with Li[CO2CF3]. The Li[CO2CF3]/BF3D combination (with D = carbonate), shows ionic conductivities that are significantly higher than that for LiBF4 in L57. The main component in these mixtures is according to the NMR analysis the [BF3X]– anion, so that one may suggest that this component might contribute positively to the conductivity. However, the ionic conductivity of LiPF6 in L57 is 7.5 mS·cm–1 at 1.0 mol·L–1 and still higher than that of the best composite electrolyte formed by Li[CO2CF3] and BF3EC in L57 (5.81 mS·cm–1).
Attempts to purify [BFxX4-x]– for further conductivity measurements
To investigate the individual ionic conductivities of the lithium borates like Li[BF3X], Li[BF2X2] or Li[BFX3] (with X = OCH2CF3, OC(H)(CF3)2, CO2CF3) several reactions were carried out.78–81 However, all attempts of purifying these lithium borates failed for all investigated LiX. These reactions are described in the SI (Chapter 5). This is in agreement with the chemical exchange observed for all electrolytes in the NMR spectra. Furthermore, the compositions of each electrolyte are stable over months at ambient temperature. It suggests that it might be impossible to prepare the pure lithium borates under all tested stoichiometric ratios and solvent combinations.
Quantum chemical investigations of the composite electrolytes and their ionic species
The 11B NMR investigations revealed for lithium salts combined with BF3D (with D = carbonate) the presence of several borates [BFxX4-x]– (with X = OCH2CF3, OC(H)(CF3)2, CO2CF3). In order to examine the suitability of these anions as electrolytes in LIBs quantum chemical calculations at (RI-)BP86(BJ)/def2-TZVPP level were performed.
The calculated molecular orbital energies shown in Fig. 2 are related to the stability of the anions against reduction and oxidation. The lower the HOMO energy, the more stable are the anions against oxidation of the positive electrode. The HOMO energies are lowering according to [BFx(OCH2CF3)4-x]– > [BF4]– > [BFx(OC(H)(CF3)2)4-x]– > [BFx(CO2CF3)4-x]–, while the energies of the LUMO are decreasing in the order of [BF4]– > [BFx(OCH2CF3)4-x]– > [BFx(OC(H)(CF3)2)4-x]– > [BFx(CO2CF3)4-x]–. The HOMO-LUMO gap is decreasing in the order of [BF4]– > [BFx(OC(H)(CF3)2)4-x]– > [BFx(OCH2CF3)4-x]– > [BFx(CO2CF3)4-x]–. These energies are indicating the stability of the anions against reduction and the least stable in this respect appear to be the borates [BFx(CO2CF3)4-x]–.

Figure 2. Molecular orbital energies and electrostatic potentials of [BFxX4-x]– (with X = F, OCH2CF3, OC(H)(CF3)2, CO2CF3) projected onto an isodensity surface (0.01 e·Å−3, calculated at (RI-)BP86(BJ)/def2-TZVPP level).
Download figure:
Standard image High-resolution imageThe influence of the electron withdrawing substituents X– and their electrostatic potentials are shown in Fig. 2. The strengths of the electron withdrawing group decreases in the order of [CO2CF3]− > [OC(H)(CF3)2]− > [OCH2CF3]− (cf. to the pKa-values mentioned above). The delocalization of the negative charge apparently should lead to reduced interactions between cation and anion and to a better lithium ion mobility. This observation is with the exception of X = OCH2CF3 confirmed by the ionic conductivity measurements.
Quantum chemical investigations of the reaction enthalpies (ΔrH0) and Gibbs reaction energies (ΔrG0) of the dismutation reactions of [BF3X]−, [BF2X2]− and [BFX3]− according to Eqs. 4–7 were performed (Table III). The calculations of ΔrH0 and ΔrG0 were carried out at the (RI-)BP86(BJ)/def2-TZVPP level in the gas phase, include zero-point energy corrections and were corrected for thermal contributions to enthalpy and free energy at 298 K. The dismutation reactions are isodesmic, the same number and type of bonds were formed/broken and the total charge of the compounds is not changing during the reaction. Thus, we expect that they are therefore close to the expectation values to be observed in the electrolyte. The Gibbs reaction energies provide information, if the dismutation reaction can thermodynamically take place (ΔrG0 < 0, exergonic) or not (ΔrG0 > 0, endergonic).
Table III. Quantum chemical investigations of ΔrH0 and ΔrG0 of the dismutation reactions calculated at level (RI-)BP86(BJ)/def2-TZVPP.a) For details to the calculations with each carbonate see SI (Chapter 7).
| ΔrH0 [kJ·mol–1] | ΔrG0 [kJ·mol–1] | |||
|---|---|---|---|---|
| (4) | 2 [BF3X]− → [BF2X2]– + [BF4]– | |||
| with X = | OCH2CF3 | 5.1 | 12.5 | |
| OC(H)(CF3)2 | 9.7 | 18.4 | ||
| CO2CF3 | 20.7 | 29.2 | ||
| (5) | 2 [BF2X2]− → [BFX3]− + [BF3X]– | |||
| with X = | OCH2CF3 | –11.0 | –10.4 | |
| OC(H)(CF3)2 | 2.3 | 8.2 | ||
| CO2CF3 | 7.7 | 5.5 | ||
| (6) | 2 [BFX3]− → [BF2X2]− + [BX4]− | |||
| with X = | OCH2CF3 | 10.4 | 15.6 | |
| OC(H)(CF3)2 | –6.9 | –8.4 | ||
| CO2CF3 | 8.7 | 12.9 | ||
| (7) | 2 [BF2X2]− → [BX4]− + [BF4]– | |||
| with X = | OCH2CF3 | –6.5 | 7.3 | |
| OC(H)(CF3)2 | 7.4 | 26.4 | ||
| CO2CF3 | 44.9 | 53.1 | ||
| (9) | BF3D + [BFX3]– → BX3 + [BF4]– + D |
with D = carbonateb) | ||
| with X = | OCH2CF3 | 43.2 to 51.5 | 3.3 to 16.8 (–76.2 to –52.7)b) | |
| OC(H)(CF3)2 | 66.0 to 74.3 | 15.8 to 29.3 (–73.9 to –50.0)b) | ||
| CO2CF3 | 177.4 to 185.7 | 136.0 to 149.5 (45.7 to 69.6)b) | ||
a)All calculations approximate the situation in the gas phase, include zero-point energy corrections and were corrected for thermal contributions to enthalpy and free energy at 298 K. b)Equation 9 is the only non-isodesmic reaction which in addition produces the much smaller, and thus much better solvated ion [BF4]– together with very polar carbonate molecules. Here it appeared wise to include a solvation model to the calculation. ΔrG0 corrected for solvation by the COSMO model at the (RI-)BP86(BJ)/def-TZVP level is included in parenthesis. The permittivity of L57 was recently measured as εr = 18.5 and used.67
The calculated thermodynamics collected in Table III are in a good agreement with the borate species, which were observed in the NMR spectra. For Li[OCH2CF3]/BF3D no [BF2X2]– species in the 11B NMR spectra were observed. In agreement with this, the dismutation reaction Eq. 5 of the [BF2X2]– ion was calculated to be exergonic by ΔrG0 = –10.4 kJmol–1. For this composite electrolyte system primarily [BF4]– and BX3 were detected. The neutral BX3 may have formed from the [BFX3]– intermediate in a follow-up reaction according to Eq. 9. Yet, this is the only non-isodesmic reaction in Table III, which in addition produces the much smaller, and thus much better solvated ion [BF4]– together with very polar carbonate molecules. Thus, here it appeared wise to include a solvation model to the calculation. Therefore, ΔrG0 was corrected for solvation by the COSMO model66 at the (RI-)BP86(BJ)/def-TZVP level, included in parentheses with Table III. ΔrG0 now turns exergonic for X = OCH2CF3 (–76.2 kJmol–1 to –52.7 kJmol–1) and OC(H)(CF3)2 (–73.9 kJmol–1 to –50.0 kJmol–1; see SI Chapter 7 for detailed information)—which is in good agreement to the observations by NMR spectroscopy for X = OCH2CF3. The formation of neutral B(OCH2CF3)3 is favored by the lowest Lewis acidity of all BX3 molecules, as evidenced by its low fluoride ion affinity (FIA)82 compared to the other BX3 molecules (FIA = 369 of B(OCH2CF3)3/398 of B(OC(H)(CF3)2)3/505 of B(CO2CF3)3). The increased FIA in comparison to B(OCH2CF3)3 is the origin that no neutral BX3 were observed for X = OC(H)(CF3)2.
Furthermore, in the Li[OC(H)(CF3)2]/BF3D electrolyte system the minor component is [BFX3]− with 3%–4%, which is also in a good agreement with the calculations (ΔrG0 = –8.4 kJmol–1 for Eq. 6). Here the dismutation of [BF3X]− and [BF2X2]− (dismutation to [BX4]− and [BF4]−) display the most endergonic Gibbs energies. This is also the case for the composite electrolyte of Li[CO2CF3]/BF3D, which is in a good agreement with the 11B NMR spectra were primarily [BF3X]− and [BF4]− were detected.
Cyclic voltammetry of the electrolytes of LiX and BF3·DMC
To investigate the stability of the composite electrolytes, solutions of LiX with BF3·DMC (ratio 1:1) were prepared (0.1 mol·L–1 in 1:1 wt% EC:DMC, L30), and multi-sweep cyclic voltammetry (CV) experiments between 0 V-3 V (Figs. 3a–3c) and 3 V-5 V (Figs. 3d–3f) vs Li+/Li were performed.

Figure 3. Cyclic voltammograms (5 scans) in the potential range of 0 V–3 V and 3 V–5 V of BF3DMC with (a) and (d) Li[OCH2CF3], (b) and (e) Li[OC(H)(CF3)2], (c) and (f) Li[CO2CF3] at a concentration of 0.1 mol·L–1 in EC:DMC (1:1 wt%) as solvent with a sweep rate of 0.01 V·s–1. The color notation in the first plot giving the different cycles is valid for all.
Download figure:
Standard image High-resolution imageBoth, Li[OCH2CF3] and Li[OC(H)(CF3)2] combined with BF3DMC show no waves in the cathodic scans and the different scans hardly differ from each other (Figs. 3a and 3b). The current density increases for both composite electrolytes at potentials below 0.5 V (around 0 V: –98 μA·cm–2 for Li[OCH2CF3] with BF3DMC and –250 μA·cm–2 for Li[OC(H)(CF3)2] with BF3·DMC). In the first anodic scan of Li[OCH2CF3] and BF3·DMC (Fig. 3d) two waves at around 3.1 V and 3.3 V occur with low current densities (up to 8.5 μA·cm–2). In every further scan, the wave at 3.1 V disappears and the wave at 3.3 V is shifted to 3.4 V with an almost equal current density for every scan. At potentials more positive than 4.3 V the current density increases up to 37 μA·cm–2. A similar observation was made for the composite electrolyte with Li[OC(H)(CF3)2] and BF3DMC showing no waves in the range of 3.0 V to 4.2 V (Fig. 3e).
The composite electrolyte of Li[CO2CF3] and BF3DMC differs in the cathodic as well as the anodic scan (Figs. 3c and 3f). In the first cathodic sweep two peaks could be observed diminishing to one wave with decreasing current density in the subsequent sweeps. The same is true for the anodic sweeps: two waves in the first sweep with decreasing current density in the following. Experiments with regenerated electrode diffusion layer show no difference to the last sweep of the forerunning experiment (not shown). This indicates that the origin of the observed waves is related to changes of the electrode surface state and not the electrolytes stability. The waves shape and the current density also support this assumption.
Due to the actually rather small current densities observed for all three composite electrolyte systems, they can be considered as stable within the potential range of 0.5 V to 4.5 V vs Li+/Li (marking the onset of electrolyte decomposition at about 15 μA·cm–2). Actually, the electrolyte containing Li[CO2CF3] and BF3·DMC is the most stable one (0.1 V-4.7 V vs Li+/Li).
Electrochemical characterization of LiX with BF3·D (with D = carbonate) in full-cells
The composite electrolytes containing LiX (with X = OCH2CF3, OC(H)(CF3)2, CO2CF3) and BF3·D (with D = DMC, EC, EMC, PC) (1.0 mol·L–1, ratio 1:1) were studied as electrolytes in NCM/graphite cells with L57 as solvent. After the formation cycles, galvanostatic cycling was carried out with a C-rate of C/2 between 3.0 V and 4.2 V at 25 °C. For comparison, cells with the conducting salts LiPF6 (1.0 mol·L–1) and LiBF4 (1.0 mol·L–1) were built additionally using the same materials.
The specific discharge capacities of cells containing the composite electrolytes are provided in Fig. 4 (top). The initial discharge capacity for cells cycled with the composite electrolytes (D = carbonate) are lower than for cells containing LiPF6 (155 mAh·g−1) or LiBF4 (141 mAh·g−1). The lowest initial discharge capacities show cells with Li[CO2CF3] and BF3D (94 mAhg−1−103 mAh·g−1) and similarly cells with Li[OCH2CF3] and BF3·D (94 mAhg−1−96 mAh·g−1). By contrast, the initial discharge capacities of cells including Li[OC(H)(CF3)2] and BF3D as electrolytes (134 mAh·g−1−137 mAhg−1) are almost as high as for cells containing LiBF4 (141 mAh·g−1), but still lower as that for cells containing LiPF6 (155 mAh·g–1).
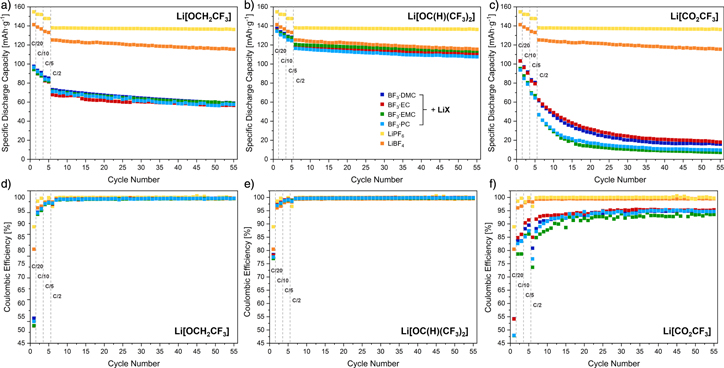
Figure 4. Discharge capacity (top) and coulombic efficiency (bottom) for NCM/graphite cells with LiX (with X = (a) and (d) OCH2CF3, (b) and (e) OC(H)(CF3)2, (c) and (f) CO2CF3) and BF3·D (D = carbonate) in L57 as electrolyte at 25 °C. Cells cycled with LiPF6 and LiBF4 in L57 as electrolyte are added for comparison. After the formation cycles (first cycle at a C-rate of C/20, followed by two cycles at a C-rate of C/10 and two cycles at a C-rate of C/5), 50 cycles with a C-rate of C/2 were performed. The notation in (b) is valid for all plots.
Download figure:
Standard image High-resolution imageThe capacity retention from the 6th to the 55th cycle is slightly higher for cells cycled with Li[OC(H)(CF3)2] and BF3·D (with D = carbonate) (92%–94%) than for cells containing LiBF4 (92%), whereas cells with LiPF6 (98%) display the highest capacity retention. The observations of the concentration-dependent conductivity measurements are inversed for the full-cell cycling of the adducts BF3·D (with D = carbonate) with Li[OC(H)(CF3)2]. Thus, the electrolytes containing the cyclic adducts BF3·EC and BF3PC showed slightly increased ionic conductivity compared to BF3·DMC and BF3·EMC. Yet, cells containing BF3·EC and BF3·PC display a slightly lower specific discharge capacity compared to cells containing BF3·DMC and BF3·EMC.
The replacement of a CF3 group by a hydrogen atom follows the trend of the concentration-dependent conductivity measurements and leads to lower capacity retentions for Li[OCH2CF3] and BF3·D (with D = carbonate) used as electrolyte (80%–84%). However, the electrochemical behavior of the cells with the respective electrolyte system of Li[OCH2CF3]/BF3·D (with D = carbonate) is very similar to their concentration-dependent conductivities.
Like observed for the initial discharge capacity, cells cycled with Li[CO2CF3] and BF3·D (with D = carbonate) display significantly lower capacity retentions (< 3%) from the 6th to the 55th cycle. Even though these composite electrolytes exhibited the highest measured conductivities (up to 5.81 mS·cm–1) that are higher than the conductivity of LiBF4 in L57.
The trend of the discharge capacities is confirmed by the coulombic efficiencies (Fig. 4, bottom) which are decreasing in the following order (after the 8th cycle): LiPF6 (≥ 99.7%) > Li[OC(H)(CF3)2]/BF3·D (≥ 99.6%) > LiBF4 (≥ 99.3%) > Li[OCH2CF3]/BF3·D (≥ 99.0%) ≫ Li[CO2CF3]/BF3·D (≥ 85.5%).
Voltage profiles of the 1st and 10th cycle and their corresponding differential capacity plots
For a better understanding of the processes during cycling, the 1st and 10th cycle of the full-cells were investigated further. While the first cycle with a C-rate of C/20 provides information of the changes during the initial cycle (e.g. formation of the SEI), the 10th cycle with a C-rate of C/2 depictures the cell in a proceeded phase. Therefore, the voltage profiles of these two cycles from cells cycled with LiX and BF3·D and their corresponding differential capacity plots are provided in Figs. 5 and 6. Again, cells cycled with LiPF6 and LiBF4 as electrolyte were added for comparison.

Figure 5. Voltage profile (top) and the corresponding differential capacity plot (bottom) of the 1st cycle at a C-rate of C/20 for NCM/graphite cells cycled with LiX (with X = (a) and (d) OCH2CF3, (b) and (e) OC(H)(CF3)2, (c) and (f) CO2CF3) and BF3·D (D = carbonate) in L57 as electrolyte at 25 °C. Cells cycled with LiPF6 and LiBF4 in L57 as electrolyte are added for comparison. The notation in (a) is valid for all plots.
Download figure:
Standard image High-resolution image
Figure 6. Voltage profile (top) and the corresponding differential capacity plot (bottom) of the 10th cycle at a C-rate of C/2 for full-cells cycled with LiX (with X = (a) and (d) OCH2CF3, (b) and (e) OC(H)(CF3)2, (c) and (f) CO2CF3) and BF3·D (D = carbonate) in L57 as electrolyte at 25 °C. Cells cycled with LiPF6 and LiBF4 in L57 as electrolyte are added for comparison. The notation in (a) is valid for all plots.
Download figure:
Standard image High-resolution imageThe voltage profiles and the corresponding differential capacity plots differ for each LiX, but the differences are minimal for the various adducts using the like LiX and with exception of Li[CO2CF3] and BF3·PC. For cells cycled with LiPF6 and LiBF4 as electrolyte, the capacities are significantly higher for the 1st and 10th cycle than for cells containing LiX and BF3·D. Cells cycled with Li[OC(H)(CF3)2]/BF3·D and Li[CO2CF3]/BF3·D display also the typical voltage profile of the NCM electrode with two anodic peaks at 3.5 V and 3.7 V in the first cycle, which are dedicated to the Ni redox pairs (Ni2+/Ni3+ and Ni3+/Ni4+).83 For cells cycled with LiBF4 or LiPF6 both peaks are pronounced in the first cycle. Apparently, this typical voltage profile is not observable for cells cycled with Li[OCH2CF3] and BF3D as electrolyte. The observable peaks display a significant decrease, which indicates a loss of active material. Furthermore, an irreversible oxidation peak between 3.3 V and 3.0 V was detected. We suggest that neutral BX3 might react on the negative electrode to a radical anionic species [BX3]·–, which could dimerize and form a surface layer that could be related to the capacity loss.
All cells cycled with LiX and BF3·D as electrolyte display small irreversible oxidation peaks in the differential capacity plot of the first cycle. For the composite electrolyte Li[OCH2CF3]/BF3·D and Li[OC(H)(CF3)2]/BF3·D these peaks are in the range of 2.2 V–2.6 V and 2.3 V–2.6 V. Furthermore, two irreversible oxidation peaks occur for Li[CO2CF3] and BF3D in the range of 1.6 V–1.9 V and 2.8 V–3.1 V. Recently, we reported small irreversible oxidation peaks in the first cycle in a similar range for cells cycled with BF3·D (with D = carbonate) as additive (1 wt%) with LiPF6 in L57 as electrolyte. We assumed that the formation of a partially boron based surface layer in the first cycle is assigned to these peaks. The XPS spectra of the electrodes of the cells cycled with BF3·D (with D = carbonate) as additive confirmed the incorporation of boron in the surface layers.52 To study, if this is also the case for the composite electrolyte systems, the cycled electrodes were investigated via XPS (see section below). For cells with LiBF4 or LiPF6 no oxidation peaks in this voltage area could be observed, which led to higher capacities in the first cycle.
Even if cells containing Li[OCH2CF3] and BF3·D as electrolyte display the most significant difference in the voltage profile of the first cycle, these cells show an increased initial discharge capacity compared to cells cycled with Li[CO2CF3] and BF3·D.
After the 10th cycle, the capacities of cells with the composite electrolytes are still lower than for cells with LiBF4 or LiPF6 (Fig. 6). The differential capacity plot of the 10th cycle of cells cycled with Li[OC(H)(CF3)2] and BF3D display the typical reversible voltage profile of the NCM electrode material, while for cells cycled with Li[OCH2CF3] and BF3·D only one peak at 3.7 V appeared. After the 10th cycle, the reversibility of the composite electrolyte Li[CO2CF3] with BF3D is no longer achieved.83 The loss of the reversibility leads to a rapidly decreasing specific discharge capacity, which suggests that the composite electrolyte of Li[CO2CF3] with BF3·D (with D = carbonate) is not suitable for NCM/graphite cells.
EIS measurement of LiX with BF3·DMC
EIS measurements were applied at a constant potential of 0 V after the 55th discharge cycle to compare the impedance induced by the electrolytes. The sum of the full-cell impedance includes contributions of the electrolyte and the electrodes (surface film and bulk material). The Nyquist plots for cells containing the electrolytes LiX/BF3·DMC, LiBF4 and LiPF6 are provided in Fig. 7.
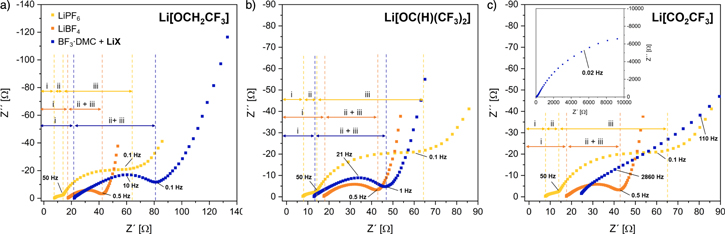
Figure 7. Nyquist plot of cells with LiX (with X = (a) OCH2CF3, (b) OC(H)(CF3)2, (c) CO2CF3) and BF3·DMC (blue), LiPF6 (yellow) and LiBF4 (orange) in L57 as electrolyte at 25 °C. EIS data were recorded after the 55th discharge cycle at a constant potential of 0 V with an amplitude of 10 mV in the range of 300 kHz–10 mHz. The notation in (a) is valid for all plots.
Download figure:
Standard image High-resolution imageFor cells containing LiX/BF3·DMC or LiBF4,84 only one semicircle could be observed, while for cells with LiPF6 as conductive salt two semicircles were found. According to the literature these semicircles are representing the interphase film impedance (region ii) and the charge transfer resistance (region iii).85–87 Reasons for observing only one semicircle can be similar capacitances of the surface film and the electrical layer88 or the presence of a constant phase element.87
The resistance of the lithium conduction of the liquid electrolyte (region i) is represented by the region of high frequencies and decreases in the order LiPF6 > Li[OC(H)(CF3)2]/BF3·DMC > LiBF4 > Li[OCH2CF3]/BF3·DMC > Li[CO2CF3]/BF3·DMC.89 The sum of the resistances of the interphase film and the charge transfer display an increase of the NCM/graphite cell impedance in the order of LiBF4 < Li[OC(H)(CF3)2]/BF3·DMC < LiPF6 < Li[OCH2CF3]/BF3·DMC ≪ Li[CO2CF3]/BF3·DMC. For cells including LiBF4 and Li[OC(H)(CF3)2]/BF3DMC as electrolyte a stroke line in the low-frequency region represents a low Warburg resistance corresponding to lithium ion diffusion in the active material compared to cells cycled with LiPF6 or Li[OCH2CF3]/BF3·DMC.90
The sum of the resistances is consistent with the capacity retention of the cells cycled with the composite electrolytes. The cells cycled with Li[OC(H)(CF3)2] and BF3·DMC as electrolyte display the lowest resistance and the highest discharge capacity. However, the substitution of a CF3 group of Li[OC(H)(CF3)2] through a hydrogen atom leads to higher impedance and inferior cycling performance. By contrast, cells cycled with Li[CO2CF3] and BF3·DMC as an electrolyte show an extremely high resistance and the lowest discharge capacity.
Surface characterization with XPS
The relative atomic concentrations of elements detected on the surface of both, fresh electrodes, NCM and graphite, and electrodes cycled with LiX and BF3·D as electrolyte are shown in Fig. 8. The fresh NCM electrode has almost the same relative atomic concentration distribution as the electrode cycled with Li[OC(H)(CF3)2] and BF3·EMC. The concentrations of boron on the surface of the electrodes cycled with LiX and BF3·D as electrolyte are increasing in the order of Li[OC(H)(CF3)2]/BF3·EMC < Li[OCH2CF3]/BF3·EMC < Li[CO2CF3]/BF3·PC. At the same time the concentrations of fluorine and carbon on the surfaces are decreasing in the order of Li[OC(H)(CF3)2]/BF3·EMC > Li[OCH2CF3]/BF3·EMC > Li[CO2CF3]/BF3·PC. The NCM electrode cycled in the presence of Li[CO2CF3] with BF3·PC, has a significantly higher oxygen concentration than the other electrodes.
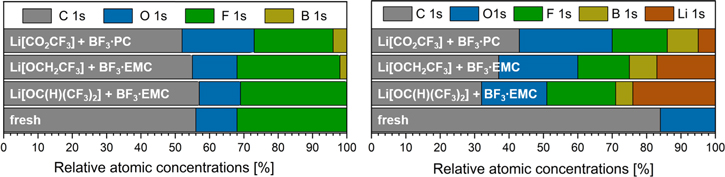
Figure 8. Relative atomic concentrations of selected elements detected on the surfaces of cycled NCM (left) and graphite (right) electrodes after the 55th cycle from XPS analysis. Relative atomic concentration of elements present at the fresh electrodes are added for comparison.
Download figure:
Standard image High-resolution imageSimilar results were observed for the concentrations on the surface of graphite electrodes cycled with LiX and BF3·D. The concentrations of boron, oxygen and carbon are increasing in the order of Li[OC(H)(CF3)2]/BF3·EMC < Li[OCH2CF3]/BF3·EMC < Li[CO2CF3]/BF3·PC, while the concentrations of lithium and fluorine are decreasing in the same order.
XPS spectra of the graphite electrodes
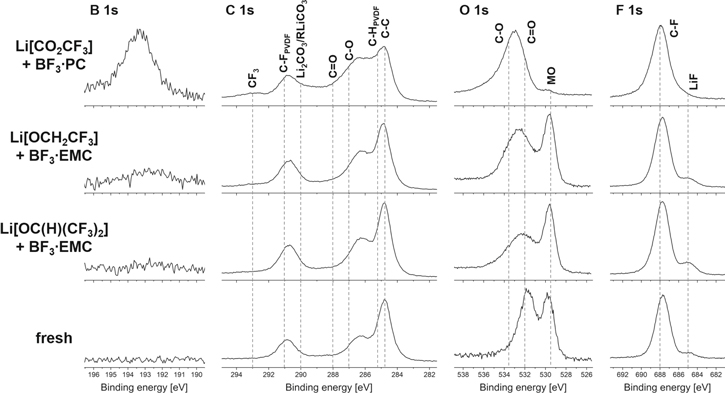
The Li 1s, B 1s, C 1s, O 1s and F 1s spectra of fresh graphite and graphite cycled with LiX and BF3·EMC or BF3·PC are displayed in Fig. 9. The C 1s spectrum of fresh graphite is dominated by C–O (287.0 eV), C–H (286.2 eV) and C–C (284.8 eV) species, which are related to conductive carbon and CMC/SBR binder.91 For the electrodes cycled with LiX and BF3·D, peaks at 290.0 eV could be observed, which are characteristic for Li2CO3 or lithium alkyl carbonates from the reduction.92 Furthermore, all electrodes cycled with LiX and BF3·D display an elevated content of C–O (287.0 eV) and C=O (288.0 eV) species. The weak peak of CF3 groups at 293.0 eV indicates the decomposition of LiX. The O 1s spectra of graphite electrodes cycled with LiX and BF3·D show a broad peak of oxygenated species in the 536 eV–530 eV binding energy range and confirm the presence of C–O (534.5 eV), C=O (532.0 eV) and M=O (530.5 eV) species on the surface. In the F 1s spectra, LiF (685.0 eV) and LiBF4 (687.5 eV) are present on every electrode cycled with LiX and BF3·D as electrolyte. An increased intensity of LiF was observed especially for Li[OCH2CF3] and BF3·EMC, while Li[OC(H)(CF3)2]/BF3·EMC and Li[CO2CF3]/BF3·PC have a higher content of C–F species (688.0 eV) concentration on the surface. This observation is consistent with the Li 1s spectra of LiX and BF3·D. In the B 1s spectra the intensity of B–F and B–O species is increasing on the graphite surface in the order of Li[OC(H)(CF2)3]/BF3·EMC < Li[OCH2CF3]/BF3·EMC < Li[CO2CF3]/BF3·PC.

Figure 9. Li 1s, B 1s, C 1s, O 1s and F 1s XPS spectra of fresh graphite and graphite electrodes cycled with LiX and BF3·EMC or BF3·PC as electrolyte.
Download figure:
Standard image High-resolution imageXPS spectra of the NCM electrodes
The B 1s, C 1s, O 1s and F 1s spectra of fresh NCM and NCM cycled with LiX and BF3·EMC or BF3·PC are provided in Fig. 10. The C 1s spectrum of the fresh electrode is dominated by peaks of CF2 (291.0 eV) and CH2 (286.2 eV) from PVDF and C–C (284.8 eV) from conductive carbon.93 These peaks were found in the C 1s spectra of all cycled NCM electrodes. The C 1s spectra of electrodes cycled with LiX and BF3·D as electrolyte, contain C–O (287.0 eV) and C=O (288.0 eV) species. The C 1s spectra of Li[CO2CF3] and BF3·PC display an increased intensity of C=O bonds and Li2CO3/RLiCO3 species (290.0 eV) than the surface of the electrodes cycled with the two other electrolytes. Furthermore, a weak peak of CF3 groups (293.0 eV) could be found on the surface of the NCM electrodes cycled with Li[CO2CF3] and BF3·PC as electrolyte, which indicates the decomposition of [CO2CF3]–.
Figure 10. B 1s, C 1s, O 1s and F 1s XPS spectra of fresh NCM and NCM electrodes cycled with LiX and BF3EMC or BF3·PC as electrolyte.
Download figure:
Standard image High-resolution image
The O 1s spectrum of the fresh positive electrode is dominated by the metal oxide peak at 529.5 eV and two peaks, which are related to Li2CO3 at 534.5 eV (C–O) and 532.0 eV (C=O).93 These species could also be observed on the surface of all cycled electrodes. The intensity of C–O and C=O species on the surface of the electrode cycled with Li[CO2CF3] and BF3·PC is significantly higher than for the electrodes containing the two other LiX with BF3·EMC. The presence of C–O and C=O bonds on the surfaces are increasing in the order of Li[OC(H)(CF3)2]/BF3EMC < Li[OCH2CF3]/BF3·EMC ≪ Li[CO2CF3]/BF3·PC and indicate the decomposition of LiX.
The F 1s spectrum of the fresh electrode contains C–F groups (688.0 eV) of PVDF. All cycled electrodes have also C–F groups on the surface, which are indicating again the decomposition of LiX. The presence of LiF (685.0 eV) on the surface is decreasing in the order of Li[OC(H)(CF2)3]/BF3·EMC > Li[OCH2CF3]/BF3·EMC > Li[CO2CF3]/BF3·PC. The B 1s spectra with Li[OCH2CF3]/BF3·EMC and Li[CO2CF3]/BF3·PC display a peak at 193.0 eV, which could be assigned to B–F and B–O bonds.88,93 The B 1s spectrum of the electrode from the cell with Li[OC(H)(CF2)3] and BF3·EMC as electrolyte showed no boron compounds on the surface of the NCM electrode.
The results of the XPS spectra of the surfaces of the NCM electrodes are consistent with the observations made during the cycling of LiX with BF3·D. The XPS spectra are suggesting a decrease of the CEI in the order of Li[CO2CF3]/BF3·PC > Li[OCH2CF3]/BF3·EMC > Li[OC(H)(CF3)2]/BF3·EMC, which is accompanied by a better cycling performance and lower impedance built up of the electrolytes. The incorporation of boron species in the surface layer of the electrodes was observed with different concentrations. According to the cycling performance the presence of boron species on the graphite electrode has no significant effect of the reversibility of the cells (cf. boron content on the surface of the graphite electrode of Li[OC(H)(CF3)2]/BF3·EMC). On the NCM electrode the incorporation of boron species seems to be dominant: the higher the concentration, the lower the reversibility and the capacity retention of the cells. In agreement with this, only the best performing electrolyte of this series, Li[OC(H)(CF3)2] with BF3·EMC, virtually shows no boron-uptake into its surface.
Conclusions
Upon the addition of BF3 adducts, the conductivity of LiX in L57 increased significantly according to Li[OCH2CF3] < Li[OC(H)(CF3)2] < Li[CO2CF3]. The highest conductivities exhibited the composite electrolytes formed from Li[CO2CF3] combined with BF3·D (with D = carbonate): rather favorable 5.17 mS·cm–1 to 5.78 mS·cm–1. 11B NMR studies of the composite electrolytes showed the presence of a series of anionic borates and for X = OCH2CF3 also the neutral BX3 species. The distribution of these species is different for each LiX and primary related to the lithium salt; its distribution is stable over months and appears to be mainly thermodynamically driven. The influence of the various BF3 carbonates of the product distribution or the conductivity is smaller, but noticeable with mixtures including the most polar donor EC consistently leading to the highest conductivities of each BF3·EC/LiX system. For Li[OCH2CF3] with BF3·D (with D = carbonate) the main component of the electrolyte is [BF4]– followed by the neutral B(OCH2CF3)3. The presence of the neutral compound apparently causes the low conductivity. The higher conductivity of Li[OC(H)(CF3)2] combined with BF3·D (with D = carbonate) is related to the main compound [BF3(OC(H)(CF3)2)]–, but also to [BF4]– and [BF2(OC(H)(CF3)2)2]–, which are also present with a lower percentage. For Li[CO2CF3] combined with BF3·D (with D = carbonate), [BF3(CO2CF3)]– is also the main product followed by [BF4]–. Here the increased electron withdrawing effect of the carboxylate in comparison to the alkoxides at the central atom enhance the weakly coordinating properties and leads to higher conductivity.
The cyclic voltammetry measurements suggested a stable potential range of 0.5 V to 4.5 V vs Li+/Li for LiX and BF3·DMC as composite electrolyte. The order of the conductivities was reversed in the electrochemical tests in NCM/graphite cells: Here the discharge capacities and the coulombic efficiencies increased in the order of Li[CO2CF3] ≪ Li[OCH2CF3] < Li[OC(H)(CF3)2] combined with BF3·D (with D = carbonate) as electrolytes. For all cells cycled with the composite electrolytes an irreversible oxidation in the first cycle could be observed in the range of 2.2 V–3.1 V, which is attributed to the SEI formation. An additional irreversible oxidation in the range of 1.5 V–1.7 V was detected for the combination of Li[CO2CF3] with BF3·D (with D = carbonate), which might also account for the inferior cycling behavior of this composite electrolyte. The cycling is accompanied by the impedance growth of all cells. The ex situ investigation of the NCM and graphite electrode with XPS after the 55th cycle showed an increased boron content for both electrodes in the order of Li[OC(H)(CF3)2] < Li[OCH2CF3] < Li[CO2CF3], while the lithium content on the surface of the graphite electrode decreases in the same order. Higher amounts of boron on the surface of the NCM electrodes seem to reduce the cycling performance in the tested systems.
Acknowledgments
This work was supported by the Albert-Ludwigs-Universität Freiburg, University of Rhode Island and the BASF SE. We would like to thank Dr. Harald Scherer and Fadime Bitgül for the measurement of the NMR spectra.