
Abstract
The heat generated during a single cell failure within a high energy battery system can force adjacent cells into thermal runaway, creating a cascading propagation effect through the entire system. This work examines the response of modules of stacked pouch cells after thermal runaway is induced in a single cell. The prevention of cascading propagation is explored on cells with reduced states of charge and stacks with metal plates between cells. Reduced states of charge and metal plates both reduce the energy stored relative to the heat capacity, and the results show how cascading propagation may be slowed and mitigated as this varies. These propagation limits are correlated with the stored energy density. Results show significant delays between thermal runaway in adjacent cells, which are analyzed to determine intercell contact resistances and to assess how much heat energy is transmitted to cells before they undergo thermal runaway. A propagating failure of even a small pack may stretch over several minutes including delays as each cell is heated to the point of thermal runaway. This delay is described with two new parameters in the form of gap-crossing and cell-crossing time to grade the propensity of propagation from cell to cell.

This is an open access article distributed under the terms of the Creative Commons Attribution Non-Commercial No Derivatives 4.0 License (CC BY-NC-ND, http://creativecommons.org/licenses/by-nc-nd/4.0/), which permits non-commercial reuse, distribution, and reproduction in any medium, provided the original work is not changed in any way and is properly cited. For permission for commercial reuse, please email: oa@electrochem.org.
The design of reliable battery packs of high energy densities presents a challenge with regard to preventing a single-cell thermal runaway from propagating to neighboring cells. Random single cell failures, while rare, are difficult to prevent. While single-cell safety devices can be effective in many cases, most are designed with low voltage consumer electronics in mind and may be inadequate in high energy battery packs.1
The thermal runaway behavior of single lithium-ion cells is well studied.2–12 Typical responses include venting of battery gasses, ejection of cell contents, extreme temperatures, and in some cases, self-ignition. What is less well known is how these behaviors may impact a larger, more complex system. The failure of a single cell taken on its own may have little impact on the safety or performance of a high energy system. However, the thermal and electrical impact on other cells in the system may be sufficient to cause a cascading propagation effect. Without mitigation this can quickly continue until the entire battery pack has been consumed.13–17 This worst-case scenario would result in a catastrophic release of energy within the confines of the system, causing significant damage and presenting a potentially dangerous situation for operators. When a system-level failure is an unacceptable consequence, the primary solution is ultimately designing the system to be robust to cascading propagation.
Propagation resistant designs use a combination of cell selection, spacing of cells, and interstitial material to build passive propagation resistance into the pack.18–27 NASA's manned spaceflight programs have been at the forefront of the design of high energy density, high reliability packs.28 Darcy et al. have presented a design using LG MJ1 cells in an aluminum heat sink array, which provides both separation of the cells and an additional path for the heat to flow in case of failure.29 These strategies typically focus on cylindrical form factors that have reduced contact area between cells, which minimize heat transfer from cell to cell within a battery pack. Cylindrical cells also have the advantage of built-in safety devices that are effective at preventing some forms of failure, such as unintended overcharge and self-heating.1 However, the geometric inefficiency of cylindrical cells limits the volumetric energy density, as significant space is lost in the pack design. The use of the polymeric pouch material allows for lower mass and volume compared to the metal can cells thus offering much higher energy density (Wh/L) and even higher specific energy (Wh/kg), particularly at the system level. Nevertheless, these are significantly more challenging to implement in a system that takes propagation resistance into account since a strong heat transfer between pouch cells has been demonstrated, independent of electrical configurations.30
Since pouch cells offer volumetric efficiency advantages, in this work we further investigate this form factor to assess the effects thermal configuration has on cell-to-cell cascading propagation. The thermal configuration changes studied are related to differences in the ratio of the stored electrical energy to the overall thermal mass of the system, expressed in terms of the mass of components and their specific heat. Reductions in the state-of-charge (SOC) and the addition of material beyond the cell itself are both changes to the thermal configuration. Module-level packaging and electrical interconnects both represent additional material that provides heat capacity.
This manuscript presents experimental data and analysis to better understand how thermal runaway propagates through packs comprised of polymer pouch cells and potential mitigation strategies. Any mitigation strategy will ultimately have to take system-level cost and performance into consideration as well as changes in electrochemistry or cell design. This work intends to build a foundation of knowledge that can be used to design high energy density systems that are resilient to single-cell failure, particularly when using a given high energy density pouch cell design. We consider the contribution of thermally conductive interstitial materials, as well as the role of overall heat capacity and heat rejection in the progression of thermal runaway.
Experimental
Failure propagation in multi-cell battery packs was investigated using commercially available LiCoO2/Graphite cells. The tests were performed with 3 Ah (203 Wh/kg) AA Portable Power Corp. cells, model #7035130, obtained from www.batteryspace.com. The cells were pouch format with a nominal operating voltage of 3.7 V and a charge-discharge range of 2.75 V to 4.2 V.
Battery packs were constructed following the schematic shown in Fig. 1, in which five cells not electrically connected were closely stacked and constrained with an aluminum holder to contain swelling of cells during failure and maintain contact between cells. Cement-boards were located at the interface between the outer cells/ holder and at the bottom of the pack to thermally insulate the stack and minimize heat dissipation into the holder as seen in Fig. 1. The dimensions of the cement-board and the cells are listed in Table I.
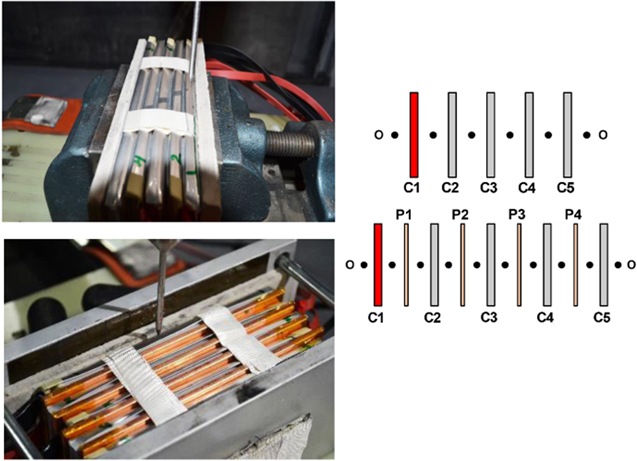
Figure 1. General schematic of five-cell pack construction with and without copper plates (left), thermocouple locations without plates (top right), and thermocouple locations with plates (bottom right). Cells are labeled with "C" and metallic plates are labeled with "P". Nail penetration occurs at cell 1 (highlighted in red).
Download figure:
Standard image High-resolution imageTable I. Dimensions of cells, cement-boards, and plates.
| Length (mm) | Width (mm) | Thickness (mm) | |
|---|---|---|---|
| Pouch cell | 130 | 36 | 7.4 |
| Cement-board (sides) | 187 | 48 | 6.4 |
| Cement-board (bottom) | 84 | 48 | 6.4 |
| Aluminum or Copper plates − 0.8 mm | 135 | 38 | 0.8 |
| Aluminum or Copper plates − 1.6 mm | 135 | 38 | 1.6 |
| Aluminum or Copper plates − 3.2 mm | 135 | 38 | 3.2 |
Single-cell failure was initiated by penetrating cell 1 with a sharp, 3 mm diameter steel nail moving at 10 mm s−1. Cell temperatures were monitored using thermocouples attached to the surface of each cell, generally sandwiched between two cells or between the cells and the conductive barrier as shown in the thermocouple maps in Fig. 1. Tests were terminated if all cells were consumed or ambient conditions were reached with no sign of further thermal runaway.
The extent of propagation was monitored at various nominal states of charge (50%, 75%, 80%, and 100% SOC). State of charge setting was performed by first fully charging each cell within the pack and then removing amp hours of charge to reach the desired nominal state of charge.
Copper and aluminum plates were evaluated as passive thermal management barriers between cells. These materials were chosen to provide a more mechanistic study to explore the impact on cell to cell propagation variations. Packs were constructed in a similar fashion to the tests above; however, aluminum or copper plates cut to similar length and width as the body of the batteries tested were placed in between each cell. This was done with thicknesses of 0.8 mm, 1.6 mm, and 3.2 mm. The detailed dimensions are listed in Table I.
Results
Baseline propagation and analysis approach
Propagation through pouch cell stacks is first investigated with a group of cells at 100% SOC without the inclusion of metallic plates to establish a baseline for the heat transfer between cells and to identify an analysis approach for other configurations. Thermocouple measurements between each cell or between outer cells and cement-boards are shown in Fig. 2 along with cell voltages. The results show a rapid propagation of thermal runaway after the initial nail penetration with the entire five cell string consumed within ∼90 s. The thermocouple-measured peak temperatures, when averaged across the thermocouples located between the cells (2–4), is 650 °C. Temperatures measured at the edges of cell 1 and cell 5 are lower than the temperatures across the remainder of the stack, indicating heat losses through the cement board are not negligible. The severity of failure is in line with what has previously been observed in propagation tests.13–17

Figure 2. Failure propagation of a five-cell stack at 100% SOC without thermal management.
Download figure:
Standard image High-resolution imageThe baseline propagation shown in Fig. 2 is used to develop an analysis approach across various thermal configurations. To simplify the discussion, we will orient the analysis so that the initial nail penetration is on the left side and the thermal runaway evolves from left to right. Thermocouples measure heating from the failed cell and then, if thermal runaway propagates, heating from the right is observed when the next cell undergoes thermal runaway. For example, the thermocouple between cells 1 and 2 (C1-C2) in Fig. 2 shows rapid heating at ∼10 s coming from the nail-induced short circuit in cell 1 followed by rapid heating after 20 s coming from thermal runaway initiating in cell 2.
Time derivatives of thermocouple signals are shown in Fig. 3. Thermocouples that are on the edge of the stack (between a cell and the insulator) exhibit a single peak when thermal runaway reaches the edge of these cells. Thermocouples between two cells exhibit two significant peaks if runaway propagates and a single peak if propagation fails at that point. Figure 3 shows clear separation between these various peaks, and to better understand the propagation we extract "cell-crossing times" by measuring the time between the thermocouple peak on the left and right side of the cell. The cell-crossing time is a measure of the rate of propagation across the cell.

Figure 3. Thermocouple time derivatives are shown for measurements of the five-cell stack baseline configuration (100% SOC) in Fig. 2. The terms "gap-crossing time" and "cell-crossing time" are based on the peak separation as shown.
Download figure:
Standard image High-resolution imageWe also extract "gap-crossing times" by measuring the time between two peaks observed by the same thermocouple. The gap-crossing time shows the delay between heat released by the left cell propagation ending and the start of heat release as the next cell initiates thermal runaway. It is evident in Fig. 3 that gap-crossing times are not trivial relative to the overall evolution of the propagation. For this condition we find that the cell-crossing times and gap-crossing times are of the same magnitude, in the range of ten to fifteen seconds. This will be discussed further after propagation results for other thermal configurations are presented.
Propagation with varying SOC
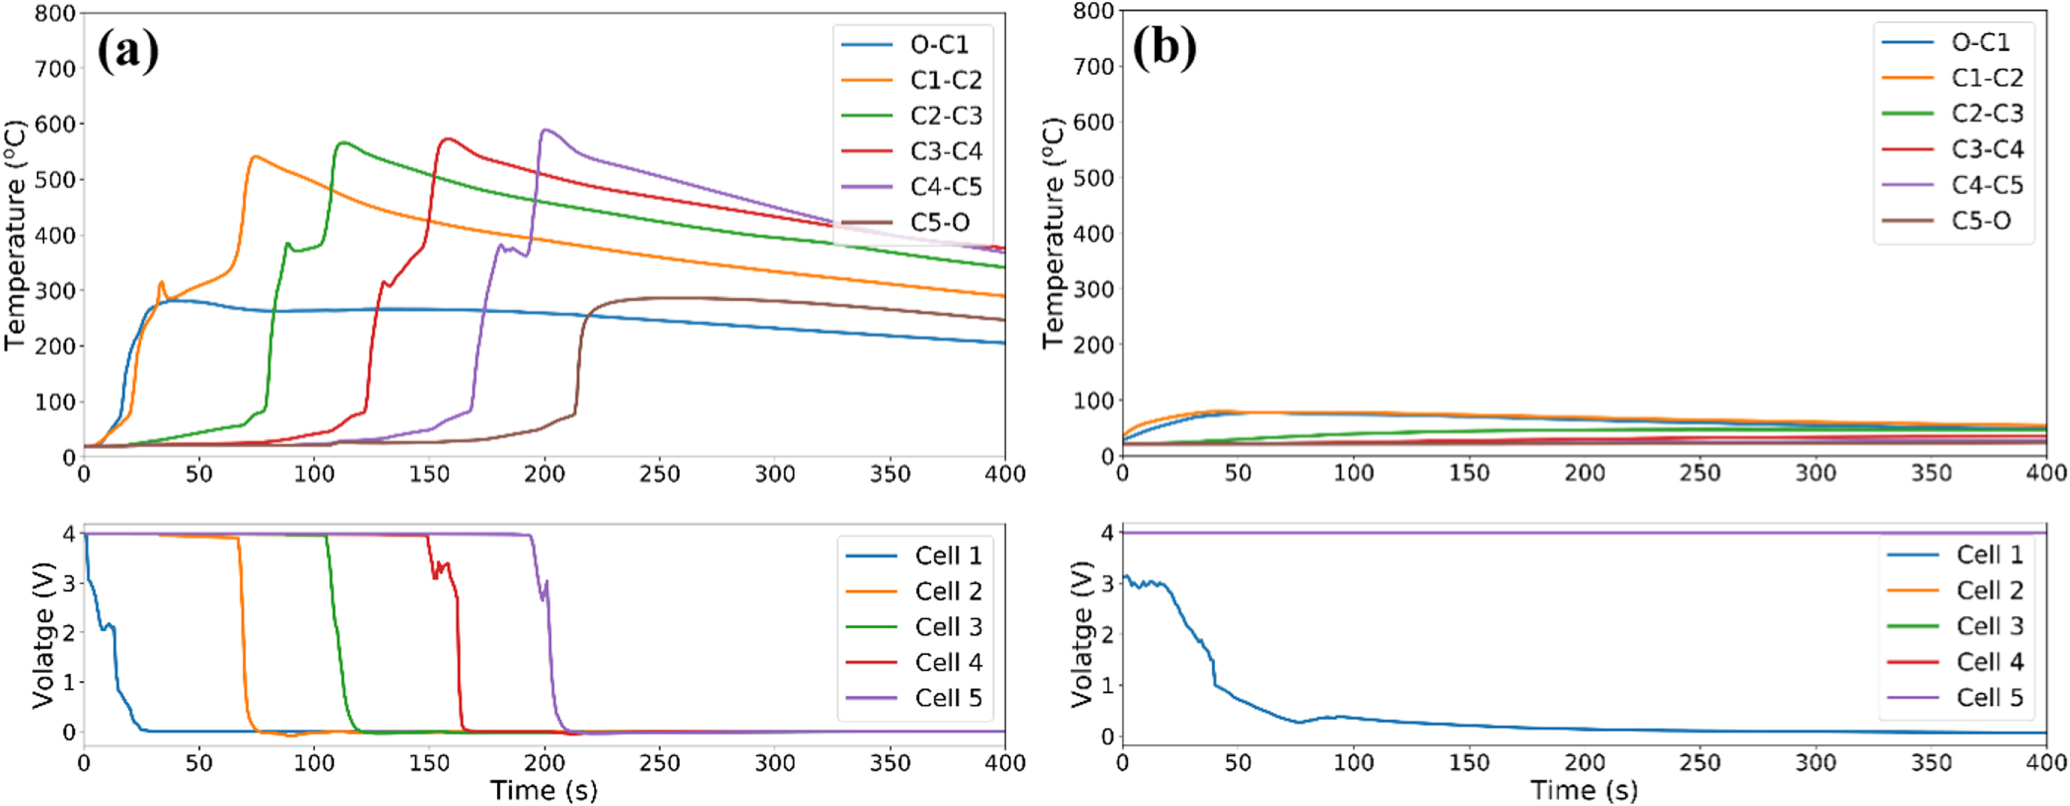
It is conventional wisdom that cells with reduced SOC present less thermal hazard.6,31–34 The active materials are reactive in their charged state, but the discharged state is thermodynamically stable; partially discharging cells reduces the potential energy release. In Figs. 4 and 5 we identify the limits of propagation as a function of SOC for the current cells and configuration.
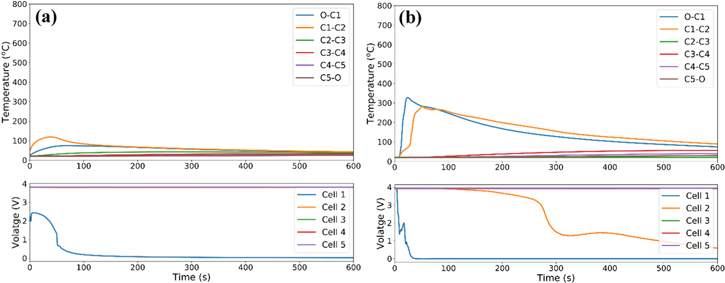
Figure 4. Thermal runaway propagation at (a) 50% SOC, and (b) 75% SOC.
Download figure:
Standard image High-resolution image
Figure 5. Thermal runaway propagation at (a) 80% SOC, and (b) no propagation at 80% SOC.
Download figure:
Standard image High-resolution imageFigure 4 shows the voltage and temperature response with SOCs of 50% and 75%. At 50% only minimal cell heating and no further propagation of the failure is observed. It is likely the short-circuited cell was heated more strongly at the nail location, but the transfer of that heat to the thermocouples occurs with some heat dissipation. At this low SOC, the short-circuit heat release and cell reactivity are not sufficient to trigger a substantial thermal runaway and are well away from triggering thermal runaway in neighboring cells. This may vary with resistance of the short circuit, and the result might change in very well-insulated conditions (for example, if cells were buried deep within a high-energy battery system) but from this testing the risk of cascading propagation from single-cell thermal runaway at 50% SOC appears low.
Figure 4 (right) shows the response at 75% SOC, with the short-circuited cell reaching ∼327 °C. This was sufficient to cause cell failure in the second cell of the stack as represented by voltage loss. However, the thermocouple between cells 1 and 2 only reached ∼283 °C and the cascading propagation halted at the second cell.
Figure 5 shows cascading propagation at 80% SOC. For the 80% SOC case, four replicates were carried out. For two cases propagation occurred as shown on the left of Fig. 5, but for two cases propagation failed to occur (right of Fig. 5). With two of four repeated tests giving propagation, this 80% SOC can be considered as the separation between propagation and failure to propagate. The peak temperatures in the propagating cases were observed to be somewhat lower than those at 100% SOC, with maximum temperatures for each internal thermocouple averaging to ∼560 °C. The cell-crossing and gap-crossing times are also extracted from these profiles as described in the previous subsection. Relative to 100% SOC, the 80% SOC measurements show increased cell-crossing times, roughly doubled relative to those at 100% SOC. The gap-crossing times have also increased, but not as significantly. The overall duration of the propagation for 80% SOC is about twice that observed in Fig. 2 for 100% SOC. Detailed cell and gap-crossing times are compiled and analyzed in the discussion section.
Thermal mitigation with conductive metallic plates
Figure 6 through Fig. 10 show the impact of passive thermal management with either copper or aluminum plates between cells. Here we consider the impact of adding simple metallic plates in between cells as a means of mitigating heat transfer between cells during a thermal runaway event by adding thermal capacitance. For these tests, five-cell strings at 100% SOC were constructed using pouch-type cells with varying thicknesses of either aluminum or copper plates between each cell. Metal plates have significant heat capacity and absorb some of the released energy. Heat conduction across thin metal plates is fairly rapid but there might also be some increased contact resistance. The system heat capacity and the parasitic mass of the battery packs are listed in Table II to provide a comparison of the tradeoff between additional mass and reducing the risk of thermal propagation. The parasitic mass of large battery systems is often linked to structural support, and it could be beneficial as it provides opportunities to take advantage of heat capacity. Figures 6 and 7 show the results using 1.6 mm Al and Cu plates. At this thickness, only limited propagation to the nearest neighbor is observed. After the initial cell failure, the second cell in the string failed with a modest temperature rise and voltage loss. However, the kinetics of this failure are muted, and no further propagation is observed beyond the second cell. Thicker plates were shown to completely mitigate the propagation.
Table II. System heat capacity and parasitic mass of the battery packs with metallic barriers.
| Name | System Heat Capacity (J/kg total/K) | Parasitic Mass (kg total/kg cells) |
|---|---|---|
| 0.8 mm Aluminum | 792 | 1.13 |
| 1.6 mm Aluminum | 803 | 1.26 |
| 3.2 mm Aluminum | 820 | 1.51 |
| 0.8 mm Copper | 661 | 1.42 |
| 1.6 mm Copper | 598 | 1.84 |
| 3.2 mm Copper | 531 | 2.69 |

Figure 6. Partial propagation with the addition of 1.6 mm Al plates passive mitigation (100% SOC). *Thermocouple C1-O was compromised by the initial thermal runaway.
Download figure:
Standard image High-resolution image
Figure 7. Partial propagation with the addition of 1.6 mm Cu plates passive mitigation (100% SOC).
Download figure:
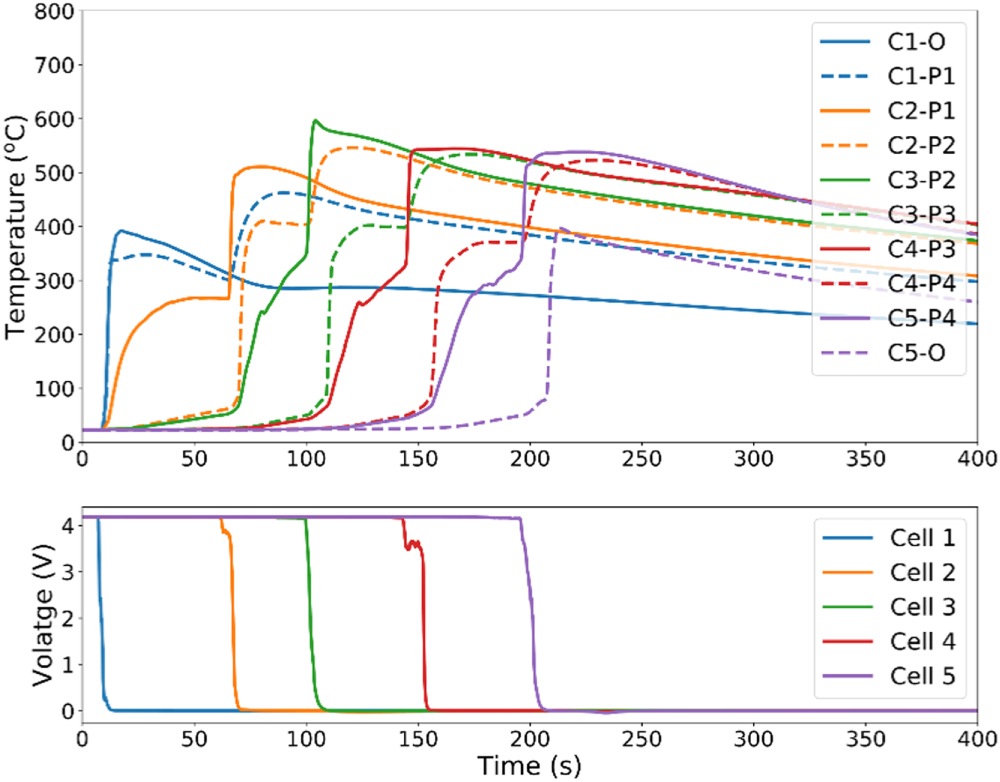
Standard image High-resolution imageFigures 8 and 9 show the results of fully charged multi-cell packs using 0.8 mm thick aluminum and copper plates, respectively. In both cases complete propagation of thermal runaway was observed. Similar to the testing at 80% SOC, a significant extension of the time for the propagation to occur was observed when compared to the pack at 100% without plates. While the 80% SOC string peaked at ∼560 °C, the string with Al plates peaked at 620 °C, and the string with copper plates peaked at ∼600 °C. In both cases, the final cell failure was observed ∼200 s after the initial cell failure. This is about twice the time required for the unmitigated 100% SOC cell stack to propagate across five cells in Fig. 2. The increased propagation time is fully attributed to the gap-crossing times that are affected by the added copper and aluminum plates. Detailed crossing times are provided and discussed further in the next section.

Figure 8. Full propagation with the addition of 0.8 mm Al passive mitigation (100% SOC). Note that a failure in the thermocouple between cell 3 and plate 3 resulted in no measured temperature changes.
Download figure:
Standard image High-resolution image
Figure 9. Full propagation with the addition of 0.8 mm Cu plates passive mitigation.
Download figure:
Standard image High-resolution imageDiscussion
The analysis of the speed of the thermal runaway front as it propagates through a stack of cells is critical to informing battery module design. Here we examine the effects of the passive mitigation strategies and SOC on propagation front timing and maximum temperature measured by the TCs. Much of this discussion treats the stack of cells as a 1-D system.
For thermal runaway to propagate from cell-to-cell, the temperature that the "next cell" in the stack reaches is a critical factor. Separator failures can begin to occur around 130°C, but most systems employ polypropylene that maintains structural integrity up to 165 °C.35–39 Thermal reactions also occur in this temperature range, with slow reactions beginning below 150 °C and faster reactions at higher temperatures. Thermocouple measurements suggest heat release becomes significant above 200 °C for the cells here, but this is associated with cell-crossing times on the order of ten seconds. Oven tests where thermal runaway occurs just above 155 °C occur over tens of minutes.40 Measurements here do not define a specific thermal runaway temperature, which should depend on the heating and cooling time scales, but 200 °C will be taken as a characteristic runaway temperature.
As cells release heat in thermal runaway reactions, the heat initially goes into the location where the heat release occurs, raising the temperature according to the heat capacity. It then can spread either along the stack or be lost to the surrounding ambient or surrounding structural materials. The relative transfer of energy along the stack compared to that lost to the surroundings or used for local heating determines whether or not the critical thermal runaway temperatures noted above are reached and whether propagation continues. Heat transfer along the stack has characteristic time scales around one to ten seconds, placing this in a different time scale regime compared to oven tests where heat loss time scales are one to ten minutes. When thermal runaway propagates along the stack in a cascading manner, the rate at which that propagation occurs provides guidance about the relative rates of heat distribution. The transition from cascading propagation to no propagation over a range of thermal configurations provides guidance on the boundary between these limiting states.
Propagation speed
For the first cell, nail penetration leads to heat release and reactions focused around the nail. For the remaining cells, thermal runaway is expected and observed to evolve as a propagation front from the first-heated side of the cell. This can be seen as rapid rises in temperature, signaling the presence of the reaction front. Following the crossing-time analysis previously outlined around Fig. 3, the cell-crossing times for the interior cells (2–4) are summarized in Fig. 10 for all conditions where propagation through the stack was unmitigated. The following trends are present in the data:
- As the propagation front moves away from the initiating cell, the cell-crossing time increases (i.e. the propagation velocity slows down).
- An increase in SOC (which is related to the heat release) leads to a faster cell-crossing time, which is expected as more energy is available to drive propagation. Cell-crossing occurs in 10 to 12 s for 100% SOC compared to 12 to 18 s for 80% SOC.
- The addition of plates significantly decreases the cell-crossing time despite the fact that the plates will absorb some of the thermal energy released. With metal plates between cells, the cell-crossing times are generally faster than 10 s indicating that there are aspects of the nearly mitigated case that can be more severe than unmitigated cell stacks. However, the metal plates were not directly thermally linked to the battery structure; results may change if they were, for example, intimately linked to the cell collector plates with a more direct internal heat dissipation path.

Figure 10. Cell-crossing times through the internal cells for cases where full propagation occurred. Lines are added between measured points to aid identification of trends.
Download figure:
Standard image High-resolution imageTo better understand propagation of thermal runaway in the cell stack, we look to the gap-crossing times presented in Fig. 11. Gap-crossing times are determined as shown in Fig. 3. As noted there, gap-crossing times for a 100% SOC stack with no metal plates are around ten seconds. When propagation at 80% SOC occurs, the gap-crossing times increase significantly, mostly between 20 and 30 s but nearly 50 s in one case. When plates are added, the gap-crossing time increases, typically to more than 30 s. This added delay in gap-crossing occurs because some heat is absorbed by the metal plate, but this also allows for more even preheating of the next cell in the stack as discussed below.

Figure 11. Gap-crossing times for cases where full propagation occurred. Lines are added between measured points to aid identification of trends.
Download figure:
Standard image High-resolution imageFor the marginal cases (i.e. 80% SOC and 0.8 mm metal plates), gap-crossing times increase because a greater fraction of the heat generated in the previous cell must be transferred to start thermal runaway in the next cell. However, when the gap-crossing times increase, more heat spreads into the next cell while raising its peak temperature towards the critical temperature where thermal runaway begins (also see the later section on Cell heating during gap-crossing). When runaway begins, more thermal energy is present in the cell to drive propagation than the unmitigated 100% SOC case. More energy is associated with faster heat release (Arrhenius reaction rates), thus increasing the velocity of the reaction front.
For the marginal propagation cases, the longer gap-crossing times are more important overall in determining global heat release rates even though the instantaneous heat release rates (energy released per cell-crossing time) are greater during faster cell-crossing in metal-plate mitigated cases. This is observed in the approximate doubling of the time to propagate across the stack of five cells: for the unmitigated 100% SOC case propagation was completed in approximately 90 s (Fig. 2) while propagation across the lower SOC and 0.8 mm metal plate cases took roughly 200 s (Figs. 5, 8, and 9). If we estimate the heat released using the nominal stored energy in each cell, 45 kJ per cell, then the range of heat release rates averaged over the five-cell stack is approximately 2.2 kW at 100% SOC and closer to 1 kW for the 80% SOC and plate-mitigated cases. This estimate is on the low side because additional heat can be released in thermal runaway due to electrolyte venting combustion and burning of other materials like plastic packaging and structural materials, but it provides important order-of-magnitude estimates of cell-to-cell propagation heat-release rates.
Thermal contact resistance estimation
In Fig. 3 it was noted that the time between the end of propagation in one cell and the start of propagation of the next cell was significant. Thermal contact resistance between cells can affect the gap-crossing times, and here thermal contact resistance is estimated through a simple analytical heat transfer analysis and a finite volume model taking advantage of the measured gap-crossing times.
The interface between a cell finishing thermal runaway and an adjacent (uncompromised) cell can be analyzed as a semi-infinite solid in the direction of the adjacent cell with a Robin boundary condition representing heat transfer from the cell in runaway to the surface of the adjacent cell through some contact resistance. The analytical solution for the surface temperature (Ts) of the adjacent cell is41

where Ti is the initial temperature of the uncompromised cell, is the temperature of the cell finishing thermal runaway, and time evolves according to as


The thermal contact resistance is contained in the expression for along with the thermal diffusivity (α) and thermal conductivity () of the battery as well as the time (t) from the end of thermal runaway in the initiating cell.


The addition of plates between cells adds a layer of complexity to the contact resistance analysis. We simplify the metal plate (subscript m) as thermally lumped with a finite volume approximation so the plate temperature is approximated using
where the metal plate density, specific heat, and thickness are given by and respectively. The initial condition is at time zero. The temperature in the uncompromised cell of thickness evolves according to a finite-element discretization of


with boundary conditions

where we seek the value of as a function of time. The density and thermal properties of the cells and metal plates are compiled in Table III. The density and specific heat of the cells was estimated from a tear-down of the cells while the thermal conductivity was approximated as a portion of this work and is similar to values given by Ahmed et al.42 The thermal properties of the metal plates are taken from Incropera et al.41 As the metal plates are approximated with a thermally lumped model, the thermal conductivities of these materials are not required for the model.

Table III. Thermal properties and densities of the cell, aluminum, and copper used in the contact resistance models.
| k (W/m/K) | (J/kg/K) | ρ (kg m−3) | Source | |
|---|---|---|---|---|
| Cell | 0.5 | 778 | 1816 | Current work |
| Aluminum | 237 | 903 | 2707 | Incropera et al.41 |
| Copper | 401 | 395 | 8933 | Incropera et al.41 |

We solve both systems (with and without plates) for the contact resistance using experimentally measured values for the driving temperature () and the gap-crossing time (calculated using the method depicted in Fig. 3). Equations (1) and (2) are used for the system without plates, and Eqs. (3)–(6) are used for the system with plates. The driving temperature can be taken as the maximum temperature (Tmax) measured at each thermocouple. We must also specify the target surface temperature (Ts) at the onset of thermal runaway in the uncompromised cell. While oven tests suggest initiation of thermal runaway occurs just above 155 °C,40 for this analysis we take the higher value of Ts = 200 C based on the shorter time scales and thermocouple measurements (see first paragraphs of this Discussion section). As we are relying on the time to onset of thermal runaway to estimate the contact resistance, this analysis is limited to cases where full propagation occurs.

We solve the inverse problem for the contact resistance that results in Ts = 200 °C at the gap-crossing time for each pair of cells (except for cell 1) in the 100% SOC cases that fully propagated, including those with 0.8 mm aluminum and copper plates. The resulting contact resistances are plotted against Tmax in Fig. 12 along with the thermal resistance of 0.2 mm of Mylar (which approximates the resistance of the pouch cell container material and serves as a lower bound for the contact resistance).

Figure 12. Thermal contact resistance vs driving temperature Tmax calculated with the analytical solution for the gap between cells and the numerical solution for the cell to plate resistance.
Download figure:
Standard image High-resolution imageThe analytical solution and numerical plate solution effectively estimate the thermal contact resistance for the maximum temperature difference between a cell in thermal runaway and a cell that is being heated. The average values for the cell-to-cell and cell-to-plate contact resistance are 12.3e-3 m2 K W−1 and 4.8e-3 m2 K W−1 respectively, but there are two cell-to-plate contacts between each cell with metal plates. The equivalent resistance for cell-to-plate-to-cell of 9.6e-3 m2 K W−1 (two times cell-to-plate) is on the same order as the cell-to-cell contact resistance. We note that these contact resistances are much greater than the equivalent thermal resistance of the plates themselves which are smaller than 1e-5 m2 K W−1. Using as the constant temperature, T1, provides an upper bound on the thermal contact resistance, as in the real system, the cell that has completed thermal runaway will be losing heat to the surroundings and adjacent cells/plates. Using a lower value for Ts would tend to reduce the estimated contact resistance. An improved estimate for the thermal contact resistance could be determined by simulating cooling of the failed cell while the adjacent cell heats up and undergoes thermal runaway, but this is beyond the scope of the current work.


Cell heating during gap-crossing
The gap-crossing refers to processes occurring after one cell completes thermal runaway but before the next cell in the stack indicates strong thermal runaway. While the runaway cell is heating the next cell during the gap-crossing, this heat spreads into the next cell, preheating it. Using the models from the previous section, we can estimate the total energy transferred to the next cell (and plate if present) during the gap time. This is accomplished by integrating the heat flux into the cell during the gap-crossing time using the simplified models developed in the previous subsection. These models constitute a simple 1-D approach, neglecting external heat losses.
For the 100% SOC case, the average energy absorbed by the next cell during the gap-crossing time was 2.0 kJ. The heating will be concentrated on the left side of cells exposed to a cell runaway on the left side, but over a ten second crossing time the heat spreads a few millimeters into the cell. When the 0.8 mm plates were added, the average energy increased to 2.6 kJ and 2.5 kJ for the aluminum and copper plates, respectively. The addition of the plates decreases the heat flux to the next cell resulting in a longer gap-crossing time required to reach the ignition temperature. However, when the gap-crossing time increases, heat spreads further into the cells and more heat is added before thermal runaway can be initiated at 200 °C. During the gap-crossing the 0.8 mm aluminum and copper plates are estimated to absorb 3.2 kJ and 4.1 kJ, respectively. Thus, the heating of the metal plates is significant relative to the heating of the adjacent cells. The gap-crossing time is further lengthened because the amount of heat that must be transferred from the hot cell to start thermal runaway in the next cell is roughly tripled in the case with metal plates (∼2.5 kJ + 3.2 kJ = 5.7 kJ compared to 2 kJ without plates). The accelerated cell-crossing times observed for propagating cells with metal plates is attributed to the modest added heat (2.5 kJ vs 2 kJ). It is noteworthy that such modest thermal preheating significantly affects the cell-crossing time, but this is typical of Arrhenius rate processes.43
Factors affecting mitigation
Thermal runaway was mitigated in two ways in these experiments: reducing the state of charge and increasing the total heat capacity of the system. For an adiabatic system with constant heat capacity () and stored energy (Q), the potential temperature rise () can be estimated as the energy released per heat capacity


where m is the mass of the system. In a real system, heat is lost to the surroundings though convection, conduction, and venting of electrolyte and product gases. Additional heat can be released due to electrolyte combustion and burning of plastics. We estimate the above potential temperature rise in the cells using the energy stored in the cells (45 kJ per cell at full SOC) and total heat capacity of the cells and plates (if present). A summary of the experiments along with ΔT and propagation status is displayed in Table IV. When the experiments are sorted by this stored energy per heat capacity, two transitions in the propagation behavior are apparent: from the 80% SOC to the 1.6 mm Aluminum plates case where propagation is limited to the second cell and from the 1.6 mm Copper plates case to the 3.2 mm Aluminum plates case (at 75% SOC) where thermal runaway is mitigated. The failure of the second cell can be seen in Figs. 4, 6, and 7 as a loss of voltage accompanied by a small heat release that is proportional to the rate at which the voltage drops. We suggest this limiting is specific to the cell type and configuration, but the general alignment of cascading propagation vs mitigation should be well correlated with this potential temperature rise,


Table IV. Propagation status of each case sorted by potential temperature rise (stored energy in the stack scaled by the total heat capacity).
| Name | (°C) | Propagation |
|---|---|---|
| 100% SOC | 828 | Full |
| 0.8 mm Aluminum | 721 | Full |
| 0.8 mm Copper | 685 | Full |
| 80% SOC | 663 | Full/None |
| 1.6 mm Aluminum | 639 | Second Cell |
| 75% SOC | 621 | Second Cell |
| 1.6 mm Copper | 584 | Second Cell |
| 3.2 mm Aluminum | 520 | None |
| 3.2 mm Copper | 451 | None |
| 50% SOC | 414 | None |

Conclusions
Understanding the mechanisms of cascading propagation in high energy density battery systems and identifying mitigation strategies is critical for the widespread adoption of this technology. Therefore, this work examined the cascading propagation behavior of multi-cell battery packs for which available energy was reduced (by varying SOC). Reducing the available energy within the pack is effective in preventing or partially reducing cascading propagation, particularly at 50% and 75% SOC. The main mechanism behind this strategy is that the heat release of the failed cell is not sufficient to cause heat transfer across the entire pack, even though the cells are in thermal contact over their largest surface. When the SOC is increased to 80%, propagation and failure to propagate are both identified, with two cases in which full propagation was observed and two cases with no propagation.
The impact of heat-absorbing metal plates between cells on cascading propagation was also analyzed to determine its effectiveness as a mitigation strategy. The plates provided an additional thermal mass to dissipate heat release, hence reducing the risk of propagation. Aluminum or copper plates with thicknesses of 0.8 mm, 1.6 mm, and 3.2 mm were placed between each cell, and the propagation behavior was evaluated. Thicker plates completely mitigated propagation, while partial propagation was achieved for the pack with 1.6 mm plates. For 0.8 mm plates, full propagation was observed for both aluminum and copper plates at 100% SOC, but the propagation time through the entire pack was significantly longer (approximately double) compared to the unmitigated test. While these thinner plates did not prevent cascading propagation, they did significantly reduce the estimated overall heat release rate and slow propagation across the stack, potentially providing additional time to dissipate energy. The results suggest propagation is well correlated with the ratio of the stored energy to the heat capacity, referred to here as the potential temperature rise.
The timing associated with propagation of thermal runaway through the cells was extracted in the form of a gap-crossing time between cells and a cell-crossing time. The interplay between decreasing the state of charge and adding mass between the cells and their effect on propagation speed was examined. It was found that while adding metal plates delays the onset of adjacent cells, when propagation is not prevented the delay time results in more heat distributed through the cell leading to faster propagation through the cell after ignition. It is found that there is a significant delay between propagation across one cell and the initiation of thermal runaway and propagation in the next adjacent cell. This delay was used to estimate the contact resistance between cells and between cells and plates, which is critical to understanding the heat transfer though the pack. The cell-to-cell contact resistance was determined to be approximately 12e-3 m2 K W−1 while that for the cell-to-metal-to-cell was approximately 10e-3 m2 K W−1.
While adding thermally conductive plates has been shown to be effective in small packs, it would constitute a significant increase in weight, cost and volume if applied to a pack of hundreds of cells. Mitigation strategies building on this may use more sparsely interspersed plates to create propagation break points within a pack or use thinner plates that provide a heat dissipation path to the battery structure. However, it is difficult to explore every conceivable configuration and pack design experimentally, so a deeper understanding of the heat transfer and failure mechanisms that influence propagation are required. Well-validated models and targeted testing present the most reasonable path for better understanding these mitigation strategies.
Acknowledgments
This work was supported by the US Department of Energy Office of Electricity, Energy Storage Program. The authors wish to thank Dr. Imre Gyuk for his support of research advancing safety in stationary energy storage. Partial funding was provided by the Department of Energy's Office of Vehicle Technologies as part of the battery testing program. We would like to thank our program director Samm Gillard for his support of this work. Laboratory support from Chris Grosso, Lucas Gray, and June Stanley is acknowledged. We are grateful for fruitful discussions with Randy Shurtz, Yuliya Preger, and Summer Ferreira. Sandia National Laboratories is a multi-mission laboratory managed and operated by National Technology and Engineering Solutions of Sandia, LLC., a wholly owned subsidiary of Honeywell International, Inc., for the U.S. Department of Energy's National Nuclear Security Administration under contract DE-NA-0003525. This paper describes objective technical results and analysis. Any subjective views or opinions that might be expressed in the paper do not necessarily represent the views of the U.S. Department of Energy or the United States Government.