

Abstract
Polyaniline (PANI) is a candidate for electrocatalysis, and can be combined with metal nanoparticles to fabricate high-performance electrodes for electrochemical energy conversion and storage. However, its intrinsic properties appear to be dependent on the synthesis conditions so that from the majority of the reports, it is quite difficult to establish an overall performance trend. In this contribution, we report an extensive and systematic physicochemical and electrochemical screening of the potentiality of chemically synthesized PANI as an electrode material to provide an overall understanding of the effect of the entire synthesis conditions. We have integrated different methods (TGA-DSC, XRD, SEM, EDX, FTIR, BET, CHNS, XPS, CV, and EIS) to deeply examine the as-synthesized materials and interrogate their electrocatalytic efficiency towards hydrogen evolution reaction, which was chosen as a model reaction of critical importance for H2 production from water splitting. It was found that all the synthesis parameters affect strongly the physical and electrochemical characteristics of the PANI-based materials. Specifically, XPS analysis contributed to identify the oxidation levels of the PANI samples on the basis of oxidizing agents. The outcomes provided by the study delineate a rational pathway for the further design and fabrication of PANI-based metal nanoparticles as advanced electrode materials.
Export citation and abstract BibTeX RIS

This is an open access article distributed under the terms of the Creative Commons Attribution Non-Commercial No Derivatives 4.0 License (CC BY-NC-ND, http://creativecommons.org/licenses/by-nc-nd/4.0/), which permits non-commercial reuse, distribution, and reproduction in any medium, provided the original work is not changed in any way and is properly cited. For permission for commercial reuse, please email: oa@electrochem.org.
Hydrogen (H2) becomes a cornerstone not only for various industrial processes as a feedstock, but also as an energy carrier involved in energy conversion and storage scenarios through electrolysis and fuel cells.1–3 One of the most effective and alternative routes for its production with high purity is the electrolysis of water.3,4 Noble metals, and in particular the Pt-Ru-Ir series, have been considered ideal electrocatalysts for the water electrolysis by reducing the overpotential during the electrocatalytic hydrogen evolution reaction (HER) and oxygen evolution reaction (OER), but the high cost and low earth abundance of these materials have limited their use in large-scale H2 production technologies.3,5–8 In such a context, it is necessary to synthesize cost-effective materials suitable for HER as an alternative to Pt group metals (PGMs)-based electrocatalysts. Among the electrode materials playing a significant role in the performance of energy storage and conversion devices, conducting polymers combined with metallic species are good candidates for developing high-performance electrocatalysts thanks to their interesting structural and physical properties, taking advantage of each component.9–16 Among those conducting polymers, polyaniline (PANI)17–19 is one of the most studied material because of its high specific capacitance due to multi-redox reactions, its good electronic properties due to protonation and its high availability. In electrochemistry, PANI can act directly as an "electrode" or indirectly as a supporting material. To date, PANI has proven to be an ideal supporting matrix for the immobilization of metallic nanoparticles, resulting in electrode materials with superior performance and dispersive ability to prevent agglomeration of metallic catalysts.11,12,20–28
Traditionally, PANI has been synthesized by chemical or electrochemical methods, resulting in a powder or thin film with good electron transfer abilities in electrochemical oxidation and reduction reactions in (bio)electrocatalysis.19,25,26,29–41 As sketched in Fig. 1, the polymer exists in three main oxidation states, well-identified by cyclic voltammetry methods, a fully reduced state as leucoemeraldine base (LB), a semi-oxidized state as emeraldine base (EB) or emeraldine salt (ES) with an acidic doping agent, and a fully oxidized state as pernigraniline base (PB).42–44 The typical synthetic pathway to obtain PANI involves the presence of an acid doping agent and an oxidizing agent that enables the polymerization of aniline (ANI, C6H5NH2, consists of a phenyl group attached to an amino group). The oxidizing agents, such as APS, K2Cr2O7, H2O2, KMnO4, KI,17,45–47 allow the elimination of a proton from the aniline monomer and the initiation of the polymerization by redox processes involving the repetition of monomeric units.48 The amount of the oxidizing agent during the polymerization of PANI influences the amount of radical cations and thus the polymerization yield; however, an excess can lead to excessive oxidation of PANI, while a deficit may be insufficient to obtain the polymer.49 Thus, the control of the [oxidizing agent]/[ANI] ratio is of critical importance.
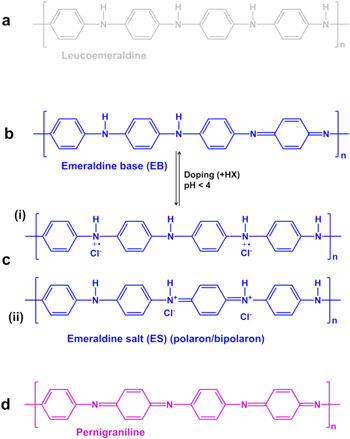
Figure 1. Chemical structure of the different types of polyaniline. (a) leucoemeraldine (LE, colorless or white in color, 100% C–NH–C amine bonds, i.e. fully reduced state), (b) emeraldine base (EB, blue in color, 50% C–NH–C amine bonds and 50% C=N–C imine bonds), emeraldine salt (ES, green in color) after doping giving rise to polaron and bipolaron structures, (c) pernigraniline (PG, purple in color, 100% C=N–C imine bonds, fully oxidized state). n = polymerization degree.
Download figure:
Standard image High-resolution imageThe insulating form of PANI, namely emeraldine base, consists of two amino nitrogen atoms followed by two imino nitrogen atoms and is blue in color (Fig. 1b). The acidic doping agent (normal acid or Lewis acid), such as HClO4, FeCl3, NH4BF4, HCl, HNO3, H2SO4, H3PO4,20,44 allows the protonation of the imine nitrogen atoms of the emeraldine base to form the emeraldine salt (Fig. 1c). This results in the generation of charge-carriers (a doubly charged bipolaron that spontaneously dissociates to give two polarons or radical cations) along the polymer backbone.44,50 The hopping of the charge carriers through the structure of the polaron results in a conducting polymer.10–12 In addition to the influence of the amount and nature of the doping agent, the regular distribution of the counter-ions of the acidic doping agent along the polymer backbone ensures a high structural regularity of the polymer backbone, and contributes to the increased mobility of the charge carriers. Thus, the doping process allows PANI to change from an insulating state to a conductive state with a crystalline (ordered) region responsible for its conductivity, dispersed in an amorphous (disordered) region.29
The chemical synthesis parameters based on the oxidizing agent, acid doping agent and counter anions have a great influence on the oxidation state and the doping level of PANI, resulting in various final morphologies and properties. Extensive literature is available regarding the influence of these reaction parameters on the synthesis of PANI, however, the results are difficult to compare because of different conditions of preparation, and the works dealing with the effect of all the reaction parameters related to the electrochemical characteristics of PANI are rarely available. This work was motivated by the desire to determine the optimal reaction conditions for the oxidative chemical synthesis of PANI in order to develop a noble metal-free PANI matrix with consistent quality and high electrical conduction, and to obtain an effective support of electrocatalysts. Given the great importance of developing PGMs-free electrocatalysts for H2 production, we used the HER reaction as a model in acidic media. To this end, this work presents a systematic investigation aiming to establish the influence of the synthesis variables such as doping agent, oxidant agent, and oxidant/monomer ratio on the morphological, electrical and electrochemical properties of the resulted PANI-based materials. The entire results reveal that all the aforementioned reaction parameters affect strongly at different levels the structural properties of the PANI materials, which in turn affect its efficiency towards HER in acidic media.
Experimental
Chemicals and materials
Aniline (ANI, 100%, Prolabo), hydrochloric acid (HCl, 37%, Carlo Erba), sulfuric acid (H2SO4, 98%, Sigma Aldrich), nitric acid (HNO3, Cheminova, 60%) and phosphoric acid (H3PO4, 50%, Panreac) were used as doping agents. Ammonium persulfate ((NH4)2S2O8, 98%, Biochem), potassium permanganate (KMnO4, 99%, Fisher) and potassium dichromate (K2Cr2O7, 99%, Prolabo) were used as oxidizing agents for the chemical aniline polymerization. Isopropanol (99.5%, Sigma Aldrich) and Nafion® suspension (5 wt%, sigma Aldrich) were used for the catalyst ink preparation. All chemicals were used without further purification, and electrolytic solutions used for polyaniline synthesis or for electrochemical characterizations were prepared freshly. All named ultrapure water (MQ) is provided by Milli-Q Millipore source (18.2 MΩ cm at 20 °C).
Preparation of PANI-based materials
The synthesis conditions are listed in Table SI (available online at stacks.iop.org/JES/167/066503/mmedia). Typically, PANI was synthesized by the chemical oxidative polymerization as follows: a defined amount of aniline (ANI) was dissolved in 100 ml of an acid doping agent (HCl, H2SO4, H3PO4 or HNO3) by stirring at room temperature. A solution consisting of 0.2 M of oxidizing agent ((NH4)2S2O8, KMnO4, or K2Cr2O7) dissolved in another 100 ml of the above acid was added dropwise to the solution of aniline with vigorous stirring for 2 h at 5 °C. After 3 min, the color of the solution changed from colorless to dark green, indicating the beginning of the polymerization. The resulting PANI powder was filtered and washed with ultrapure water until the filtrate was colorless, and dried in an oven at 40 °C for one day.
Methods for physicochemical characterizations of the materials
X-ray diffraction (XRD) patterns were recorded by a DR-X-PRO-MPD-Philips diffractometer with CuKα radiation at the wavelength of 1.5406 Å, the voltage and tube current being 40 kV and 40 mA, respectively. Spectra were collected in a 2θ range from 5 to 80° at a room temperature. FTIR spectra were recorded on a Nicolet iS50 FTIR Spectrometer in the range of 4000–400 cm−1, with a resolution of 4 cm−1. The measurements were carried out at room temperature on the basis of 1 mg of PANI and 200 mg of KBr compacted into thin pellets using hydraulic press (5 tons). Thermogravimetric analysis (TGA) and differential scanning calorimetry (DSC) were performed with a SDT Q600 TA instruments on crucible of aluminum containing ca. 6 mg of material, in the temperature range of 25 to 500 °C with a heating rate of 10 °C min−1 and under air atmosphere (100 ml min−1). The electrical conductivity was measured by four-point method at room temperature on pellets of the PANI (1 mm thickness and 13 mm diameter) using an Keithley Electrometers 2400 (Model LUCAS LABS, Pro 4-8400). The morphology of PANI powder was analyzed by scanning electron microscopy (SEM) on Hitachi S-4800 FEG, and the elemental analysis was obtained by energy dispersive X-ray spectroscopy (EDX) on the microscope ZEISS EVOHD 15, followed by 2D mapping of carbon (C) and nitrogen (N). The surface properties (porosity and the specific surface area (SBET)) were investegated by Brunauer–Emmett–Teller (BET) and distribution BJH measurements. N2 adsorption-desorption isotherms were recorded at liquid N2 temperature (77.3 K) using a Micromeritics ASAP 2020 instrument. CHNS analysis was performed on an Elementar vario MICRO cube. X-ray photoelectron spectroscopy (XPS) analyses (the analyzed surface and depth are of 300 × 700 μm2 and 10 nm, respectively) were performed on a Kratos Axis Ultra DLD spectrometer equipped with a monochromatic radiation source Al Mono (Alkα = 1486.6 eV) operating at 150 W (15 kV and 10 mA). Data were recorded at a step of 1 eV (transition energy of 160 eV) and 0.1 eV (transition energy of 20 eV) for the survey and high-resolution spectra, respectively. The measured binding energy (BE) was corrected on the basis of the energy of C1s at 284.6 eV by using the CASA XPS software for the peaks fitting. The quantification was carried out from the peak area after correction with a suitable sensitivity factor.
Catalytic ink preparation
The catalytic ink was prepared by mixing 2 mg of PANI powder, 180 μl of isopropanol and 20 μl of Nafion® suspension in a water ultrasonic bath for 20 min to form a homogenous ink. Then, 4 μl of the ink was coated on the surface of well-polished glassy carbon rotating disk electrode (GC-RDE, 5 mm diameter, 0.2 mg cm−2 loading) and dried under N2 atmosphere at room temperature for 5 min. The GC-RDE was first polished with alumina at 3 μm, 1 μm and 0.05 μm, washed with ultrapure water, and a sonication in pure water for 5 min in order to remove all traces of alumina.
Electrochemical characterization by cyclic voltammetry
The electrochemical characterization was conducted in a conventional three-electrode cell using the SP150 potentiostat (Biologic Science Instruments). Ag/AgCl/KCl (3 M) was used as reference electrode and was separated from the solution by a Haber-Luggin capillary tip. The potentials were calibrated to the reversible hydrogen electrode (RHE) according to the calibration relationship E(V vs RHE) = E(Ag/AgCl) + (0.208 + 0.059 × pH). A slab of glassy carbon of about 12 cm2 was used as a counter electrode. The working electrode consisted of a GC-RDE modified with the PANI based catalyst, which was characterized in 0.5 M H2SO4 (pH = 0.3) solution using cyclic voltammetry (CV) between 0.06 and 1.26 V vs RHE at 100 mV s−1. The electrolyte solution was purged with N2 over 20 min before measurements. All voltammograms are iR-free, i.e., corrected by the "potential drop" between the working and reference electrodes according to the relationship Ereal = Eapplied − RΩ × I. RΩ was obtained by the electrochemical impedance spectroscopy (EIS).
Electrochemical performance
The electrocatalytic behavior of PANI-based electrodes towards HER was evaluated by linear sweep voltammetry (LSV). Before electrocatalytic measurements, each electrode was firstly cycled by CV for 30 cycles between 0.06 and 1.26 V vs RHE in N2-saturated 0.5 M H2SO4, then LSV was conducted from the open circuit potential (OCP) to −1.024 V vs RHE at a scan rate of 5 mV s−1 and 900 rpm for 7 cycles. The Tafel slope value was calculated from the plot of the potential as a function of the current density in a logarithm-scale. The kinetic activity of the as-prepared electrodes towards HER was also estimated by EIS by scanning the frequencies from 200 kHz to 100 mHz (10 mV amplitude), at Eappl = −0.6 V vs RHE.
Accelerated ageing experiments
Durability tests of the as-modified electrodes were carried out by LSV between OCP and −1.024 V vs RHE at a scan rate of 5 mV s−1 and 900 rpm for 500 cycles.
Results and Discussion
Effect of the doping agent concentration
The proton-based acid doping of the emeraldine base segment results in the protonation of the imine nitrogen atom in the backbone chain and gives emeraldine salt form with positive (proton) and negative (anion) charges. Thus, we firstly hypothesized that the doping agent concentration should affect the electrical conductivity of the conducting polymer. As a starting point for the preparation of PANI, we studied the polymerization process in the presence of HCl as the acidic doping agent. To this end, Cl‒ was chosen as the simplest and smallest counter-ion, compared to those of to nitrate, sulfate and phosphate ones. Different PANI materials have been synthesized by oxidative chemical polymerization with different concentration of HCl from 0.30 to 1.00 M, referred to as PANI-HCl0.30, PANI-HCl0.5, PANI-HCl0.75, and PANI-HCl1.00. We have chosen APS as the oxidizing agent with the molar ratio R = [APS]/[ANI] = 2 for [ANI] = 0.1 M as the best compromise. To evaluate the influence of those HCl conditions on the crystallinity and subsequently the conductivity and catalytic properties, we firstly characterize the homemade PANI-based materials by XRD. Figure 2a shows that the as-synthesized PANI-HCl materials exhibit 4 peaks at 2θ values of 8.88, 15.27, 20.80 and 25.54°, corresponding to (001), (011), (100) and (110) crystal planes, respectively, thus confirming the successful synthesis of a crystalline form of PANI, in agreement with the litterature.51,52 Accordingly, the first peak at 8.88° is assigned to the d-spacing between the N atoms of adjacent main chains and the doping agent, the peaks at 15.27° and 20.80° are attributed to the parallel periodicity to the chains, whereas the peak at 25.50°, more intense, is ascribed to higher presence of PANI chains with perpendicular periodicity.53–55 PANI in the un-doped state (polyaniline emeraldine base) is amorphous in nature,56 and its crystallinity increases with increasing concentrations of the doping agent due to the incorporation of counter-ion (herein Cl-) and hydrostatic forces with protons.57 This behavior is evidenced by the presence of a wider peak around 20.80° for the sample PANI-HCl0.30, thus reflecting a more amorphous structure. Moreover, the peak at 8.88°, mainly observed for the PANI-HCl0.50 and PANI-HCl0.75 samples, comes from a shorter distance between the counter-anion and the polymer chains, reflecting a higher order of PANI chains.58 Besides, the values of β (full width at half-maximum), LV (crystalline size) and d-spacing, estimated using Scherer and Bragg formulae Eqs. 1 and 2, respectively55,59 (Table SII), confirm the better mobility of charge carriers along the polymer main chain in the sample PANI-HCl0.50, meaning that it should have a higher electrical conductivity.60


Where λ(=1.54060 Å) is the X-ray wavelength, θ is the Bragg's angle, β(in radian) is the full width at half-maximum (FWHM) of the peak, k is a constant (≈0.9), LV is the average crystallite size, d(hkl) is the inter-planar spacing of the crystallographic plane (hkl).
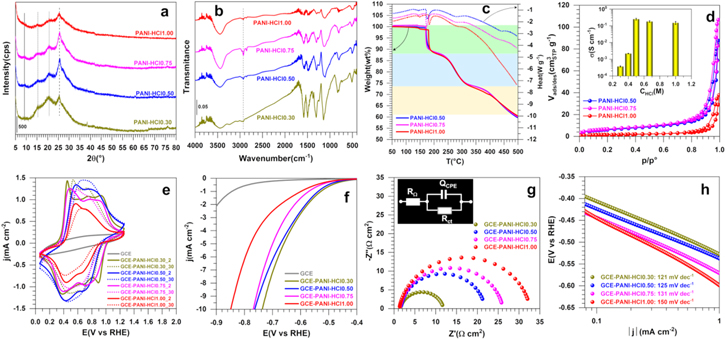
Figure 2. (a)–(d) Properties and (e)–(h) performance (in 0.5 M H2SO4 at 25 °C) of the as-synthesized PANI-based materials at different concentrations of [HCl] ranging from 0.3 to 1.00 M and using APS as the oxidizing agent at R = [APS]/[ANI] = 2 while [ANI] = 0.1 M. (a) XRD patterns, (b) FTIR spectra, (c) TGA-DSC curves, (d) N2 adsorption-desorption isotherms: the inset shows electrical conductivity measurement data, (e) iR-free CVs recorded at 100 mV s−1, (f) iR-free 7th LSVs recorded at 5 mV s−1, (g) Complex-plane Nyquist impedance plots at Eappl = −0.6 V vs RHE: the inset shows the use EEC for data fitting that is RΩ + QCPE//Rct, (h) Tafel plots from the panel (f).
Download figure:
Standard image High-resolution imageWe next used FTIR spectroscopy to perform a deep characterization of the polymer materials. Figure 2b shows that increasing the HCl concentration results in spectra with lower bands height in the region 2000–500 cm−1, and broader bands in the region 3000–3800 cm−1. The position of the main peaks is resumed in Table SIII. The characteristic peaks are observed around 3444 cm−1 (stretching vibration of N–H bond of the secondary amine61), 2925 and 2854 cm−1 (symmetric and asymmetric elongation of aliphatic C–H bonds), 1579 and 1497 cm−1 (stretching deformation of quinoid and benzenoid rings, respectively58,62), 1292 cm−1 (C–N stretching vibration), 1238 cm−1 (stretching vibration of delocalized polaronic structure C–N+), 1142 cm−1 (vibration mode of protonated amines –NH+ = created during the doping process63), and 826 cm−1 (out-of-plane deformation of the bonds C–H of aromatic cycles). The shift of the bands corresponding to the quinoid and benzenoid rings to a lower wavenumber for the sample PANI-HCl0.50 confirms the higher degree of protonation of the material.50 The profiles of TGA and DSC of PANI-HCl are reported in Fig. 2c; the main characteristics are reported in Table SIV. The upper temperature of 500 °C was fixed to avoid the combustion of carbon. The TGA curves reveal a common feature with a three-step mass loss for all samples. The first weight loss at about 120 °C is associated with the evaporation of water molecules that are adsorbed and trapped between the hydroscopic polymer chains and require a much higher temperature to remove them.64,65 The position of the peaks is 142; 143, 143 and 147 °C for PANI-HCl0.30, PANI-HCl0.50, PANI-HCl0.75 and PANI-HCl1.0, respectively. For PANI-HCl1.0, the phenomenon occurs at much higher temperatures presumably because of the agglomerated morphology nature of the particles constituting the materials, whereby the removal of those solvent molecules embedded in the PANI's network is much hard. This will be fixed by the SEM observations. The second weight loss between 200 °C and 350 °C is ascribed to the elimination of the residual doping agent and the decomposition of smaller polyaniline fragments,66 and the third loss above 330 °C is attributed to the degradation of the main PANI chains.67 From DSC curves in Fig. 2c, it can be observed that the evolution of PANI-HCl samples is similar and displays four peaks corresponding to the endothermic process which needs energy at each decomposition stage (values reported in Table SIV). The endothermic peaks between 130 °C–150 °C and 160 °C–200 °C correspond to the structural rearrangement and moisture desorption. The third endothermic peak between 230 °C and 320 °C can be associated to a mix phenomenon of "de-doping process," exclusion of residual anions (Cl−) from the polyaniline structure and the polymer reticulation, while the change at 422 °C is attributed to the structural degradation of the main PANI backbone.68 The polymer reticulation is basically an exothermic process; however, as in the present case many phenomena occur simultaneously, the reticulation would be hidden. Indeed, the prevalence of the entire endothermic parts may imply that the reticulation of the polymer does not occur.
The forth physical method used herein to investigate those PAN-based carbon materials was the N2 adsorption-desorption. This technique allows the assessment of the textural properties of porous materials by using N2 as a probing molecule. Figure 2d depicts the N2 adsorption-desorption isotherms (which belongs to the type IV) of representative PANI-HCl samples obtained at [HCl] = 0.50, 0.75 and 1.00 M. The hysterisis loop at a higher relative pressure which is characteristic of capillary condensation indicates the presence of mesopores. Quantitative data are reported in Table I and Table SIV. The evaluated BET surface was 23, 25 and 6 m2 g−1 for PANI-HCl0.50, PANI-HCl-0.75 and PANI-HCl1.00, respectively. From the pore size distribution measured by the BJH method (Fig. S1), the polymers exhibit a mesopourous structure.69,70 The pore volume is 0.13, 0.16 and 0.06 cm3 g−1 for PANI-HCl0.50, PANI-HCl-0.75 and PANI-HCl1.00, respectively. The lowest specific surface area and pore volume values for PANI-HCl1.00 reinforce the presumption of the previous TGA results, which suggested the possible presence of agglomerated particles reducing the available exposed surface. The strong impact of the HCl concentration on the electrical conductivity (σ) values of the PANI-HCl samples can be observed in Fig. 2d (inset) and in Table I. σ increases from 3.7 × 10⁻⁴ to 0.25 s cm−1 for PANI-HCl0.30 to PANI-HCl0.50. This can be explained by the higher concentration of remaining protons capable of binding to N atoms of the imine units, thus promoting the formation of polarons/bipolarons between the polymer chains that are the charge carriers responsible for electrical conductivity of PANI.71,72 For the concentration above 0.5 M HCl, the slight decrease in σ can be explained by a possible agglomerated morphology of the particles induced by the above excess protons binding to nitrogen atoms. From these physical characterizations of the HCl-depend properties of PANI, it can be concluded that the doping process allows the polymer to change from an insulating state to a semiconductor or conducting state.
Table I. BET surface area, electrical conductivity (EC), and EIS analysis of the as-prepared PANI-based materials.
| BET | EC | EIS | ||||
|---|---|---|---|---|---|---|
| Entry | SBET(m2 g−1) | σ(S cm−1) | RΩ(Ω cm2) | Rct(Ω cm2) | QCPE(μF sa–1) | a |
| PANI-HCl0.30_APS_R2 | — | 3.7 × 10⁻⁴ | 1.4 | 10.3 | 1.6 | 0.90 |
| PANI-HCl0.50_APS_R2 | 23 | 0.25 | 1.6 | 20.1 | 1.6 | 0.92 |
| PANI-HCl0.75_APS_R2 | 25 | 0.18 | 1.3 | 26.2 | 1.2 | 0.92 |
| PANI-HCl1.00_APS_R2 | 6 | 0.15 | 1.3 | 31.4 | 1.2 | 0.91 |
| PANI-R0.50_HCl0.50_APS | 21 | 1.39 | 2.4 | 15.2 | 1.8 | 0.90 |
| PANI-R0.67_HCl0.50_APS | — | 0.75 | 2.2 | 41.5 | 1.8 | 0.94 |
| PANI-R1.00_HCl0.50_APS | 26 | 0.64 | 2.1 | 17.5 | 1.8 | 0.94 |
| PANI-R2.00_HCl0.50_APS | 23 | 0.25 | 1.6 | 20.1 | 1.6 | 0.89 |
| PANI-HCl_R0.50_APS | 21 | 1.39 | 2.4 | 15.2 | 1.8 | 0.90 |
| PANI-HNO3_R0.50_APS | 20 | 0.26 | 2.0 | 20.2 | 1.5 | 0.89 |
| PANI-H2SO4_R0.50_APS | 16 | 0.50 | 2.0 | 41.5 | 1.4 | 0.91 |
| PANI-H3PO4_R0.50_APS | 18 | 0.33 | 2.3 | 18.2 | 1.4 | 0.92 |
| PANI-APS_R0.50_HCl | 21 | 1.39 | 2.4 | 15.2 | 1.8 | 0.90 |
| PANI-K2Cr2O7_R0.50_HCl | 11 | 2.6 × 10⁻⁵ | 2.0 | 345.0 | 1.4 | 0.90 |
| PANI-KMnO4_R0.50_HCl | 2 | 2.1 × 10⁻³ | 1.4 | 75.4 | 1.3 | 0.93 |
Conclusively, the best compromise should be the use of HCl as acidic doping agent at the concentration of 0.5 M, with [ANI] = 0.1 M and [APS]/[ANI] = 2. This means that the molar ratio of HCl to ANI in the reactor should be 10:1.
The above studies show only the optimal conditions when these PANI-based materials are intended to be used as "raw material." To determine whether the conclusion could hold or not for the application in electrochemistry in aqueous solutions, we further electrochemically characterized them in H2SO4. Figure 2e shows the iR-free CV curves (2nd and 30th cycles) over the potential window of −0.06 to 1.26 V vs RHE. Compared to the blank glassy carbon electrode, the CV profiles of the PANI-based materials exhibit two characteristic redox processes, which correspond to the well-described oxidation states of PANI.67,70,73 The PANI-HCl1.00 exhibits the lowest current density response, which could be corroborated with the BET measurements above. The pair of redox peaks located at 0.56/0.37 V vs RHE is ascribed to the electrochemical transition from the fully reduced form of PANI (leucoemeraldine) to the partially oxidized state (emeraldine salt). The second pair of redox peak at 0.94/0.77 V vs RHE is attributed to the transition between the emeraldine salt and the fully oxidized form of PANI (pernigraniline).73 After 30 cycles, the CV profiles present a steady-state response with only one redox system with oxidation/reduction peaks located at around 0.67 and 0.52 V vs RHE, respectively. It is argued that this behavior corresponds to an irreversible morphological transformation in the polymer associated with the reorganization of the polymer chains and mobility of the anions among the cycles.44,74
The electrocatalytic activity of the PANI-based materials for HER was evaluated by LSV and compared with pure GC-RDE support. It should be pointed out that the HER's mechanism on metal surfaces in acidic medium has been extensively studied,75,76 and consists in three steps described by Eqs. 3–5. The Tafel slope value gives important information on the rate determining step (rds) in an electrochemical reaction. Indeed, the dominant reaction step in the HER process can be theoretically indicated by a Tafel slope. The latter can be obtained from experimental LSV or EIS data and is interpreted as the relation between current density and overpotential.

Where bV, bH and bT are the Tafel slopes (mV dec−1), α is the symmetry coefficient (typically, α = 0.5), F is the Faraday constant (96 485 C mol−1), R is the ideal gas constant (8.314 J K−1 mol−1), and T is the absolute temperature (273.15 + °C).
Figure 2f shows that pristine GCE exhibits a very limited catalytic activity, while the PANI-HCl0.30 exhibits a catalytic activity closed to the PANI-HCl0.50, despite its low electrical conductivity. This behavior is probably due to the protonation of the nitrogen atoms of amines units of polyaniline that occurs in the strong acid H2SO4. The overpotential required for driving a cathodic current density of 10 mA cm−2 for PANI-HCl0.30, PANI-HCl0.50, PANI-HCl0.75 and PANI-HCl1.0 is 0.74, 0.77, 0.77 and 0.85 V, respectively. This confirms the low performance of the sample PANI-HCl1.00. These catalytic activities are also assessed by the charge transfer resistance (Rct) values obtained from Nyquist plots in Fig. 2g and the Tafel slopes in Fig. 2h. The modelling of EIS data by a representative equivalent electrical circuit (EEC) embedded in Fig. 2g, i.e. RΩ + QCPE//Rct, enables the determination of Rct and QCPE (constant phase element).77,78 QCPE expresses the lack of homogeneity and mass transport. Rct (inversely proportional to the rate constant k°, thus to the exchange current density j°) is the capacity of the electrode reaction of electron-transfer to conduct a large current density with lower driving force (overpotential).79 For a given electrode, the lower Rct is, the higher is the kinetic rate. The results gathered in Table I show that Rct = 10, 20, 26 and 31 Ω cm2 for [HCl] = 0.30, 0.50, 0.75 and 1.00, respectively. So, even though the sample PAN-HCl0.30 has a reduced "raw electrical conductivity" about two order of magnitude lower, the use of 0.5 M H2SO4 as the electrolyte enables to compensate the ionic conductivity. Furthermore, the value of Tafel slope80 is b = 120–150 mV dec−1. This suggests that the rds is limited by the protons adsorption (Volmer reaction, symmetry coefficient of α = 0.49–0.39). Based on the values of the charge transfer resistance and the Tafel slope, the PANI-HCl1.0 has the lowest performance, supported by the previous TGA-DSC and BET results.
The above studies suggest that there may be a drastic morphological difference between the PANI materials obtained with [HCl] ≤ 0.50 M and [HCl] ≥ 1.00 M. Hence to gain further insights into the morphology, SEM analysis was undertaken for representative samples synthesized with [HCl] = 0.30, 0.50 and 1.00. Figure 3 shows that the PANI powders present an irregular granular morphology. The increase in HCl concentration to 1.00 M during the chemical polymerization results in an increase in the particle size, leading to agglomeration that result in lower BET surface and electrocatalytic performance. Since ANI was fixed to 0.1 M, the above concentrations correspond to a molar ratio [HCl]/[ANI] = 3, 5 and 10. It can be concluded that the presence of HCl is necessary to trigger the chemical polymerization process. However, too high a concentration of protons relative to ANI (about 10) results in their excessive binding to N of the imine units. This promotes the formation of polarons/bipolarons between the polymer chains, which obviously leads to the formation of larger particles and reduced porosity. Based on all these physico-chemical and electrochemical screenings, the experimental conditions [HCl] = 0.5 M has been chosen as the best compromise for further investigations.
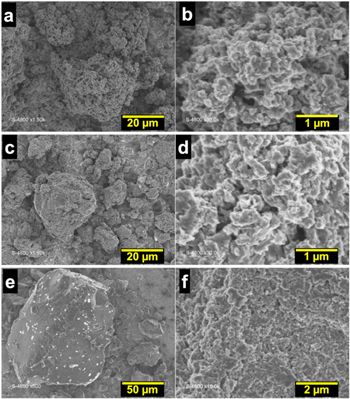
Figure 3. Overview (a), (c), (e) and near view (b), (d), (f) SEM micrographs of the as-synthesized PANI at different concentrations of [HCl]: (a), (b) 0.3 M, (c), (d) 0.50 M and (e), (f) 1.00 M. Oxidizing agent = APS, R = [APS]/[ANI] = 2 and [ANI] = 0.1 M.
Download figure:
Standard image High-resolution imageEffect of the ratio oxidant/ANI
Having demonstrated the ability to use HCl to grow self-supported PANI particles, we sought to study more carefully the impact of the oxidizing agent APS on the polymerization yield of PANI, to modulate its catalytic efficiency. To these ends, the synthesis conditions consisted in HCl as the doping agent at 0.5 M and APS as the oxidizing agent at 0.2 M. Different PANI-based materials were synthesized using variable quantities of ANI through the ratio R = [APS]/[ANI] = 0.4 – 2.0 and referred to as PANI-R0.40, PANI-R0.5, PANI-R0.67, PANI-R1.00 and PANI-R2.00. The same set of methods was used to characterize the materials, XRD (Fig. 4a), FTIR (Fig. 4b), TGA-DSC (Fig. 4c), N2 adsorption-desorption isotherms and electrical conductivity (Fig. 4d and Table I). The profiles are similar to those of Figs. 2a–2d. The electrical conductivity (inset in Fig. 4d) measurements show that the materials obtained for a molar ratio [APS]/[ANI] < 0.5, for instance the PANI-HCl-R0.4, has low conductivity. This is probably due to the formation of a shorter conjugation length of the polymer backbone resulting from a low polymerization yield. The optimal conductivity of 1.39 s cm−1 is reached for the optimal ratio [APS]/[ANI] = 0.5. However, too much excess of APS induces an obvious deterioration of the electrical conductivity (0.25 s cm−1 for [APS]/[ANI] = 2) due to the degradation by over-oxidation that produces shorter conjugated PANI chains.49,81 These results can be confirmed by XRD data (Fig. 4a and Table SII) that reveal the higher crystallinity degree of the polymer PANI-HCl-R0.5. FTIR spectra (Fig. 4b) do not show any significant structure change with the variation of the ratio Oxidant/ANI. Contrary to what has been observed by several authors,17,44 in our case, the evaluation of "the increase in the degree of oxidation" of PANI with the increase in the amount of APS could not be highlighted from the area ratio of the characteristic quinoid and benzenoid peaks. The N2 adsorption-desorption isotherms and BET analysis (Fig. 4d, Table SIV) indicate that SBET = 21, 26 and 23 m2 g−1 for PANI-R0.50, PANI-R1.00 and PANI-R2.00, respectively. The pore volume is ca. 0.13 cm3 g−1 for the three samples, meaning the same trends. At this stage of the study concerning the effect of the [APS]/[ANI] molar ratio, the best experimental conditions should be [HCl] = 0.5 M, [APS] = 0.2 M, and [APS]/[ANI] = 0.5 through [ANI] = 0.4 M.

Figure 4. (a)–(d) Properties and (e)–(h) performance (in 0.5 M H2SO4 at 25 °C) of the as-synthesized PANI-based materials using HCl as the doping agent at 0.5 M and APS as the oxidizing agent at [APS] = 0.2 M for different amounts of ANI through the ratio R = [APS]/[ANI]. (a) XRD patterns, (b) FTIR spectra, (c) TGA-DSC curves, (d) N2 adsorption-desorption isotherms: the inset shows electrical conductivity measurement data, (e) iR-free CVs recorded at 100 mV s−1, (f) iR-free 7th LSVs recorded at 5 mV s−1, (g) Complex-plane Nyquist impedance plots at Eappl = −0.6 V vs RHE: the inset shows the use EEC for data fitting that is RΩ + QCPE//Rct, (h) Tafel plots from the panel (f).
Download figure:
Standard image High-resolution imageNext, CV and LSV studies were carried out to probe the electrochemical and electrocatalytic properties of the samples. It should be mentioned that the optimized sample from the previous section is PANI-R2.00. Figure 4a shows that the highest current density for the redox peaks is reached for the sample PANI-R0.50. This behavior is substantiated by the performance towards HER (Figs. 4f–4g). PANI-HCl-R0.5 displays the best activity in terms of the overpotential at 10 mA cm−2, decreasing from 0.77 to 0.69 V. The determined charge transfer resistance is Rct = 15, 53, 42 and 20 Ω cm2 for PANI-R0.50, PANI-R0.67, PANI-R1.00 and PANI-R2.00, respectively. These results highlight the fast electron transfer ability of the sample obtained with a [APS]/[ANI] molar ratio of 0.5. As previously, the evaluated Tafel slope (Fig. 4h) of b = 110-131 mV dec‒1 indicates that the rds is the Volmer reaction of the protons adsorption at the electrocatalytic surface. The SEM observations in Fig. 5 for the materials obtained by [APS]/[ANI] = 0.5, 1 and 2 indicate that the aforementioned parameter affects marginally the morphology of the resulting polymers. This is consistent with the N2 adsorption-desorption isotherms, in which the surface area and pore volume are substantially the same. From the above investigations, we came with the conclusion that the optimal conditions should be [HCl] = 0.5 M, [APS] = 0.2 M, and [APS]/[ANI] = 0.5, i.e., [ANI] = 0.4 M and they have been chosen as the best compromise for the next step.
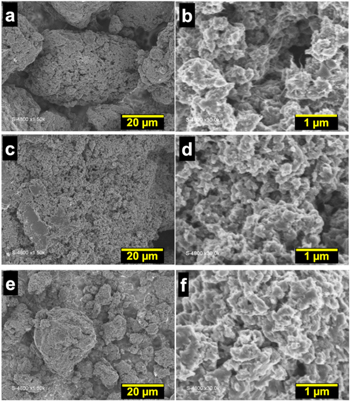
Figure 5. Overview (a), (c), (e) and near view (b), (d), (f) SEM micrographs of the as-synthesized using HCl as the doping agent at 0.5 M and APS as the oxidizing agent at [APS] = 0.2 M for different amounts of ANI through the ratio R = [APS]/[ANI]. (a), (b) R = 0.5, (c), (d) R = 1 and (e, f) R = 2. Oxidizing agent = APS and doping agent = HCl at 0.5 M.
Download figure:
Standard image High-resolution imageEffect of the nature of the doping agent
The electrical conductivity of conducting polymers also depends on the mobility of charge carriers, which depends on the size of the counter-ion of the doping agent attached to polymer chain and the type of the polarons formed. In general, an acidic doping agent based on protons dissociates in water to generate protons and anions, the latter being able to be inserted in the polymer matrix during the polymerization reaction to neutralize the positive charge.82 The acid dissociation constant and the counter-ion size may result in a difference in the protonation degree. During synthesis, the anions with the smallest size diffuse easily in the polymer matrix, thus resulting in both a higher doping level and a high efficiency of the mobility process, which increases the conductivity.83,84 In this context, the influence of the nature of the acidic doping agent on the physicochemical and electrochemical properties of polyaniline was carefully studied during the synthesis of the polyaniline in the presence of the strong acids, H2SO4, H3PO4, HNO3 and HCl, commonly used in the synthesis and doping of PANI. Based on the previous conclusions, we have synthesized PANI-based materials using APS as the oxidizing agent at [APS] = 0.2 M, R = [APS]/[ANI] = 0.5 (i.e. ANI at 0.4 M) and different doping agents at a concentration of 0.5 M. The obtained materials are referred to as PANI-HCl, PANI-HNO3, PANI-H2SO4 and PANI-H3PO4. The physicochemical characterizations are reported in Figs. 6a–6d, while the results from the electrochemistry are displayed in Figs. 6e–6h. Among the different acids, PANI-HCl exhibits by far the highest electrical conductivity (Fig. 6d, inset). This property was confirmed by the data deduced from XRD (Fig. 6a) that reveal the higher crystallinity degree and lower d-spacing for PANI-HCl (Table SII). The FTIR spectra analysis (Fig. 6b and Table SIII) supports the higher degree of protonation for PAN-HCl with a significant shift of the bands corresponding to the quinoid and benzenoid rings to lower wavenumbers.50 No observable changes were noticed for the N-H vibration modes with respect to hydrogen bonding. The thermal behavior of polyaniline shows a significant desorbed amount of the moisture for PANI-HCl about 17% and an improved thermal stability for PANI-HNO3 with a total weight loss of 33%. For PANI-H2SO4 and PANI-H3PO4, a steeper weight loss is observed, suggesting a lower thermal stability of these polymers. Data collected from BET measurements by N2 adsorption and desorption, and BJH methods (Fig. 6d, Table SIV, Fig. S1) confirmed the mesoporous structure for all materials, and showed that PANI-HCl has the highest specific surface area of 21 m2 g−1, while PANI-H2SO4 has the lowest value of 16 m2 g−1.
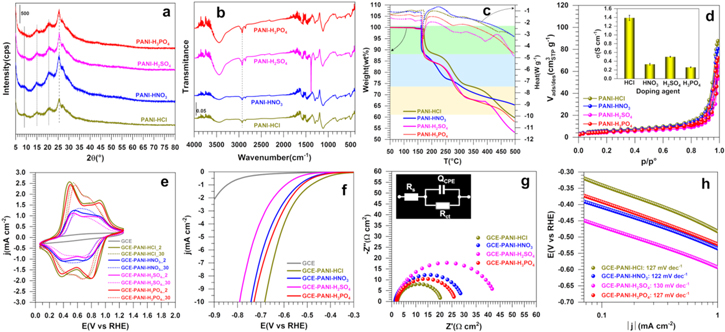
Figure 6. (a)–(d) Properties and (e)–(h) performance (in 0.5 M H2SO4 at 25 °C) of the as-synthesized PANI-based materials using different doping agents at a concentration of 0.5 M, APS as the oxidizing agent at [APS] = 0.2 M and R = [APS]/[ANI] = 0.5. (a) XRD patterns, (b) FTIR spectra, (c) TGA-DSC curves, (d) N2 adsorption-desorption isotherms: the inset shows electrical conductivity measurement data, (e) iR-free CVs recorded at 100 mV s−1, (f) iR-free 7th LSVs recorded at 5 mV s−1, (g) Complex-plane Nyquist impedance plots at Eappl = −0.6 V vs RHE: the inset shows the use EEC for data fitting that is RΩ + QCPE//Rct, (h) Tafel plots from the panel (f).
Download figure:
Standard image High-resolution imageFigure 6e shows the voltammograms of those PANI-based materials, which are similar for the entire samples and depict the two characteristic pairs of redox peaks, corresponding to the oxidation and reduction processes. It can be well observed that PANI-HCl and PANI-H3PO4 display higher current densities compared to PANI-H2SO4 and PANI-HNO3. From the LSV polarization curves (Fig. 6f) and Nyquist impedance plots at Eappl = −0.6 V vs RHE (Fig. 6g), PANI-HCl exhibits the best activity towards HER with the lowest Rct of 15 Ω cm2, whereas PANI-H2SO4 shows the lowest performance with Rct of 41 Ω cm2. This time we can deduce that there is little variation in the slope of Tafel (Fig. 6h), b = 122–130 mV dec‒1 that denotes that the rate limiting step is still the Volmer reaction of protons. The SEM images (Fig. 7) show a granular morphology contacted with some nanofibers domains for PANI-HCl, and more compacted and plate shape morphologies for the samples PANI-H2SO4, PANI-H3PO4 and PANI-HNO3. These SEM observations confirm the results of the N2 adsorption-desorption isotherms, for which no obvious difference was observed in terms of BET surface and total pore volume. It cannot therefore be used as a "decision maker" to choose the best conditions to synthesize PANI-based materials. By combining electrochemical and physico-chemical studies, HCl can be chosen as the best compromise to produce efficient PANI-based electrocatalyst.
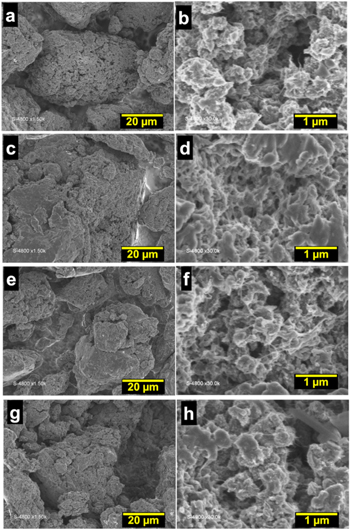
Figure 7. Overview (a), (c), (e), (g) and near view (b), (d), (f), (h) SEM micrographs of the as-synthesized PANI with doping agents at 0.5 M: (a), (b) HCl, (c), (d) HNO3, (e), (f) H2SO4 and (g), (h) H3PO4. Oxidizing agent = APS and R = [APS]/[ANI] = 0.5.
Download figure:
Standard image High-resolution imageEffect of the nature of the oxidant
As a final critical parameter, the nature of the oxidizing agent on the formation of PANI was investigated with common types of oxidants agents, namely APS ((NH4)2S2O8), KMnO4 and K2Cr2O7. We used the previously optimized condition with HCl at 0.5 M, ANI monomer at 0.4 M and the [APS]/[ANI] = 0.5 M. The as-fabricated materials are referred to as PANI-APS, PANI-K2Cr2O7 and PANI-KMnO4. The physical characterizations are reported in Figs. 8a–8d and electrochemical ones are displayed in Figs. 8c–8h. The crystallinity of the polymers has been examined by XRD and reported in Fig. 8a. While PANI-APS is characterized by a partially crystalline structure with the typical peaks at 8.88°, 15.54°, 20.82° and 2θ = 25.50°, PANI-KMnO4 and PANI-K2Cr2O7 in contrast show broad Bragg diffraction peaks centered at 24.15° and 20.78°, respectively, which is characteristic of an amorphous structure. This result confirms the observed extremely low conductivity of PANI-KMnO4 (2.1 × 10⁻³ s cm−1) and PANI-K2Cr2O7 (2.6 × 10⁻⁵ s cm−1), compared to PANI-APS (Fig. 8d, inset). This behavior may be explained by the low protonation level during the oxidation process in the presence of K2Cr2O7 and KMnO4. The particularity of APS is its high redox potential (2.01 V vs SHE) compared to the values of the redox potential of KMnO4 and K2Cr2O7 (1.51 and 1.33 V vs SHE, respectively), making it the best candidate for oxidative chemical polymerization to yield PANI. From FTIR spectra in Figs. 8b, the increase of the oxidation degree of PANI with the different oxidant was not evaluated from the area ratio of the characteristic quinoid and benzenoid peaks, nevertheless, PANI-APS shows the higher degree of protonation with a significant shift of the main characteristic bands to lower wavenumbers.50 From the thermal behavior of the three samples in Fig. 8c, the weight loss process in the case of PANI-APS and PANI-KMnO4 is characterized by three stages attributed to different structural changes in the polyaniline structure, as discussed above, while PANI-K2Cr2O7 displays only two weight loss stages. The second step corresponding to the removal of doping agent has disappeared. The sample shows only 12% weight loss between 120 °C–275 °C (Table SIV), due to the low protonation degree. In addition, faster weight loss and the absence of thermal stability zone were observed. The N2 adsorption-desorption isotherms and BET analysis (Fig. 8d, Table I, Table SIV) indicate that SBET = 21, 11 and 2 m2 g−1 for PANI-APS, PANI-K2Cr2O7 and PANI-KMnO4, respectively. The pore volume is 0.13, 0.04 and 0.01 cm3 g−1 for the same trend, meaning a significantly increased "exposed surface area" for the PANI obtained under the synthesis condition with APS as the oxidizing agent. At this stage of the study concerning the type of oxidizing agent to be used to obtain the highest electrical conductivity and especially the largest surface area is APS at 0.2 M.

Figure 8. (a)–(d) Properties and (e)–(h) performance (in 0.5 M H2SO4 at 25 °C) of the as-synthesized PANI-based materials using different oxidizing agents at R = [oxidizing agent]/[ANI] = 0.5, HCl as the doping agent at 0.5 M and [ANI] = 0.4 M. (a) XRD patterns, (b) FTIR spectra, (c) TGA-DSC curves, (d) N2 adsorption-desorption isotherms: the inset shows electrical conductivity measurement data, (e) iR-free CVs recorded at 100 mV s−1, (f) iR-free 7th LSVs recorded at 5 mV s−1, (g) Complex-plane Nyquist impedance plots at Eappl = -0.6 V vs RHE: the inset shows the use EEC for data fitting that is RΩ + QCPE//Rct, (h) Tafel plots from panels (f).
Download figure:
Standard image High-resolution imageWe next combined CV and LSV of HER to establish the voltammetry profiles and the electrocatalytic performance of the different samples derived from the use of the three types of oxidizing agents. From Figs. 8e–8h, the influence of the oxidant is clearly obvious. While PANI-APS presents the two typical redox transitions of leucoemeraldine/emeraldine-base and emeraldine-salt/pernigraniline with higher current densities, both PANI-K2Cr2O7 and PANI-KMnO4 display only one pairs of redox peaks at 0.78/0.41, 0.78/0.48 V vs RHE, with a potential difference (ΔE) of 0.37 and 0.30 V, respectively. These large peak-to-peak differences can be interpreted as an increase of the irreversibility. The Figs. 8e–8f show that PANI-APS has the best activity towards HER (overpotential of 0.69 V at 10 mA cm−2) with the lowest Rct of 15 Ω cm2, while PANI-K2Cr2O7 presents a very weak catalytic activity with Tafel slope value of 178 mV dec−1. The combination of the SEM observations (Fig. 9) and the measured BET surfaces area (Table I) demonstrate that the oxidant agent has a strong impact on the structural morphology of the PANI. PANI-APS has a granular morphology with an open structure (SBET = 21 m2 g−1), while the PANI-K2Cr2O7 exhibits a spherical morphology with irregular size distribution (SBET = 11 m2 g−1), and PANI-KMnO4 is characterized by a dense morphology with a very low porosity (SBET = 2 m2 g−1). Based on these results, we have considered APS as the best oxidizing agent for the synthesis of efficient PANI-based materials as "a potential catalyst" or "a supporting material of metallic nanoparticles" to be used in electrochemical applications. Conclusively, all those previous results show the ability to manipulate the synthesis conditions towards different polyaniline materials with different morphologies, electrical conductivity, electrochemical behaviors and electrocatalytic performance.
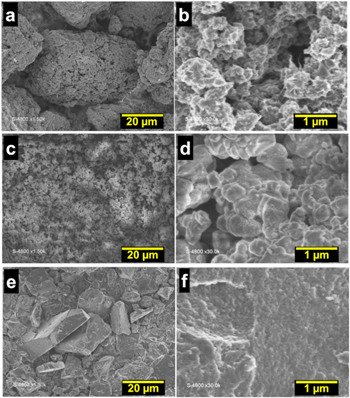
Figure 9. Overview (a), (c), (e) and near view (b), (d), (f) SEM micrographs of the as-synthesized PANI with oxidizing agents at the ratio R = [oxidizing agent]/[ANI] = 0.5 and [ANI] = 0.4 M. (a), (b) APS, (c), (d) K2Cr2O7, and (e), (f) KMnO4. Doping agent = HCl at 0.5 M.
Download figure:
Standard image High-resolution imageCompositional and surface screening
After carrying out a thorough and progressive study of the conditions for the synthesis of PANI, we specifically sought to determine whether or not the theoretical chemical composition of polyaniline was obtained and, above all, the proportion of the different forms of PANI. The 2D maps, obtained from EDX analysis (Figs. 10a–10h), confirm the successful synthesis of N-doped carbon materials with a uniform dispersion of carbon and nitrogen for each sample. Quantitative EDX analysis in Fig. 10i shows that an experimental proportion of 1 atom of N for 6 atoms of C is maintained in the entire PANI-based materials obtained from different conditions of [HCl] and [oxidizing agent]/[ANI], as expected from Fig. 1 (6 atoms of C for 1 atom of N). Furthermore, EDX analysis of PANI-APS, PANI-K2Cr2O7 and PANI-KMnO4 samples showed the presence of S, Cr, and Mn species (not shown herein), which could also explain the observed morphology of the materials and their electrical and electrocatalytic properties. It is reported that sulfur improves the electrocatalytic activity of the HER.85

Figure 10. Compositional analysis by EDX of the as-synthesized PANI-based materials, (a)–(h) elemental mapping images (scale bare = 25 μm) and (i) quantitative results. (a), (b), (e), (f) Effect of HCl concentration, (c), (d), (g), (h) Effect of the ratio R = [APS]/[ANI], (i) atomic ratio C/N: the horizontal dashed line represents the theoretical value of 1 atom of N for 6 atoms of C.
Download figure:
Standard image High-resolution imageFigure S2 shows the indexed survey XPS of the as-synthesized PANI-HCl0.5-R0.5-APS and PANI-HCl0.5-R1.0-APS to investigate the effect of [oxidizing agent]/[aniline] ratio, and of the PANI-HCl0.5-R0.5-K2Cr2O7 to study the effect of the oxidizing agent. High-resolution C1s and N1s spectra are shown in Fig. 11 and the extracted overall atomic composition is reported in Table SV. The presence of S (1.6 at%) for APS-based materials and chromium (2.7 at%) for the K2Cr2O7-based material was expected. The C/N atomic ratio of 6.4–7.0 obtained by XPS, which analyzes only a nanoscale domain (∼10 nm) of the sample, confirms the previous EDX results and definitely supports the successful retention of the aniline-based blocks. Figures 11a–11c display the different components of high-resolution XPS of C1s, while quantitative atomic composition is reported in Table SVI. The peak centered at ca. 284.6 eV belongs to graphitic carbon (sp2-hybridized carbon atoms, C=C)86,87 while that at ∼285.6 eV can be associated with formation of C–N chemical bonds.87–89 The peaks at 286.5 and 288.1 eV can be assigned to the carbonyl (C=O) and carboxylate (O–C=O) functions, respectively. For graphene-based materials, it is well-known that the peak at 290–291 eV belongs to the π → π* shake-up satellite peak.87,90 However, looking closely at the possible structures of the PANI-based materials (Fig. 1), this π → π* shake-up satellite can be split up to two peaks depending on the oxidation state of the PANI, herein at 289.6 and 292.0 eV for PANI-HCl0.5-R0.5-APS or PANI-HCl0.5-R1-APS (in agreement with the litterature89). A single peak is observed for PANI-HCl0.5-R0.5-K2Cr2O7 and indicates a change in the oxidation state of the PANI. Specifically, a deep analysis of N1s (Figs. 11d–11f) reveals four main components, known to be the imine ( N1) at ca. 398.3 eV, the amine (
 N2) at ∼399.9 eV, the polaron (
 N3) at 400.5–401.1 eV, and the bipolaron (
 N4) at 402.7–403.3 eV.89,91–97 Additionally, the peak at 406.1–406.6 eV is assigned to the π → π* shake-up satellite (N5) of the doublet presents on some nitrogen.98,99 The atomic distribution of those nitrogen atoms into N1-N5 species is reported in Fig. 12a and Table SVII. By calculating the atomic ratio (N1 + N3 + N4)/(N1 + N2 + N3 + N4), it is possible to further determine the oxidation state of the PANI.95–97,100 More precisely, a value of 0.5 indicates an intermediate oxidation stage of nitrogen in the PANI (emeraldine form), a value closed to 1 signifies a higher concentration of quinoid groups and therefore a highly oxidized form (pernigraniline), and a ratio below 0.5 denotes the predominance of a highly reduced PANI (leucoemeraldine). In Fig. 12a, the evaluated ratio is 0.48, 0.41 and 0.66 for PANI-HCl0.5-R0.5-APS, PANI-HCl0.5-R1.0-APS, and PANI-HCl0.5-R0.5-K2Cr2O7, respectively. In other words, the PANI obtained with the oxidant APS is in the form of emeraldine while a pernigraniline form results from the use of K2Cr2O7. Interestingly, the polaron/bipolaron amount is 43, 38, and 23 at% for PANI-HCl0.5-R0.5-APS, PANI-HCl0.5-R1.0-APS, and PANI-HCl0.5-R0.5-K2Cr2O7, respectively. The high amount of the polaron species is accompanied by the presence of chlorine (0.5 at%) in both PANI materials synthesized with APS. It is well-known that these species are responsible of the electrical conductivity (σ) of the polyaniline,10–12 and thus confirmed the higher conductivity value observed for PANI-HCl0.5-R0.5-APS. Conclusively, this XPS study validates the previous physical and electrochemical data and supports the critical importance of the synthesis inputs.
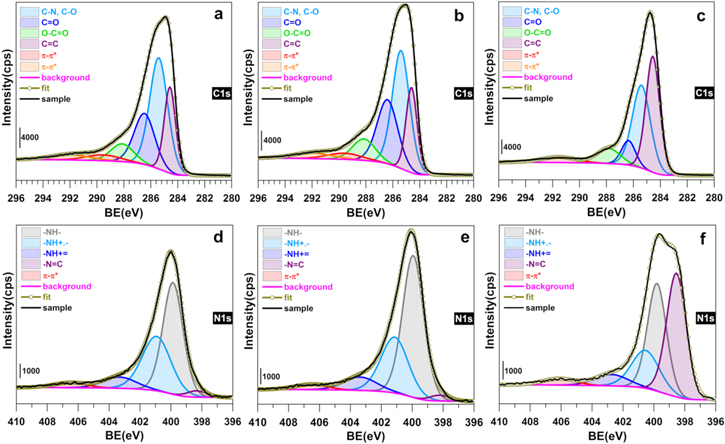
Figure 11. High-resolution XPS spectra of the core level C1s (a)–(c) and N1s (d)–(f) obtained for the as-synthesized materials: (a), (d) PANI-HCl0.5-R0.5-APS, (b), (e) PANI-HCl0.5-R1-APS, and (c), (f) PANI-HCl0.5-R0.5-K2Cr2O7.
Download figure:
Standard image High-resolution image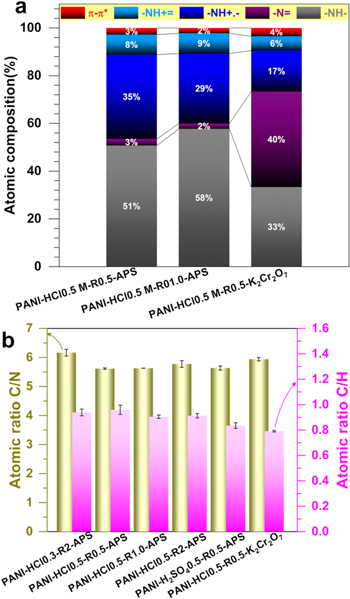
Figure 12. (a) Surface atomic composition of the different types of N species as-determined from XPS of N1s. (b) CHNS analysis of materials: atomic ratios of C/N (Left y-axis) and C/H (Right y-axis).
Download figure:
Standard image High-resolution imageTo access the amount of hydrogen atoms, we alternatively utilized the "CHNS analysis" to determine the real bulk composition of C, N and H (Table SVIII). The results reveal that the C/N ratio is about 6, while the C/H ratio is ca. 0.9 (Fig. 12b), indicating the presence of a large amount of N and H atoms. However, the inevitable presence of water molecules adsorbed and trapped between polyaniline chains results in an overestimation of the H atoms in the polyaniline materials since the theoretical ratio was expected to be between 1.20 and 1.50 depending on the oxidation state of the polyaniline (Fig. 1 and Table SVII).
Accelerated ageing effect on the electrochemical properties
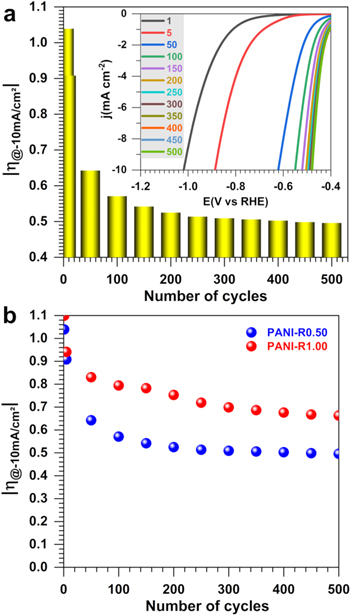
After the previous set of characterization, we finally sought to gain deeper insights about the behavior of the PANI upon the potential cycling. The electrochemical accelerated ageing procedures by potential/current cycling or by fixing potential/current enable to anticipate the behavior of a material during real use. Given the electrochemical behavior of polyaniline as previously noted by voltammetry, we used LSV to interrogate the durability of two representative PANI samples. Experiments were performed with PANI-R0.50 and PANI-R1.00 by scanning the electrode potential between OCP and −1.024 V vs RHE at a scan rate of 5 mV s−1 and 900 rpm for 500 cycles. The potential of OCP was recorded during 30 s between two cycles to reach a relative stabilized electrode after the removal of the H2 bubbles from the electrode surface. The obtained results are reported in Figs. 13a–13b. It should perhaps be reiterated that the previous LSV of HER are those obtained for the 7th LSV, in order to save time. The evolution of the overpotential required to reach the metric current density of 10 mA cm−2 (Fig. 13a) is in agreement with the previous behavior of the CVs, suggesting stable HER activity in acid media. After 300 cycles, the overpotential is about 500 mV for the electrode PAN-R0.5, i.e., 150 mV lower than the electrode PANI-R1. This is in agreement with the previous results. It should be noted that the blank experiment of a glassy carbon electrode does not show any significant change of the activity. So, the observed positive change could be assigned to a structural change at the polymer itself. Further deeper postmortem scrutinizing could provide insights about the trend. In the literature, one of the methods identified for boosting the electrocatalytic activity of polyaniline towards the HER in aqueous medium is the introduction of species such as Co and Ni, making it possible to reach a current density of 10 mA cm−2 with overpotential of 100–300 mV.20,24,25 For instance, Feng et al.25 have demonstrated that the multi-composition PANI/CoP material increases the hydrogen evolution electrocatalysis in 0.5 M H2SO4, whereby the PANI can effectively capture H+ from hydronium ions to form protonated amine groups, having a higher positive charge density than those of hydronium ions and can be electro-reduced easily. Even though the concept is beyond the scope of the present work, the introduction of metals followed by the materials calcination should results in electrocatalysts with high performance. In this case, the knowledge provided by the present study on the oxidation state of polyaniline would be crucial. Indeed, the transformation at high temperatures of the latter into a nanostructured carbon network containing or not nitrogen depends strongly on how those nitrogen atoms are bound to the carbon as well as the type of carbon-carbon bounds in the parent structure.
Figure 13. Accelerated potential cycling in 0.5 M H2SO4 at 25 °C for the as-synthesized PANI-based materials using HCl as the doping agent at 0.5 M and APS as the oxidizing agent at different amounts through the ratio R = [APS]/[ANI]. (a) LSV recorded at 5 mV s−1 and inset the overpotential at j = −10 mA cm−2 for R = 0.5. (b) Behaviors of the overpotential at j = −10 mA cm−2 from LSV recorded at 5 mV s−1.
Download figure:
Standard image High-resolution image
Conclusion
The present work was aimed to provide a complete understanding of the effect of the synthesis conditions on the physical and electrochemical properties of the polyaniline (PANI) obtained from the conventional chemical polymerization. Different physicochemical (TGA-DSC, FTIR, XRD, SEM, EDX, CHNS, BET, and XPS) and electrochemical (voltammetry and impedance spectrometry) methods have been integrated to characterize the as-synthesized polyaniline materials and to interrogate the property-to-performance relationship. The electrocatalytic hydrogen evolution reaction (HER) in acidic media has been chosen as a model reaction. Indeed, the electrochemical production of H2, an essential feedstock for industrial processes and energy carrier for fuel cells, appears to be one of the sustainable power-to-X scenarios to significantly reduce the dependence on conventional energy sources based on fossil fuels. Our outcomes show that the morphology, the conductivity, and the electrochemical performance of the polyaniline are mainly determined by the synthesis conditions. Specifically, the proton-based acid doping agent and the oxidant affect the degree of crystallinity, the inter-chain separation, the oxidation state, the degree of doping and further the density of charge carriers and their mobility along the polymer backbone, which in turn affects the electrical properties of PANI. The XPS results show that the use of APS as an oxidizing agent leads to the formation of the emeraldine (the best [oxidizing agent]/[aniline] ratio being 0.5), while a pernigraniline form arises from the use of K2Cr2O7. After 500 cycles of the electrode potential cycling, the synthesized PANI using the ammonium persulfate (APS) as the oxidizing agent and HCl as the doping acid has a stable electrode potential of −0.5 V vs RHE at the current density of −10 mA cm−2 for a Tafel slope of ca. 120 mV dec−1. The present study contributes to advances in the use of polyaniline, as an emerging conductive polymer for the design of cost-effective electrode materials for electrochemical energy conversion and storage applications. Specifically, it paves pathways for the development of efficient nanocatalysts for the electrocatalysis, whereby noble metal-free elements could be embedded in a matrix of an optimized conducting polymer to yield nitrogen and metals doped carbon nanostructured networks.
Acknowledgments
D. Razik gratefully acknowledges the financial support from Campus France for his stay at IEM Montpellier through the program PROFAS B+ of "algéro-français cooperation." This work at IEM Montpellier was supported by the CNRS Energy unit through the project "PEPS19-ELECTROFUEL."