
Abstract
Charge heterogeneity is a prevalent feature in many electrochemical systems. In a commercial cathode of Li-ion batteries, the composite is hierarchically structured across multiple length scales including the sub-micron single-crystal primary-particle domains up to the macroscopic particle ensembles. The redox kinetics of charge transfer and mass transport strongly couples with mechanical stresses. This interplay catalyzes substantial heterogeneity in the charge (re)distribution, stresses, and mechanical damage in the composite electrode during charging and discharging. We assess the heterogeneous electrochemistry and mechanics in a LiNixMnyCozO2 (NMC) cathode using a fully coupled electro-chemo-mechanics model at the cell level. A microstructure-resolved model is constructed based on the synchrotron X-ray tomography data. We calculate the stress field in the composite and then quantitatively evaluate the kinetics of surface charge transfer and Li transport biased by mechanical stresses. We further model the cyclic behavior of the cell. The repetitive deformation of the active particles and the weakening of the interfacial strength cause gradual increase of the interfacial debonding. The mechanical damage impedes electron transfer, incurs more charge heterogeneity, and results in the capacity degradation in batteries over cycles.
Export citation and abstract BibTeX RIS
Redox heterogeneity and mechanical degradation are two major issues impeding the performance and lifetime of the current battery technologies.1–15 These two issues are often studied separately—the charge heterogeneity is a result of subtle variation of the local chemical environment at the atomic scale (e.g., point/line defects, metal-oxygen complex) which drastically alters the redox kinetics across a wide range of length scales, for instance, when defects present, the altered local bonding environment in the single crystal domains can trap Li or facilitate Li transport;1–3 the morphological defects such as twinning and grain boundaries at mesoscale may result in charge heterogeneity that is thermodynamically stable and persist in a long-term operation.4–7 The spatial arrangement of the multiple constituents in the composite electrode further induces different Li activities and different degrees of the particle utilization.8 In parallel, mechanical and structural disintegration is now recognized as a critical issue limiting the large-scale implementation of high-capacity batteries.10–15 Inherent to the reversible Li insertion and extraction is the deformation of electrode materials with a volumetric strain ranging from a few percentages (graphite, layered/spinel/olivine oxides) to a few hundred percentages in the materials of ever-increasing energy density (Si).16–18 The mechanical stresses cause fracture, fatigue, and structural decohesion of electrodes which impede electron conduction and increase the electric and thermal resistances. Furthermore, mechanical deformation of the electrodes interferes with the stability of solid-electrolyte interphase (SEI), which results in a persistent decrease of cycling efficiency and progressive fade of batteries. Despite the steady progress in the battery technology, the understanding of the redox heterogeneity and mechanical aging mechanisms grow at a much slower pace, mostly due to the intrinsic complexity in batteries of local lattice dynamics, phase evolution, structural/compositional heterogeneity, and sensitivity on the environment (air, temperature) and operation (cycling rate, charge protocol, and depth of discharge) conditions.
Bridging the redox kinetics and mechanics is an imperative task to understand the holistic behavior of batteries. On the one side, chemomechanics theories accounting for the intimate coupling of the electrochemical processes and the elements of mechanics, such as large deformation, stress, plasticity, fracture, and fatigue, need to be established. On the other side, computational modeling with an implementation of the constitutive relationships and input of realistic microscopic models are required to predict the spatiotemporal reaction kinetics and mechanical failure of batteries. From the theoretical point of view, while mechanical degradation modulated by Li reactions has been seen as a norm, much less understood is the impact of stresses on the kinetics of mass transport, charge transfer, interfacial reactions, and hence the potential, capacity, and cyclic efficiency of batteries at the system level. Figure 1 outlines a framework considering the interplay between mechanics, mass transport, and interfacial redox reactions to address the chemomechanical degradation in batteries. Li transport through diffusion into an electrode material is accompanied by a change of volume. This volumetric change may induce stresses if the deformation is constrained. Constraints may be geometric (e.g., a thin film electrode bonded to a substrate), or may result from an inhomogeneous charge distribution (and hence inhomogeneous lattice strains) within the host, or is due to the mechanical interactions among the constituents (e.g., active particles and conductive matrix) in the composite electrode. Meanwhile, locally generated stresses due to the strain mismatch modify the energy cost associated with further insertion of Li. The stress changes the chemical potential of Li in the host whose gradient drives diffusion. The continuum models coupling deformation to diffusion of atoms in a solid solution are now standard in literature.19–23 Theories that account for large deformation and inelasticity of the electrode appeared more recently.24 In addition to the effect on Li diffusion, mechanical stresses influence the electrical response of electrode materials as well. For instance, an early work showed that a compressive stress leads to a higher overpotential and a lower saturation capacity at the cut-off voltage during galvanostatic operations.25 Stress has a similar effect of electrical overpotential and modulates the driving force of charge transfer at the electrode surface. Recent work modified the Butler-Volmer equation by incorporating the stress effect into the free energy and activation energy for the surface charge transfer process.26–28
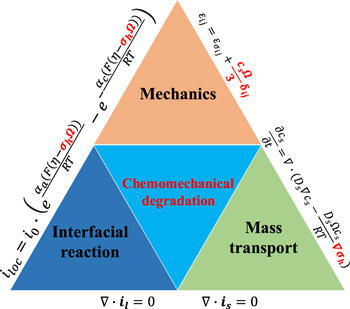
Figure 1. Overview of chemomechanical degradation in battery materials as a result of the interplay between mechanics, mass transport, and interfacial redox reactions. The electrochemical processes of Li diffusion and charge transfer modulate the deformation and damage of electrodes, likewise, the mechanical stress regulates the kinetics of diffusion and interfacial reaction and impacts the polarization, voltage, capacity, and cyclic efficiency of the electrochemical system.
Download figure:
Standard image High-resolution imageComputational modeling is a common practice to solve the nonlinear and strongly-coupled equations of surface charge transfer, Li diffusion, and mechanical stresses. In terms of the geometric complexity of the model, numerical modeling of batteries in literature may be roughly categorized into three length scales—single particles, composite electrodes, and cells. Early work of single-particle active materials started from Christensen and Newman29 who studied the effect of mechanical stresses on Li diffusion in a free-standing spherical particle. Refined work since then has been reported incorporating other relevant mechanisms such as the effects of large deformation,30,31 particle size and shape,32 phase transformation,33,34 plasticity,24 and varying material properties.35 The single-particle/phase models can provide an understanding of the first-order effect of stress in regulating the Li transport and surface charge transfer, but the model is apparently oversimplified and cannot capture the electrochemical response and the mechanics field in real composite electrodes. To overcome the shortcoming, reconstruction of composite models consisting of multiple particles and phases became a natural choice. For example, Ji et al.36 built a 2D multiscale model of porous electrode and studied the relationship between the size polydispersity and stress distribution. Wang et al.37 constructed a model of two contacted spherical particles and examined the stress evolution at the contact points and at the binder/particle interface. Xu et al.38 employed a reconstructed 3D model to look into the mechanical interactions among the particles and between the active particles and the conductive matrix. They concluded that the mechanical constraint provided by the matrix and the contact between active particles could lead to substantial capacity loss. Mendoza et al.39 resolved the microstructure of the LiCoO2 cathode and studied in detail the stress generation and the influence brought by the microstructural features and the charging rate. The abovementioned composite models are more relevant to the commercial batteries, in which both the cathode and anode are composites of high heterogeneity at the microscale, consisting of active particles of different sizes and irregular shapes, a matrix composed of polymer binders and additives, and pores filled with the electrolyte. The results unambiguously revealed that the stress field and charge distribution are strongly affected by the local details of the microstructure and the mechanical interactions of the different components in the electrodes. One note worth pointing out is that the Neumann and the Dirichlet boundary conditions are often prescribed on the electrode-electrolyte interface to simulate the galvanostatic and potentiostatic processes, respectively, and different locations of the interface are assumed to experience the same current density. This treatment benefits the computational efficiency but has entirely ignored the inhomogeneity of charge transfer at different local sites. The cell-level model is an extension of the composite electrode by including a counter electrode, a porous electrode soaked with liquid electrolyte, and a separator. A set of governing equations describing the electric potential in the conductive matrix and in the electrolyte, the overpotential and charge transfer at the electrode-electrolyte interface, Li transport inside the active particles, and mechanical stresses are considered. A mechanics field is induced when Li-ions are inserted into or extracted from the active materials. The volumetric deformation generates a field of stresses and subsequent mechanical degradation in the electrode. The coupled electro-chemo-mechanics theory was first implemented in homogeneous pseudo-2D (P2D) models which consider two separate length scales: 1D in the thickness direction for the electron and Li transports, while the active material to accommodate Li insertion is treated as spherical particles. For example, Garcia et al.40 developed a 2D resolved model which obtained the spatial variation of the electrochemical field and stresses. Chung et al.41 studied the effect of the particle size polydispersity on the electrochemical response in a 3D resolved model and found that the power density of batteries is highly dependent on the particle size distribution. Wu et al. investigated the potential drop at different charging rates in NMC42 and LiCoO243 using more realistic 3D microstructures based on X-ray tomography data. It is challenging to model the fully coupled mechanics and electrochemistry in a real and complex geometry of composite electrodes. Recent advance in 3D tomography reconstruction techniques, such as X-ray nano-tomographic and transmission microscopy, makes it possible to reconstruct the microstructure of commercial electrodes with sufficient nanoscale details. In a recent work,44 we combined the advanced 3D tomographic visualization and the microstructure-resolved modeling to study the heterogeneous electrochemistry, stress, fracture, and interfacial debonding in a commercial electrode. We found that the charge distribution and mechanical damage are depth dependent in the thickness direction of the composite electrode—the particles near the separator experience deeper charge and discharge and therefore are subject to more severe mechanical damage than the particles near the current collector. Such spatial heterogeneity in the state of charge and stresses originates from the polarization of the electrolyte potential in the composite electrode and results in the non-uniform utilization of the active materials and deterioration of the deliverable capacity of batteries.
This paper focuses on the heterogeneity of charge distribution, stress, and interfacial damage in a half-cell model over multiple cycles. We take the same strategy in the prior work of implementing the 3D microstructure-resolved NMC composite model from the synchrotron X-ray nano-tomography. The morphological mapping of a LiNi0.6Mn0.2Co0.2O2 (NMC622, NMC for short throughout the paper) cathode was conducted by an ID16A-NI nano-imaging beamline in the European Synchrotron Radiation Facility (ESRF) in France. This beamline offers a unique combination of nanofocus (∼20 nm) and a high photon flux which enables nano-tomography detection with a high energy of 17 keV as well as a large field of view with 100 nm and 70 nm voxel size. More details on the synchrotron analytics and the morphological features of the NMC electrode can be found in our previous report.8 In this work, we construct a representative volume element (RVE) to contain the statistical features of the macroscopic particle ensembles. Firstly, we outline the theoretical framework of the fully coupled electro-chemo-mechanics model which accounts for the stress effect on surface charge transfer and diffusion kinetics. Secondly, we quantitatively assess the effect of mechanical stresses on the surface charge transfer, Li distribution, voltage response, and capacity of batteries. Finally,we proceed to model the interfacial debonding of the active NMC particles from the conductive matrix over cycles using a reduced model. We evaluate the consequence of the mechanical damage in the performance metrics of batteries including the increase of the electrochemical impedance, the charge redistribution, the elevated polarization in the voltage response, and the progressive decay of the deliverable capacity.
The Electro-chemo-mechanics Model
We simulate the working condition of a half-cell consisting of a separator and an NMC composite cathode both soaked with liquid electrolyte, a Li anode, and a current collector on the cathode side. We employ a fully coupled electro-chemo-mechanics theory which describes the electrochemistry of the kinetics of electron and ion transports in different components of the electrode, mechanics of the deformation kinematics and stresses of the composite, and the coupling of the stress effect on Li diffusion and charge transfer reactions. This theory forms a foundation of the computational modeling.
Electrochemistry
Figure 2 shows the typical microstructural of a commercial NMC cathode and the sketch of the half-cell model. The microstructure of NMC (Fig. 2a) was imaged using a scanning electron microscopy (SEM, T330, JEOL). Figure 2b shows the cross-section of the NMC cathode after mechanical polishing (EcoMet 3000, Buehler). Grit sizes of 3 and 1 μm were used for the initial polishing and then 0.05 μm colloidal silica suspension was used for final polishing until a mirror-like finish was obtained.45,46 The active particles are embedded in the porous matrix of carbon additives and polymeric binders. Upon charging, Fig. 2c, Li extracts from the NMC lattice and splits into Li-ions and electrons governed by the charge transfer kinetics on the particle surface. Electrons flow through the conductive carbon-binder network to the cathode current collector, and transport to the anode side through the external circuit. To maintain electroneutrality, Li-ions diffuse through the electrolyte in the pore space of electrodes and separator and reach the anode side to neutralize the electrons. The above processes are reversed if the cell is under discharging. The electrochemical processes were well described by the theoretical framework of Doyle et al.47 In our model, we use the subscript s and l to denote the solid active cathode particles and the liquid electrolyte, respectively, to distinguish the different domains.
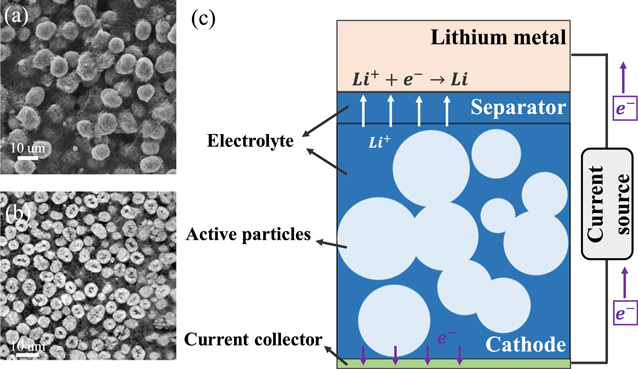
Figure 2. Microstructural features of a commercial NMC cathode and schematic of a half-cell battery model. (a) and (b) are the top and cross-sectional views of the composite NMC cathode, respectively. (c) illustrates the computational model and the working principle of the half-cell during discharging.
Download figure:
Standard image High-resolution imageElectrolyte
Li-ion transport in the electrolyte follows the mass conservation:

where  is Li-ion concentration in the electrolyte,
  is the Li-ion flux including the contributions of both diffusion and migration:

where  represents the Li-ion diffusivity in the electrolyte,
  the electrolyte current density,
  the transference number of cations, and
  the Faraday's constant. The electrolyte current density was derived by the prior work.44
where  is the electrolyte conductivity,
  the electric potential in the electrolyte,
  the gas constant,
  the temperature, and
  the mean molar activity coefficient of the electrolyte. The conservation of charge requires

Active particles and conductive matrix
Li concentration within the active particle,  is determined by

The flux of Li,  is given by

where  is the mobility of Li, and
  is the chemical potential of Li in the host. When the stress effect on the chemical potential is taken into consideration, the chemical potential of Li is written as:19–23
where  is a reference value,
  the maximum Li concentration in the active materials,
  the partial molar volume of Li in the host, and
  the hydrostatic stress. Substituting Eq. 7 into 6, Eq. 5 can be rewritten as follows with a definition
  as the diffusion coefficient,
The electric current density in particle and matrix follows the Ohm's law:

where  is the electrode conductivity and
  is the potential in the composite electrode. Due to the charge balance, the electrode current density follows

Electrode-electrolyte interface
The charge transfer kinetics occurs at the interface between the electrolyte and the active materials and generates the local current. The local current density,  is often described by the Butler-Volmer equation:
where  represents the anodic transfer coefficient,
  the cathodic transfer coefficient, and
  the concentration-dependent exchange current density given by
where  is the reference Li-ion concentration in the electrolyte,
  the Li concentration at the electrode surface, and
  and
and  are the rate constants for the anodic and cathodic reactions, respectively. The charge transfer rate is related with the overpotential
  which is defined as:26–28
where  is the equilibrium potential for Li reaction in the active material. The hydrostatic stress
  is expressed as
  The last term in Eq. 13 includes the stress effect on the charge transfer reaction which accounts for the shift of the equilibrium potential by stresses.
Mechanics
Mechanical deformation is induced when Li-ions are inserted into or extracted from the active materials. The inhomogeneity of Li distribution and the mechanical interactions between the active particles and the conductive matrix generate stresses and cause subsequent mechanical degradation in the cell. The diffusion induced stresses are calculated using an analogy to thermal stresses.48,49 The continuum media of the conductive matrix, containing carbon blacks, polymeric binders, and pores, is treated as a linear elastic material with an elastic modulus of 4 GPa.46 In the domain of active particles, the total strain ε includes the elastic strain εe and Li-concentration induced strain εd:

The diffusion induced strain  can be written as:

where  is the concentration change of Li relative to the initial stress-free state. The deformation kinematics assumes an isotropic expansion in each direction upon Li reactions. This assumption is not correct to treat the deformation in a single crystal of layered cathode such as NMC. Nevertheless, the isotropic assumption is not entirely unreasonable to calculate the strain in the granular NMC secondary particles which are composed of agglomerates of primary particles. The constitutive equation describing the stress-strain relationship is given by:

where  is the stiffness matrix. For linear elastic materials, the stiffness matrix is reduced to two independent elastic constants—the elastic modulus and Poisson's ratio as listed in Table I. The stress field is governed by the equation of momentum equilibrium:

Table I. Parameters used in the computational modeling.
| Parameter | Value | Parameter | Value |
|---|---|---|---|
 (S·m−1) (S·m−1) |
104 50 |
 (V) (V) |
4.43–2.78y+8.17y2 + 9.84 y3−214.51y4 + 777.77y5−1290.62y6 + 1034.38y7−324.15y8, y =  / /
|
 (S·m−1) (S·m−1) |
1.147 51 | ||
| R (J·mol−1·K−1) | 8.314 |
 (m2·s−1) (m2·s−1) |
1 × 10⁻¹⁰ 51 |
| T (K) | 293 |
 (m2·s−1) (m2·s−1) |
7 × 10⁻¹⁵ 52 |
| F (A·s·mol−1) | 96485 |
 ( ( ) ) |
8297 |
| t+ | 0.363 51 | E (GPa) | 140 (NMC particles); 4 (Conductive matrix) 46 |
∂lnf /∂ln 
|
0.43 50 | ||
| kc (m·s−1) | 2 × 10⁻¹¹ 53 | υ | 0.3 46 |
| ka (m·s−1) | 2 × 10⁻¹¹ 53 | Ω (m3·mol−1) | 1.84 × 10⁻⁶ |

|
0.5 53 |
 (N·m−2) (N·m−2) |
2 × 10¹⁵ 44 |

|
0.97 54 |
 (N·m−2) (N·m−2) |
0.375 × 10¹⁵ |

|
0 54 |
 (Ω· m2) (Ω· m2) |
2 × 10⁻³ 44 |
 (mol·m−3) (mol·m−3) |
49000 54 |
 (nm) (nm) |
10 44 |
 (mol·m−3) (mol·m−3) |
1 |
 (F·m2) (F·m2) |
0.2 55 |
 (mol·m−3) (mol·m−3) |
1000 |
 (1) (1) |
0.5 |
Results and Discussion: Stress-biased Electrochemical Responses
3D model reconstruction
We take the approach of 3D representative volume element, Fig. 3, to examine the bias of mechanical stresses to the electrochemical responses in terms of the cell potential, surface overpotential, Li distribution, and cell capacity. The RVE model is based on the 3D X-ray phase contrast tomography data of NMC provided by Yang et al.8 as shown in Fig. 3a. The RVE maintains the primary morphological features of the original NMC cathode, which include the particle size polydispersity, particle spatial distribution, and inter-particle contact. We use the software Avizo to label the active NMC particles and then output the coordinate and size information of each particle. 1015 particles are distinguished in the tomography data in Fig. 3a. These data are set as the reference for selecting the representative volume element. Then, a RVE containing 22 particles (Fig. 3b) is selected and built as a Standard Tessellation Language (STL) data which can be imported into COMSOL. The RVE is incorporated into a half-cell configuration. Figure 3c shows the meshed geometry of the particles. We use statistical analysis to compare the RVE and the original NMC composite to ensure that the RVE is truly representative to the microscopic features of the cathode. Figures 3d, 3e, and 3f show the probability distribution functions of the particle diameter, the distance (surface to surface) of the nearest neighbors, and the average and standard deviation of the distance from the 1st, 2nd, and 3rd neighbors for individual particles, respectively.
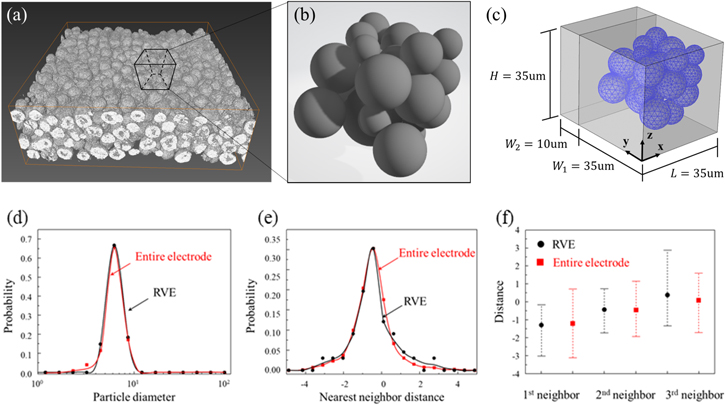
Figure 3. Model reconstruction and the statistical features. (a) 3D rendering of the nano-tomography data of an arbitrarily selected region (120 × 120 × 40 μm) in NMC. (b) The RVE extracted from the NMC composite. (c) The model for finite element simulation. (d)–(f) Statistical analysis of the RVE (black) in comparison with the reconstructed entire NMC electrode (red) in terms of the (d) particle size distribution, (e) probability distribution of the nearest neighbor distance for individual particles, and (f) average and standard deviation of the 1st, 2nd, and 3rd neighbor distances for individual particles.
Download figure:
Standard image High-resolution imageIn the modeling, the empty space of the RVE is filled with a homogenized matrix which consists of the electrolyte and the carbon-binder matrix. Considering that the matrix is impermeable for Li-ions, only the electron transport is considered in the carbon-binder matrix. Furthermore, since the liquid electrolyte is insulating for electrons, only Li-ion transport is allowed in the electrolyte. The electrolyte and the conductive matrix can be treated as a superimposed continuum. In this case, the mass balance of Li-ions in the electrolyte component of the homogenized matrix (Eq. 1) should be modified as,

where  is the volume fraction of electrolyte in the homogenized matrix (i.e. porosity of the matrix). In the NMC electrode in Fig. 3a and the reconstructed RVE in Fig. 3b, the volume fractions of active particles, the liquid electrolyte, and the carbon-binder matrix are about 40%, 30%, and 30%, respectively, resulting in the porosity of the homogenized matrix
  being 0.5. The pure phase transport properties including the matrix conductivity
  the electrolyte conductivity
  and the ionic diffusivity in the electrolyte
  should be replaced by the effective transport properties in the homogenized matrix. The Bruggeman relationship56 is employed to evaluate the effective transport properties,

Boundary conditions
We incorporate the reconstructed RVE model into a half-cell configuration (Fig. 3c) for modeling the electrochemistry and mechanics fields. Due to the high electric conductivity of Li metal, the thickness of Li metal anode has a negligible impact on the cell voltage and polarization, and thus is set as zero. To simulate the galvanostatic charging and discharging, a constant current is applied at the cathode current collector side and its magnitude is determined by the specific cyclic rate. In the charging process, the following boundary conditions for 

 and
and  are prescribed at the interface between the electrolyte and active particles:

where the unit normal vector  points from the electrolyte/matrix to the active particles.
The insulation and zero-flux boundary condition is applied at  and
and  in Fig. 3c:

where the unit normal vector  points outward of the model.
The current collector contacts with NMC electrode ( ), the boundary conditions are prescribed by:

where the unit normal vector  points from the electrode to the current collector.
  represents the applied current density when the cell is under galvanostatic charging/discharging. It corresponds to the macroscopic current density applied on the current collector in experiments. During charging,
  The value of
  is set by:

where  and
and  are the maximum and minimum states of charge in the electrode, respectively,
  the electrode volume, and
  the C rate which represents that the cell takes
  hour to fully charge or discharge.
For the Li metal surface ( ), the boundary conditions are given by:

where the unit normal vector  points from the Li metal to the cathode.
  is the current density on the anode side, which is equal to
  due to the conservation of electrons on the cathode and anode sides.
When we calculate the mechanical stress, fixed displacement boundary conditions are applied at  and
and  in Fig. 3c.
Results
The half-cell model is implemented into COMSOL Multiphysics (Version 5.3). The built-in time-dependent solver MUMPS (Multifrontal Massively Parallel sparse direct Solver) is used to solve the weak forms of the nonlinear and coupled electrochemistry and mechanics equations as outlined above. We first model a cycle of charging and discharge of the cell to explore the effects of stresses on the voltage profiles, overpotential, and equilibrium potential at the particle surfaces at two different charging rates. A positive current density  is applied to the current collector during charging until the cell potential reaches 4.3 V. Then, the applied current density is reversed in sign upon discharging until the cell potential drops to 3.0 V. To make a quantitative assessment of the stress effect, we compare the simulation results of the fully coupled electro-chemo-mechanics model against the reference output without considering the stress effects on Li diffusion (Eq. 8) and the surface charge transfer (Eq. 13). The parameters used in the simulation are listed in the Table I.
Figure 4a shows the cell potential profiles under the charging rates 1 C and 5 C. The x-axis is plotted by a normalized time  where
where  is the Li reaction time and
  is the theoretical time for NMC to reach the fully charged/discharged capacity. Under the charging rates 1 C and 5 C, the values of
  are 3600 s and 720 s, respectively. The solid and dashed lines represent the results with and without considering the stress effects. It is clear that stress plays a significant role in modifying the cell potential response. In the case where the stress effect is not considered, the cell potential increases and decreases faster, leading to a shorter potential plateau and a lower yield capacity. This effect is magnified at a higher C-rate. To understand this phenomenon, we first look into the bias of mechanical stresses on the surface overpotential
  as defined in Eq. 13. We select a point at the surface of an NMC particle and plot the evolution of
  during charging in Fig. 4b. The overpotential remains a positive value, slowly decreases over time and drops to zero at the cutoff voltage. The stress at the particle surface modifies the overpotential, nevertheless, the difference caused by stresses (∼3 mV and ∼5 mV for 1 C and 5 C, respectively) is rather small compared to the magnitude of the electrochemical overpotential (∼40 mV and ∼80 mV for 1 C and 5 C, respectively). To isolate the stress effects on Li diffusion and the surface charge transfer, we turn off the stress regulation on Li diffusion (not considering the stress term in Eq. 8) but only consider the stress bias on the overpotential, and then plot the cell potential profiles in Fig. 4c for the two charging rates. Not surprisingly, the stress on the particle surface only changes the voltage profiles very minorly. Albeit small, it may be interesting to observe an opposite trend of the stress-regulation in the voltage profiles at the two charging rates. At the slow charging (black lines in Fig. 4c), the model including the stress effect reaches the cutoff voltage earlier and gives a relatively smaller capacity than the stress-free model. This trend is reversed at the high charging rate (red lines in Fig. 4c). When the NMC particles are subject to charging (Li extraction), a tensile stress is developed at the surface of the particles because of the depletion of Li. In the writing of the overpotential,
  a tensile hydrostatic stress decreases the overpotential for the charge transfer reaction. For a slow charging, the redox reaction at the interface between the electrode and the electrolyte is relatively slow and therefore the Li source at the interface is sufficient. The deliverable capacity of the cell is essentially determined by the interfacial reaction. Because of the fixed applied current density, the overall reaction rates for the models with and without the stress effect are about the same. To maintain this overall reaction rate, the electric potential in the stress-coupled model would increase to compensate the decrease of the overpotential caused by stresses. Therefore, the cell potential in this scenario would reach the cutoff potential earlier. On the other side, when the cell undergoes a fast charging, Li on the particle surface is depleted faster. The retarding effect of stress on the surface charge transfer will in fact increase the Li concentration on the particle surface compared to the stress-free model. As a result, the equilibrium potential
  decreases much slower during charging when stress is included. Figure 4d shows the profiles of
  and
and  at a selected location during charging.
  is a monotonic function of the surface state of charge (SoC), which is defined as
  The inset in Fig. 4d compares the surface SoC with and without including the stress effect. The comparison confirms that the surface SoC is higher at a given charging time and therefore
  increases slower in the stress-coupled model. Figure 4d also shows the stress-biased overpotential item
  Although it increases over time, the magnitude is much smaller than the
  In the fast charging case, we can conclude that the different electrochemical response is primarily due to the shift of the equilibrium potential. Again, by comparing the results in Figs. 4a and 4c, we find that the stress effect on charge transfer reaction is not the major mechanism regulating the cell potential response. The cell capacity and potential can be slightly tuned by the stress state at the particle surfaces depending on the subtle competition between the stress-biased
  and
and  at different charging rates, but the major contribution of mechanical stresses on the electrochemical response comes from the stress-regulated ion diffusion.

Figure 4. Impact of mechanical stresses on the voltage response of the half-cell. The solid and dashed lines denote the results with and without considering the stress effect, respectively. (a) The comparison of cell potential at different charging rates in the first charging and discharging cycle. (b) The evolving overpotential at different charging rates. The stress-biased overpotential is denoted by  (c) The bias of cell potential due to the stress effect on the surface charge transfer. (d) The shift of the equilibrium potential of Li in NMC due to stresses during charging at 5 C. The inset shows the change of the state of charge at the NMC particle surfaces due to the stress.
Download figure:
Standard image High-resolution imageTo examine in detail the charge heterogeneity regulated by stresses and their mutual effects, we select an arbitrary NMC particle and plot the Li profile and the stress field during charging (Li extraction) under different C-rates in Fig. 5. The x-axis represents the normalized location x/R where x is the distance to the center of the particle and R is the radius of the particle. Here the radial direction is arbitrarily chosen within the particle. The solid and dashed lines of the same color show the results of Li profiles and the stress field with and without considering the stress effect on Li diffusion and surface charge transfer along the same radial direction in the same particle. The data are plotted at different states of charge of 3.5 V, 4.0 V, and 4.3 V. When the time scale of Li diffusion is longer than the charging time, both Li concentration and the stress field show a gradient distribution. In Figs. 5a (1 C rate) and 5c (5 C rate), Li concentration decreases over time and the region near the surface depletes Li faster. When the stress effect is included in the chemical potential of Li diffusion, Li distributes more homogenously. The stress effect is much more significant at the higher charging rate. The concentration gradient causes a mismatch of the lattice and therefore generates the intercalation stress. The equivalent (von-Mises) stress within the particle are shown in Figs. 5b and 5d. At the same state of charge, the magnitude of the stress in the stress-decoupled model (dashed lines) is always much higher than that in the stress-diffusion coupled model (solid lines). The stress and Li (charge) distribution mutually influence each other in the way that charge heterogeneity promotes the mechanical stresses, while the gradient of the stress field regulates the Li redistribution. This mutual effect is more significant when the cell is under fast charging and discharging.

Figure 5. Li and stress profiles for a spherical particle within the composite. The solid and dashed lines show the results with and without considering the stress effects on Li diffusion and surface charge transfer, respectively. (a) and (b) show the spatial distributions of Li and the Mises (equivalent) stress in a spherical particle at different cut-off potentials (CP) under 1 C charging rate. (c) and (d) show the evolving distributions of Li and the equivalent stress in the same particle charged at 5 C.
Download figure:
Standard image High-resolution imageNow we look at the charge distribution and the stress field at the scale of the composite electrode. The morphology and the microstructural details, including the particle distribution, inter-particle contact, and the interactions between the active particle and the conductive matrix, determine the Li trajectories and the stresses. The cell level model is an ideal system to examine the charge heterogeneity and stress profiles relevant to the performance of batteries. Figure 6 shows the overall features of Li concentration and the equivalent stress after a cycle of charging and discharging of the cell under 1 C rate. Li distributions within individual particles are roughly spherically symmetric because the Li profile is dominated by the diffusion process. The deviation from the perfect-spherically symmetric solution is because of the stress effect induced by the mechanical interactions between the active particles and the matrix as well as the particle contact. The results derived from the models with and without considering the stress effect are compared in Figs. 6a and 6b. The cross-sectional views of various particles of different sizes are displayed in the dotted boxes—a small particle in the upper panel and a cluster of particles in the lower panel. In the Li distributions in Fig. 6a, we show that residual Li is retained in the active particles after a complete cycle which is a major reason of the decay in the deliverable capacity. Li retention in the large particles is more significant because of the longer diffusion length. In the stress-coupled model, the stress gradient in the particles drives Li diffusion. During the charging process, the surface regime of the particles experiences a tensile stress while the core regime is subject to a compressive stress. Such stress gradient facilitates the outward flow of Li. Likewise, the local stress alters the sign during discharging and therefore the stress gradient promotes the inward Li insertion. In both cases, the stress field facilitates Li transport and reduces the charge heterogeneity as seen in Fig. 6a. When the charge distribution is less heterogeneous, the internal stress is also minimized. Figure 6b plots the field of the equivalent stresses. We see that the stresses in the stress-coupled model are smaller, more homogeneous, and less likely to reach the extreme value. Figure 7 shows the results derived from the 5 C charging condition. When a larger electrochemical driving force (overpotential) is supplied, the charge heterogeneity is much more significant. The Li profile vastly deviates from the conventional core–shell distribution in the way that, first of all, the mechanical stresses generated by the lattice mismatch and the particle-matrix interactions result in different local current densities, and second, the charging protocol influences the Li distribution within individual particles—in a large particle for instance (red box in Fig. 7a), the core regime remains of high Li concentration after the completion of charging and discharging because of the Li retention at fast charging. The residual Li can be re-activated by the stresses. In the lower panel of Fig. 7a, we see that the compressive stress at the core reduces the Li gradient and therefore promotes the Li activity in the cell cycles. The reduction of the Li heterogeneity will in turn decrease the magnitude of the stresses. One point may be worth noting in Figs. 7b and 7d is that the local contacts of the inter-particles and the particle-matrix interface can experience drastic stresses at fast charging. The solid-solid contact domains marked in Figs. 7b and 7d are always subject to larger stresses which will most likely induce mechanical failure in those areas.
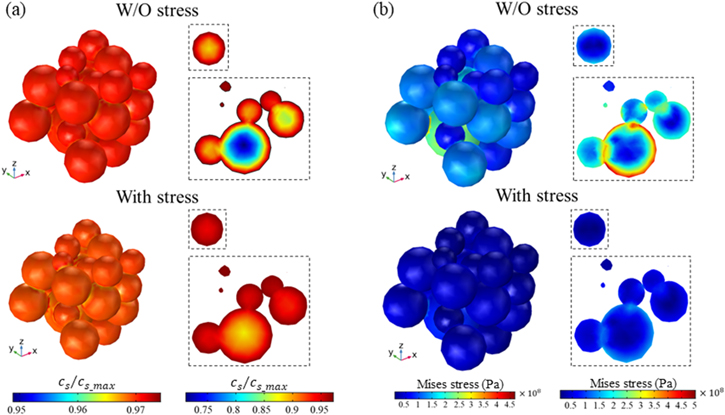
Figure 6. The spatial heterogeneity of the Li distribution and the stress field in the particle ensemble. The contour plots of Li concentration (a) and the Mises stress (b) are derived from the models with and without considering the stress effect after a charging and discharging cycle at 1 C. The perspective views in a virtual slice are shown in the dotted boxes.
Download figure:
Standard image High-resolution image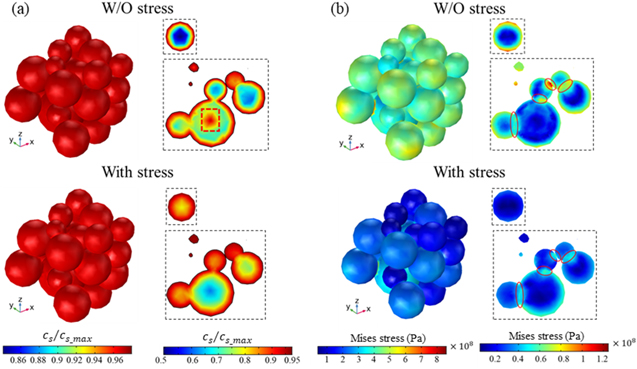
Figure 7. The spatial heterogeneity of Li and stresses in the particle ensemble charged at 5 C. Mechanical stresses promote the homogenization of Li distribution at the fast charging condition which in turn decreases the stress level in the composite. (a) and (b) show the Li concentration and the equivalent stress, respectively. Significant Li retention and stresses in large particles after a cycle are shown in the case where the stress effect is not considered. The perspective views in the dotted boxes highlight the local heterogeneity of Li (charge) distribution and stresses.
Download figure:
Standard image High-resolution imageAdditional Discussion: Cyclic Damage
Moving away from the assessment of the heterogeneity in the charge distribution and mechanical stresses in the composite electrode, we attempt to model the mechanical damage—the interfacial debonding of active particles from the conductive network—over cycles. Mechanical failure at the solid-solid interface between the NMC particles and the inactive matrix is a major mechanism of aging in batteries and is gaining extensive attention in recent studies.57,58 The loss of interfacial contact is a consequence of the mismatch strain between the active particles and the matrix. Our goal here is to quantify the electrochemical performance of batteries, in terms of charge redistribution, the electrochemical impedance, the voltage response, and capacity decay over cycles, modulated by the mechanical degradation at the interface using the fully coupled model.
Reconstruction of a reduced model of irregular-shaped particles
To reduce the computational cost, we reconstruct a reduced model containing irregular-shaped NMC particles and similar microstructural features of the 3D X-ray phase contrast tomography data. Avizo is used to directly convert the original 3D tomography data into Standard Tessellation Language (STL). The open-source tool MeshLab is used to smooth the surface of NMC particles via Laplacian smoothing filter. The reduced model has a size of 25 μm × 25 μm × 36 μm as shown in Fig. 8a. The particle ensemble is then incorporated into the half-cell configuration. Figure 8b shows the meshed geometry of the particles in the finite element modeling.
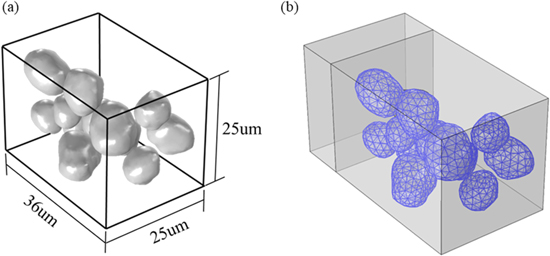
Figure 8. The particle ensemble for the computational modeling of the cyclic behavior of NMC cathode. (a) shows the size of the RVE and the irregular shape of the particles. (b) shows the meshes in the finite element modeling.
Download figure:
Standard image High-resolution imageInterfacial debonding
To model the particle detachment from the conductive matrix, we calculate the gap between the active particles and the matrix (denoted as  ) by prescribing a spring layer at the interface. The value of
  increases when the NMC particles shrink in volume during Li extraction. The stiffness of the spring is denoted as
  The exact value of
  and also the mechanical properties of the interface in general are unknown in the existing literature. However, a prior study59 demonstrated a gradual loss of the interfacial reliability in the electrodes over cycles which infers that the contact stiffness reduces its value due to the repetitive size change of the active particles during electrochemical cycles. To serve the purpose of demonstration, we have taken a simplified phenomenological model of
  which is defined as a function of cyclic number:

where  is the initial stiffness. The coefficient
  represents the rate of reduction of the stiffness over cycles, and
  is the cyclic number. This simplified model can be refined or modified when experimental data becomes available. Here we take the stiffness
  in a range of
  in the pristine state of the electrode to
  at the completion of the cyclic modeling. The goal of this modeling is not to replicate the long-term cycling of batteries, but is to demonstrate how the mechanical damage at the interface deteriorates the cell performance. Here we have only simulated 5 completed cycles which is probably sufficient to draw a qualitative correlation between the mechanical aging and capacity degradation of batteries. At the formation of the interfacial gap, the interfacial resistance increases. We take a previously adopted model to describe the interfacial resistance
  44:
44:
where  and
and  are phenomenological parameters of a reference interface resistance and a reference interfacial gap, respectively. Their values are list in the Table I. The interfacial resistance alters the driving force of surface charge transfer reaction. The overpotential drops by
  when the interfacial resistance evolves.
EIS analysis
The electrochemical impedance spectroscopy (EIS) is a powerful tool for investigation of aging processes and determining the state of health of Li-ion batteries.60–62 When a perturbation of potential of varying frequencies is applied on the electrode, the impedance response can be used to characterize the electrochemical properties. The response at the high frequency is related to the capacitance, electrochemical reactions, and local resistances, while the low-frequency response is contributed by the mass transport within the electrolyte and active particles.
To evaluate the regulation of interfacial failure on the cell performance, we conduct a series of EIS simulations to investigate the electrochemical properties after different number of cycles. The simulation is carried out by applying a perturbation of the potential of varying frequencies at the current collector in the half-cell model in Fig. 8. An electrochemical study is performed in COMSOL. The previous time-dependent variable is recast into the frequency domain, as defined as follows:
where  is the applied voltage,
  the initial value around which the perturbation takes place,
  the complex perturbation,
  the imaginary unit,
  the frequency in Hz, and t the time. The cell impedance,
  is calculated at the current collector of the cathode as follows:

where  is the complex potential,
  the normal vector at the boundary, and
  the current density.
The impedance is modeled after the cell reaches the fully charged state 4.3 V. The potential of the current collector is set as a sinusoidal perturbation around 4.3 V with a 10 mV amplitude for the frequencies varying from 10 mHz to 1 kHz.55 A double-layer capacitance  is applied at the interface between the active particles and the matrix.63 The resistance
  defined in Eq. 26 is implemented at the interface. Additional parameters used for the calculation of interfacial debonding and EIS analysis are listed in Table I.
Results
To quantify the impact of the interfacial damage on the cell performance, we first determine the interfacial distance between the NMC particles and the conductive matrix over multiple cycles, and then conduct numerical modeling of EIS experiments at the charged states. Upon charging, NMC particles shrink in the volume and therefore the interfacial gap increases. When Li re-inserts in NMC during discharging, the active particles expand in size and the interfacial gap decreases. The comparison of the interfacial gap, averaged over all the active particle surfaces, are plotted in Fig. 9a under the 1 C and 5 C charging rates. The interfacial gap reaches the peak value at the completion of charging and reduces to a value close to zero at the end of a complete cycle. The magnitude of the interfacial gap depends on the charging rate. At a relatively slow charging 1 C, the interfacial gap reaches a peak value over 60 nm. Overall the interfacial gap at 1 C is larger than that in the fast charging 5 C case. This is because a larger number of Li are inserted or extracted from the NMC particles at the slow charging and therefore the mismatch strain at the interface is more significant. Another important feature is that the change of the interfacial gap, especially under fast charging, is not reversible. This is because of the asymmetry of the charging and discharging capacities in the cell within a complete cycle. The asymmetry is induced by the charge redistribution modulated by the mechanical damage. We will discuss this aspect in more detail in next figure. The interfacial gap evolves over cycles and will eventually lead to the fade of the capacity. Here we use the Nyquist plot, a complex plot of the electrochemical impedance for a cell, to evaluate the transport properties for the short-term or long-term processes. Figure 9b shows the Nyquist plots (solid lines) simulated with and without considering the interfacial debonding in the model. All the Nyquist plots show a typical semicircle at the high frequency domain which is attributed to the charge transfer reactions, and a Warburg tail at low frequency which is due to the Li diffusion in the active particles. The transport properties for different electrochemical processes can be extracted from the Nyquist plots using an equivalent circuit model. The dashed lines represent the fitting curves using a circuit model shown in the inset of Fig. 9b, where RΩ represents the electric ohmic resistance from the electrolyte, the carbon-binder matrix, and the interface between the active and inactive materials, Rct the resistance for the surface charge transfer, Cdl the capacitance for the electric double layer, and Zw the Warburg impedance for Li diffusion in the bulk active material. Table II summarize the fitted impedance parameters for the models with and without considering the interfacial debonding. Both RΩ and Rct significantly increase when the interfacial debonding occurs over cycles. The loss of contact of the active materials to the conductive agents impedes electron transport and the charge transfer reaction. Ultimately, this interfacial degradation results in a high polarization and significant capacity loss in batteries.
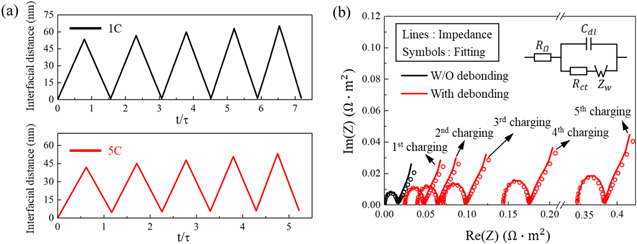
Figure 9. The evolving interfacial gap and electrochemical impedance over cycles. (a) shows the average gap between the active particles and the conductive matrix at the charging rates 1 C and 5 C. The interfacial gap at the fully charged state increases over cycles because of the weakening of the interfacial strength. (b) shows the Nyquist plot (solid lines) of the electrochemical impedance at the fully charged state 4.3 V. The impedance profile for the NMC composite without interfacial debonding is taken as a reference. The open circles represent the fitting curves using the equivalent circuit model as shown in the inset.
Download figure:
Standard image High-resolution imageTable II. Comparison of fitted EIS parameters with and without considering interfacial debonding at the fully charged states (4.3 V) in different cycles.

|

|

|

|
|
|---|---|---|---|---|
| No debonding | 0.00039 | 0.01515 | 1.69 | 0.00230 |
| Debonding/1st charging | 0.02471 | 0.02172 | 0.2036 | 0.00274 |
| 2nd charging | 0.03985 | 0.02361 | 0.1871 | 0.00292 |
| 3rd charging | 0.07099 | 0.02631 | 0.1692 | 0.00321 |
| 4th charging | 0.14360 | 0.03019 | 0.1507 | 0.00370 |
| 5th charging | 0.34520 | 0.03554 | 0.1321 | 0.00454 |
Figure 10 shows the evidence of the charge redistribution and Li retention over cycles modulated by the mechanical damage at the interface. The interfacial debonding within the composite is heterogeneous—the degree of damage depends on the local Li concentration (volumetric strain) and the stress state. Figures 10a and 10b demonstrate the Li profile in an arbitrarily selected particle at the end of each cycle. A comparison is made for the models with and without considering interfacial debonding. The particle detachment from the conductive matrix modifies the local resistance of charge transfer and therefore induces a dynamic nature of the charge/Li distribution. When the interfacial damage occurs, Li is retained within the particles at each charged state and further accumulates while the electrochemical cycle proceeds. The residual Li becomes inactive in the electrochemical process which ultimately results in a gradual downgrading of the deliverable capacity of the cell. The impact of the interfacial damage on the cell polarization, voltage response, and capacity retention is detailed in Fig. 11. The cell potential over the first few cycles is plotted in Fig. 11a. The potential responses at two charging rates 1 C and 5 C are compared. At the fast charging rate, the cell experiences more polarization and delivers less Li capacity compared to the slow charging condition. The black and red lines show the results with and without considering the interfacial debonding, respectively. When the interfacial contact between the active particles and the conductive matrix is maintained, the cyclic voltammetry reaches a steady state at the 2nd cycle due to the incomplete Li extraction/insertion in the 1st cycle. When the interfacial failure is included, the interval between each charging and discharging decreases as the cycles proceed because of the Li retention within the active particles as discussed above. The reduction of Li activity caused by the interfacial delamination results in a steady increase of the polarization and minimization of the deliverable capacity of the cell. Such effect is magnified at the high charging rate. Figure 11b plots the fade of cell capacity over cycles. The capacity ratio is calculated by the actual capacity in each charging and discharging divided by the theoretical value. The cell capacity in general drops after the first cycle because of the diffusion limited Li insertion/extraction. Consistent with the voltage profile, the cell capacity maintains a nearly constant in the following cycles when the active particles remain well contacted with the conductive agent. However, when the interfacial stability is considered in the picture, the mechanical failure becomes a determining factor of the capacity fade in battery cycles. Note that in the modeling of the cyclic behavior, we have used the fully coupled theory on stress, diffusion, and charge transfer. The result, when the interfacial debonding is not considered, shows that the stress regulation on Li/charge distribution is reversible in the cycles. It is the mechanical damage at the interface making the charge distribution, capacity, and voltage response irreversible in the cyclic process.

Figure 10. Interfacial debonding of active NMC particles from the conductive matrix impedes Li transport. (a) shows that accumulative Li is retained in the particles at the fully charged state when the electrochemical cycle proceeds. (b) shows the Li profile within NMC particles in the ideal case that the interfacial contact between the NMC particles and the matrix is maintained.
Download figure:
Standard image High-resolution image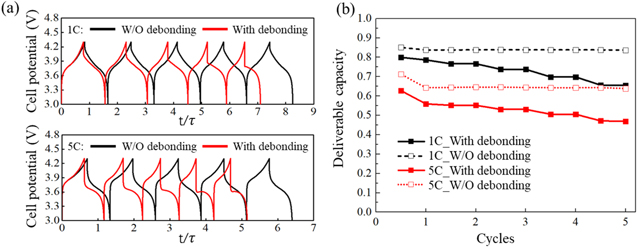
Figure 11. Interfacial debonding increases cell polarization and reduces capacity. The top and bottom panels in (a) show the influence of the interfacial debonding on the cell potential at 1 C and 5 C charging rates, respectively. (b) plots the normalized deliverable capacity over cycles at different charging rates.
Download figure:
Standard image High-resolution image
Conclusions
This paper studies the intertwining of two major issues in battery materials—charge heterogeneity and mechanical degradation—using a fully coupled electro-chemo-mechanics theory and computational modeling at the cell level. The composite electrode in commercial batteries is often hierarchically structured of multiple phases and multiple length scales ranging from the sub-micron single crystal domains to the macroscopic particle ensembles. We reconstruct a 3D microstructure-resolved composite model based on the synchrotron phase contrast nano-tomography data to include the microstructural features in large-scale electrodes. The redox kinetics in batteries invoking charge transfer and Li diffusion strongly couples with mechanical stresses. This interplay is a root cause of the spatiotemporal heterogeneity in the Li/charge distribution, stresses, and interfacial delamination in the composite electrodes during charging and discharging and over cycles. We first assess the impact of stresses on the kinetics of surface charge transfer and Li transport in an NMC cathode at different charging rates. The bias of overpotential by the stress on the particle surfaces is minor. The major contribution of mechanical stresses on the cell potential response results from the stress-regulated bulk ion diffusion. The gradient of stress in the composite promotes homogeneous distribution of Li and facilitates the rate performance of the cell. We further model the mechanical delamination at the interface between the active particles and the conductive matrix when the cell is under cyclic load. The repetitive deformation of the active particles and the steady decrease of the interfacial strength cause gradual increase of the interfacial debonding. This mechanical failure results in a dynamic and irreversible nature of Li activity in the cell over cycles. The cyclic damage incurs more charge heterogeneity, impedes charge transfer, increases Li retention within the active materials, and causes a steady fade of capacity of batteries over cycles.
Acknowledgments
We thank Dr. Yang Yang and Dr Peter Cloetens at the ESRF, Grenoble, France, for providing the hard X-ray tomography data of NMC samples. P. L. is grateful for the China Scholarship Council for a visiting scholarship at Purdue University. R. X. and K. Z. acknowledge the support by the National Science Foundation through the grants DMR-1832707 and CBET-1603866. F. L. acknowledges the support from the National Science Foundation under grant No. DMR-1832613. Use of the Stanford Synchrotron Radiation Lightsource, SLAC National Accelerator Laboratory, is supported by the U.S. Department of Energy, Office of Science, Office of Basic Energy Sciences under Contract No. DE-AC02-76SF00515.