
Abstract
Ni-rich cathodes, such as nickel cobalt aluminum oxides (NCAs, LixNi0.80+0.15εCo0.15(1−ε)Al0.05O2, 0 ≤ ε ≤ 1), are a class of cathode materials for lithium-ion batteries (LIBs), which are among the leading candidates for battery electric vehicle (BEV) applications. In this study we focus on an important, fundamental electrochemical property, the open-circuit potential function (OCP, U vs x), and investigate its relationship with the Ni stoichiometry. First, we demonstrate that published differential capacity curves (dQ/dU vs U) for Ni-rich NCA materials can be derived as a stoichiometric linear combination of differential capacities of the two end members, LixNi0.8Co0.15Al0.05O2 and LixNi0.95Al0.05O2. Subsequently, the OCP curves are obtained by taking the inverse of the integrated dQ/dU vs U curves, which match literature OCP curves. Then, we apply the same method to determine the composition of an unknown cathode extracted from a commercially available LIB. Lastly, we show that the identified relationship also holds true for the LixNi0.60+0.20εCo0.20(1−ε)Mn0.20O2 family by demonstrating that the OCP curve of LixNi0.70Co0.10Mn0.20O2 can be predicted from a fractional combination of LixNi0.60Co0.20Mn0.20O2 and LixNi0.80Mn0.20O2. We anticipate that this methodology can be adapted to predict OCP curves for additional cathode families and used to validate the chemical composition of newly synthesized materials.
Export citation and abstract BibTeX RIS

This is an open access article distributed under the terms of the Creative Commons Attribution Non-Commercial No Derivatives 4.0 License (CC BY-NC-ND, http://creativecommons.org/licenses/by-nc-nd/4.0/), which permits non-commercial reuse, distribution, and reproduction in any medium, provided the original work is not changed in any way and is properly cited. For permission for commercial reuse, please email: oa@electrochem.org.
From consumer products to the automotive industry, lithium ion batteries (LIB) are playing an ever-increasing role in the electrification of our society. In particular, the automotive industry has seen exciting growth in the demand for batteries to meet the needs of an expanding battery electric vehicle (BEV) market.1 To facilitate further improvement in BEV technology and make it attractive to all consumers, it is necessary to develop batteries with higher energy density, lower cost materials, longer calendar and cycle life, and faster charging times.2 One approach to meeting this goal is to focus on cell-level innovations and modify the electrodes' elemental composition in both the anode and the cathode.3–5
LixNi0.80Co0.15Al0.05O2 (NCA) is a cathode material composition of significant interest to the BEV market.6,7 It is known to have high energy density and moderate thermal stability,8 but one of its constituents, Co, continues to be a significant contributor to cost.9 The addition of Co is conventionally deemed necessary, due to its role in reducing the degree of Li/Ni off-stoichiometry10 and therefore, its ability to reduce the number of Ni ions impeding the diffusion of Li.11,12 Recently, however, the industry trend has been to raise Ni and lower Co content in NCA, to decrease the cost and increase the energy density of the battery, as Al has been reported to provide structural stability.5,13 As a result, a class of cathode materials with high Ni and low Co content (LixNi0.80+0.15εCo0.15(1−ε)Al0.05O2, 0 ≤ ε ≤ 1) is emerging.14,15
Effective adoption of new Ni-rich NCA cathode materials requires improved understanding of their fundamental electrochemical properties.13,16–19 One of the most important electrochemical properties is the open circuit potential (OCP) curve, which is the equilibrium potential of a material as a function of state of lithiation (U vs x scale).20–23 It is unique to the composition of a particular cathode material24 and provides one of the necessary inputs for predicting charge/discharge curves of LIBs.25,26 Our study focuses on developing an understanding of how Ni stoichiometry influences the OCP curve to identify a method for predicting OCP curves for a class of Ni-rich cathode materials. For practical purposes we will focus on the measured OCP curve in a cell with finite capacity, described on the U vs Q scale.
We start our study with the observation that as Ni stoichiometry increases in the Ni-rich NCA family, the majority of the OCP curve remains similar in shape. Noticeable exceptions, however, are the plateaus around 3.98 and 4.18 V (vs Li/Li+), which elongate as Ni content increases. Replotting the OCP curve in a dQ/dU vs U plot suggests that the charge associated with each of the two plateaus may be proportional to the Ni stoichiometry in the cathode. Based on this observation, we investigate whether the OCP curves of two known Ni-rich NCA compositions that have been previously characterized in literature5 can be represented by a fractional combination of the OCP curves of LixNi0.80Co0.15Al0.05O2 and LixNi0.95Al0.05O2 materials. Our results confirm that the curves derived from the linear combination analysis are in good agreement with the published electrochemical data,5,27 and therefore, indicate that a predictable relationship exists between the shape of the OCP curve and Ni stoichiometry in the Ni-rich NCA family. In the second part of our study, we apply the established relationship to the identification of a stoichiometric factor, ε, in a cathode with a general formula LixNi0.80+0.15εCo0.15(1−ε)Al0.05O2 and demonstrate that electrochemical characterization can be as effective in this task as inductively coupled plasma—optical emission spectrometry (ICP-OES). In the final portion of our work, we look beyond the Ni-rich NCA family and show that in LixNi0.60+0.20εCo0.20(1−ε)Mn0.20O2 cathodes with a constant Mn content of 20%, the shape of the OCP curve can be also predicted from the linear combination of the LixNi0.60Mn0.20Co0.20O2 and cobalt-free LixNi0.80Mn0.20O2 OCP curves. Based on the analysis carried out in the current study, we propose that the established relationship between the stoichiometric factor, ε, and the OCP curve may be utilized beyond LixNi0.80+0.15εCo0.15(1−ε)Al0.05O2 and LixNi0.60+0.20εCo0.20(1−ε)Mn0.20O2 families to other cathode families, which consist of materials that share the same structural transitions as a function of state of lithiation.
Experimental
OCP curves of cathode materials
The OCP curve of the standard NCA material, LixNi0.80Co0.15Al0.05O2, was characterized in-house using an electrode (90% Toda NCA, 5% Timcal C45, 5% Solvay 5130 PVDF) produced at the U.S. Department of Energy's (DOE) CAMP (Cell Analysis, Modeling and Prototyping) Facility, Argonne National Laboratory. In the experiments, coin cell cathodes were punched into electrodes of 14 mm diameter, with a loading of 8.0 mg cm−2 of active material mass. Each type 2032 coin cell (Hosen, Japan) was assembled in an argon filled glovebox (MBraun; < 1 ppm H2O and < 1 ppm O2), using 36 μl of electrolyte consisting of 1.0 M lithium perchlorate (LiClO4) in a mixture of ethylene carbonate (EC), diethyl carbonate (DEC), and fluoroethylene carbonate (FEC) (45:45:10 by weight, anhydrous, BASF, USA), a 15 mm diameter lithium metal foil (99.9% purity, 450 μm, Rockwood Lithium, USA) negative electrode, 1.5 mm stainless steel space filler (Hosen, Japan), and two layers of 18 mm diameter Celgard 2325 separators (Celgard, USA). The assembled cells were cycled in the potential range between 3.0–4.4 V (vs Li/Li+) using a battery testing system (Arbin Instruments, USA) at a slow C-rate of 0.02 h–1 (based on 85% of theoretical capacity of 278.9 mAh g−1 LixNi0.80Co0.15Al0.05O2; the C-rate is equivalent to a current of 4.7 mA/gactive-material). At least 3 cycles were performed on each cell to confirm a consistent delithiation/lithiation curve and the potential range did not induce any side reactions (Supplemental Information, SI, Fig. S1a is available online at stacks.iop.org/JES/167/040510/mmedia).
The OCP curve was approximated by averaging the 1st lithiation and 2nd delithiation curves. The use of a slow C-rate ensured that the kinetic contributions to the curves were minimal and that the gap between lithiation and delithiation branches was < 10 mV from the upper cut-off potential to 3.6 V (Fig. S1b). At potentials below 3.6 V, the rate of lithium diffusion into nickel-based cathodes is known to decrease,28 and, as a result, the redox features below 3.6 V depend on the characterization C-rate (Fig. S1c). Since our analysis relies purely on lithiation/delithiation experiments and not on a more precise method for determining the OCP curve, such as the galvanostatic intermittent titration technique (GITT),29 we limit our analysis to U > 3.6 V. An upper cutoff potential of 4.4 V was chosen to avoid any electrolyte decomposition and oxygen evolution. Additionally, we note that although redox processes can be observed in the OCP curve either as sloping features or as plateaus, it is often helpful to visualize the details of the plateaus in a dQ/dU vs U plot.30,31 Consequently, in this study, we present both the OCP curves and the dQ/dU vs U visualizations for all the relevant materials (the dQ/dU vs U curves were calculated by taking the inverse of the potential vs gravimetric capacity, U vs Q, curve and differentiating the gravimetric capacity with respect to potential).
In addition to the OCP curve of the standard NCA material, our study required the use of OCPs of LixNi0.95Al0.05O2, LixNi0.90Co0.05Al0.05O2, LixNi0.85Co0.1Al0.05O2, LixNi0.60Mn0.20Co0.20O2, LixNi0.70Mn0.20Co0.10O2, LixNi0.80Mn0.20O2, LixNi0.88Co0.09Al0.03O2, and LixNiO2. The OCPs of these materials were gathered by averaging the 1st lithiation and the 2nd delithiation curves from data available in the published literature. Table I summarizes the materials, the data source, the upper and lower cut-off potentials, and the relevant characterization C-rate/current. Additionally, the reader can refer to Fig. S1d to view a representative example, which compares the average curve to the lithiation/delithiation curve data of LixNi0.95Al0.05O2 material.
Table I. Compiled summary of the used cathode materials, the data source from literature, the upper and lower cut-off potentials, and the relevant characterization C-rate/current.
| Composition | Data Source | Vupper | Vlower | C-rate |
|---|---|---|---|---|
| LixNi0.95Al0.05O2 | Li et al.5 | 4.3 | 3.0 | ∼C/20 (10 mA g−1) |
| LixNi0.90Co0.05Al0.05O2 | Li et al.5 | 4.3 | 3.0 | ∼C/20 (10 mA g−1) |
| LixNi0.85Co0.10Al0.05O2 | Lee et al.27 | 4.3 | 3.0 | C/20 |
| LixNi0.60Co0.20Mn0.20O2 | Zhang et al.32 | 4.4 | 3.0 | C/20 (10 mA g−1) |
| LixNi0.70Co0.10Mn0.20O2 | Zhang et al.32 | 4.4 | 3.0 | C/20 (10 mA g−1) |
| LixNi0.80Mn0.20O2 | Zhang et al.32 | 4.4 | 3.0 | C/20 (10 mA g−1) |
| LixNi0.88Co0.09Al0.03O2 | Li et al.13 | 4.3 | 3.0 | C/20 (10 mA g−1) |
| LixNiO2 | Li et al.33 | 4.3 | 3.0 | ∼C/100 |
Extraction of cathode material
A cathode with an unknown stoichiometric factor, ε, from the Ni-rich NCA family (LixNi0.80+0.15εCo0.15(1−ε)Al0.05O2) was extracted from Sanyo NCR18650GA 3500mAh High Discharge Flat Top cell (Illumination Supply Inc.). In the extraction process, the NCR18650GA cell was first cycled at a C-rate of 1/15 h−1 (based on a 3.5 Ah batch capacity, resulting in a current of 0.3 A) for 3 cycles between 4.2 and 2.5 V using a potentiostat (VMP-300, Bio-Logic SAS, France) and then held at a constant potential of 2.5 V until the current decreased to 0.035 A. The discharged cell was then introduced into an argon filled glovebox (MBraun; < 0.3 ppm H2O and < 0.3 ppm O2), where it was carefully disassembled using ceramic tools to ensure minimal shorting of the cell. During the disassembly, 100 μl of dimethyl carbonate (DMC, anhydrous, > 99%, Sigma-Aldrich) was pipetted to wet the electrodes and allow for easier extraction of the materials. Once the plastic and metal casings were removed, the cathode coating was carefully separated from the other battery components. Then, one of its sides was cleaned using N-Methyl-2-pyrrolidone (NMP, anhydrous, 99.5%, Sigma-Aldrich) solvent to expose the current collector.
Electrochemical characterization
The resulting one-sided cathode coating was punched into electrodes of 14 mm diameter, with a loading of 27 mg cm−2 of total electrode mass. The punched electrodes were used to prepare coin cells in the same manner as was reported for NCA electrodes. The coin cells were cycled between 3.0 V and 4.4 V using a battery testing system (Arbin Instruments, USA) and a slow C-rate of 0.02 h–1 (based on an areal capacity of 4.67 mAh cm−2 calculated from the total cathode area, which was measured during the extraction process; the selected C-rate is equivalent to a current of 4.0 mA/gtotal-mass).
SEM/EDS of cathode materials
Prior to performing SEM/EDS analysis, the extracted one-sided cathode material was rinsed with excess DMC in the argon filled glovebox (MBraun; < 1 ppm H2O and < 1 ppm O2), then left under vacuum overnight to remove any remaining solvent. Then, both the extracted cathode and the standard NCA material (CAMP) were individually loaded onto a clip holder (Ted Pella, USA) and analyzed using a field emission scanning electron microscope (FESEM, JSM-7200F JEOL, Japan) with an energy-dispersive X-ray spectroscopy (EDS, X-MaxN, Oxford Instruments, UK) detector using 10 keV and 10 A probe current. The Al Kα1, Ni Kβ1, Co Kα1, were used to distinguish the EDS spectral peaks. To improve the sampling, 10 EDS spectra were analyzed, and the resulting atomic percentages were averaged.
ICP-OES of cathode materials
To perform inductively coupled plasma—optical emission spectroscopy (ICP-OES) analysis, both the extracted cathode and the standard NCA material (CAMP) were soaked in NMP solvent for 12 h and then carefully scraped from the current collector. The resulting powders suspended in NMP were then dried on a hot plate at 70 °C for 2 h. Approximately 125–150 mg of each dried powder was weighed into a quartz vessel and transferred into a box furnace to burn off carbon and other organic compounds. Samples were heated with a 10 °C min−1 rate to 250 °C, 500 °C, and 700 °C. The temperature was held for 2 h at each step. After cooling, the powders were transferred into a Pyrex glass beaker; a squirt of deionized water, 3 ml of conc. hydrochloric acid (HCl, trace metal grade, 35–38 wt%, Fischer Scientific) and 2 ml of conc. nitric acid (HNO3, trace metal grade, 65–70 wt%, Fischer Scientific) were added. The samples were then brought inside a fumehood and heated on a hot plate at 250 °C until they were fully digested. The resulting solutions were transferred into volumetric flasks and diluted with deionized water to an appropriate range and subsequently analyzed via ICP-OES (iCAP 7400 Radial, Thermo Fischer Scientific, USA) with radial plasma viewing. Quantification was performed using external six-point calibration (R2 > 0.9999) with multi element standards ranging from 1, 2, 5, 10, 30, and 60 μg ml−1 in a 5% v/v HNO3 matrix (Inorganic Ventures, USA) and using 10 μg ml−1 Yttrium (Inorganic Ventures, USA) in 5% v/v HNO3 as an internal standard. Operating conditions for the ICP-OES measurements were radio-frequency (RF) power of 1150 W, nebulizer gas flow of 0.62 l min−1, coolant gas flow of 12 l min−1, and the auxiliary gas flow of 0.5 l min−1.
Results and Discussion
Relationship between Ni stoichiometry and the OCP curve in Ni-rich NCAs
Due to growing interest in lowering the Co content in the NCA cathode family (LixNi0.80+0.15εCo0.15(1−ε)Al0.05O2, 0 ≤ ε ≤ 1), there exists detailed electrochemical data on several Ni-rich members of this group. Fig. 1a compares the OCP curve of the standard NCA material, which was characterized as part of the study, to the OCP curves of LixNi0.85Co0.10Al0.05O2, LixNi0.90Co0.05Al0.05O2, and LixNi0.95Al0.05O2 materials determined from literature lithiation/delithiation curves.5,27 From the figure, it is clear that the curves have similar shapes, which makes it difficult to identify a trend as a function of increasing Ni content. Alternatively, when the OCP curves are visualized using a dQ/dU vs U plot (Fig. 1b), a clear trend emerges between the increasing Ni content in the cathode materials and the size of the peaks at 3.98 and 4.18 V, which have been linked to Ni redox in literature.11,34,35 From this observation, we hypothesize that a predictable relationship may exist between Ni stoichiometry and the OCP curve. In particular, the large peak heights associated with LixNi0.95Al0.05O2 and the small peak heights associated with LixNi0.80Co0.15Al0.05O2 suggest that a fractional combination of these two materials in the dQ/dU vs U space could be used to predict the dQ/dU vs U curves as well as the associated OCP curves for LixNi0.85Co0.10Al0.05O2 and LixNi0.90Co0.05Al0.05O2 materials. Such combination of differential capacities vs potential for two or more cathode materials has been previously shown to be an effective method for predicting OCP curves of physical mixtures of distinct components,20,36,37 as described in Eq. 1 (where capacity is directly correlated to the lithium insertion in a constituent i and ε is the scaling factor for each constituent in the mixture), but has not yet been applied to the prediction of OCP curves within a particular family of cathode materials.


Figure 1. (a) OCP curves for LixNi0.95Al0.05O2 (Li et al.),5 LixNi0.90Co0.05Al0.05O2 (Li et al.),5 LixNi0.85Co0.10Al0.05O2 (Lee et al.),27 and LixNi0.80Co0.15Al0.05O2 on the gravimetric capacity scale. (b) The same data as in (a) visualized using the dQ/dU vs U plot.
Download figure:
Standard image High-resolution imageWhen extended to the Ni-rich NCA family, Eq. 1 can be rewritten as Eq. 2 (where ε is a stoichiometric factor):
To determine the stoichiometric factor, ε, for a desired Ni content in a cathode material Eq. 3 can be used:

Taking the LixNi0.85Co0.10Al0.05O2 material as an example, the stoichiometric factor, ε, is determined to be 1/3. It is then implemented in Eq. 2 to generate the predicted dQ/dU vs U curve for this material in the 3.6 to 4.3 V range (please note that prediction is not extended below 3.6 V since the rate of lithium diffusion into nickel-based cathodes is known to decrease at potentials below this value, necessitating a more precise determination of the starting OCP curves, as discussed in the experimental section). The result is plotted in Fig. 2a (green), where it is compared to the dQ/dU vs U plots of LixNi0.80Co0.15Al0.05O2 (dashed blue) and LixNi0.95Al0.05O2 (dashed purple), which were implemented in Eq. 2, as well as to the dQ/dU vs U plot of LixNi0.85Co0.10Al0.05O2 (orange), which was electrochemically characterized by Lee et al.27 From the figure, it is seen that the predicted curve and the literature result closely overlap but that there is a slight difference in the widths and heights of the peaks at 3.98 V and 4.18 V. Furthermore, if we compare the charge associated with the 3.98 V and 4.18 V peaks rather than simply its shape, the difference between the predicted case vs the measured case is found to be less than 1 mAh g−1 (Table II). After taking the inverse of the integrated dQ/dU vs U curve, we can also judge how successful the prediction (green) is in a side by side comparison with the experimental OCP curve (orange). As seen in Fig. 2b, the difference between the two curves is small, never exceeding more than 15 mV. Consequently, our analysis of the LixNi0.85Co0.10Al0.05O2 material supports the hypothesis that a predictable relationship exists between the shape of the OCP curve and Ni stoichiometry in the Ni-rich NCA family.
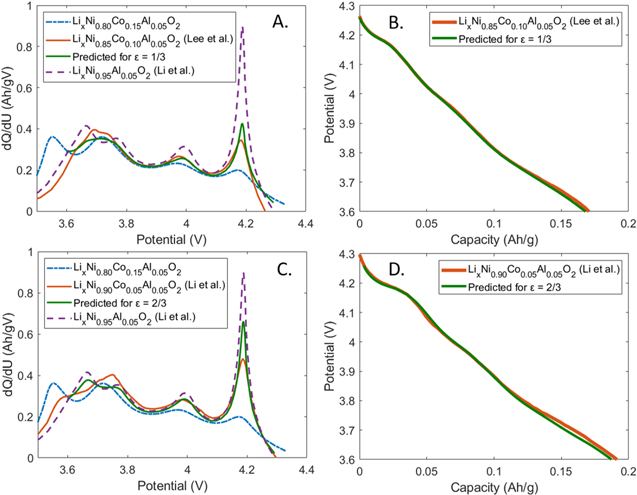
Figure 2. (a) dQ/dU vs U plot, comparing LixNi0.80Co0.15Al0.05O2, LixNi0.95Al0.05O2 (Li et al.),5 LixNi0.85Co0.10Al0.05O2 (Lee et al.),27 and the prediction for ε = 1/3. (b) Comparison of the predicted OCP curve for ε = 1/3 to the curve of LixNi0.85Co0.10Al0.05O2, which was electrochemically characterized by Lee et al.27 (c) dQ/dU vs U plot, comparing LixNi0.80Co0.15Al0.05O2, LixNi0.95Al0.05O2 (Li et al.),5 LixNi0.90Co0.05Al0.05O2 (Li et al.),5 and the prediction for ε = 2/3. (d) Comparison of the predicted OCP curve for ε = 2/3 to the curve for LixNi0.90Co0.05Al0.05O2, which was electrochemically characterized by Li et al.5
Download figure:
Standard image High-resolution imageTable II. Compiled summary of the charge associated with the NCA family materials' two Ni redox peaks, which occur at 3.98 V and 4.18 V. The charge for the two peaks was evaluated between 3.94 V ∼ 4.03 V and 4.08 V ∼ 4.24 V, respectively, assuming a linear baseline.
| NCA family compositions | 3.98 V charge (mAh g−1) | 4.18 V charge (mAh g−1) |
|---|---|---|
| Linear baseline | 17 | 22 |
| LixNi0.80Co0.15Al0.05O2 (Experimental) | 20 | 27 |
| LixNi0.85Co0.1Al0.05O2 (Experimental)29 | 22 | 36 |
| LixNi0.85Co0.1Al0.05O2 (Predicted) | 22 | 37 |
| LixNi0.90Co0.05Al0.05O2 (Experimental)5 | 24 | 46 |
| LixNi0.90Co0.05Al0.05O2 (Predicted) | 24 | 47 |
| LixNi0.95Al0.05O2 (Experimental)5 | 26 | 57 |
To confirm the hypothesis, we look at a second example considering the LixNi0.90Co0.05Al0.05O2 material. Using Eq. 3, we determine that the relevant stoichiometric factor, ε, is 2/3. In the same manner to the previous example, this factor is implemented in Eq. 2 to generate the predicted dQ/dU vs U plot. In Fig. 2c, we compare the predicted curve (green) to the dQ/dU vs U curves of LixNi0.80Co0.15Al0.05O2 (dashed blue) and LixNi0.95Al0.05O2 (dashed purple), which were used in the prediction, as well as the dQ/dU vs U curve of LixNi0.90Co0.05Al0.05O2 (orange), which was electrochemically characterized by Li et al.5 As in the previous example, there is a visually close agreement between the curves, but a quantitatively close agreement is seen when considering the charges associated with the peaks at 3.98 V and 4.18 V (Table II). After taking the inverse of the integrated dQ/dU vs U curve, we can again judge how successful the prediction (green) is in a juxtaposition with the experimental OCP curve (orange). As seen in Fig. 2b, the difference between the predicted curve vs the measured curve is slightly greater than in the LixNi0.85Co0.10Al0.05O2 example, but is still limited to 17 mV or less. Thus, we are able to confirm that the OCP curve in the Ni-rich NCA family (LixNi0.80+0.15εCo0.15(1−ε)Al0.05O2) is related to its Ni stoichiometry specified by the stoichiometric factor, ε.
Next, we investigate if the stoichiometric factor, ε, in a Ni-rich NCA cathode material with an unknown chemical formula can be identified using electrochemical characterization. For this purpose, we used a cathode extracted from a commercial 18650 cell (Sanyo, Illumination Supply Inc.), although any unknown material, including newly synthesized powders, could be subjected to the same analysis. In the initial characterization step, we used SEM/EDS to study the composition of both the standard NCA electrode and the cathode extracted from the Sanyo battery. As shown in Table III, the two materials are composed of Ni, Co, and Al, and the extracted cathode has a higher Ni content than the standard NCA. Furthermore, manganese is not detected in either material, and, as seen in Fig. S2, the two cathodes consist of one type of active material and not a mixture of two or more components.
Table III. Atomic ratio determined using EDS (sampled in 10 different locations) for the LixNi0.80Co0.15Al0.05O2 cathode and unknown cathode. No Mn was detected.
| NCA cathode: LixNi0.80Co0.15Al0.05O2 | Unknown cathode: LixNi0.80+0.15εCo0.15(1−ε)Al0.05O2 | |||||
|---|---|---|---|---|---|---|
| Ni | Co | Al | Ni | Co | Al | |
| EDS Atomic ratio | 0.80 | 0.16 | 0.041 | 0.858 | 0.098 | 0.045 |
| EDS stdev | 0.011 | 0.0054 | 0.008 | 0.0003 | 0.004 | 0.002 |
In a subsequent characterization step, we perform electrochemical lithiation/delithiation of the unknown cathode and extracted the stoichiometric factor, ε, using a linear optimization procedure. As part of this analysis, we have assumed that the Al stoichiometric ratio remained at 0.05 and used Eq. 2 to look for the optimal fractions of LixNi0.95Al0.05O2 and LixNi0.80Co0.15Al0.05O2. More specifically, we performed a minimization of the root mean square error (RMSE) of the summed differences between the dQ/dU vs U features of the unknown cathode and linear combinations of dQ/dU vs U features of the two end members of the LixNi0.80+0.15εCo0.15εAl0.05O2 family. Using this procedure, we identified an optimal stoichiometric factor of 0.33, which corresponds to Ni content of 85% (Eq. 3).
Figure 3a visualizes the dQ/dU vs U curve of the identified composition, LixNi0.85Co0.10Al0.05O2 (ε = 0.33), as well as the dQ/dU vs U curves of the unknown cathode (orange), LixNi0.80Co0.15Al0.05O2 (dashed blue), and LixNi0.95Al0.05O2 (dashed purple). As seen in the figure, there is a close overlap between the features of the extracted cathode and the curve predicted for ε = 0.33. Upon integration of the dQ/dU vs U curve and subsequent inversion, it is also possible to visualize the OCP curves of the identified composition (green) next to the OCP curve of the unknown cathode (orange, Fig. 3b). The difference between the two curves does not exceed 16 mV in the 4.3 V–3.6 V range, indicating a similar level of agreement as in Ni-rich NCA examples discussed in Fig. 2.
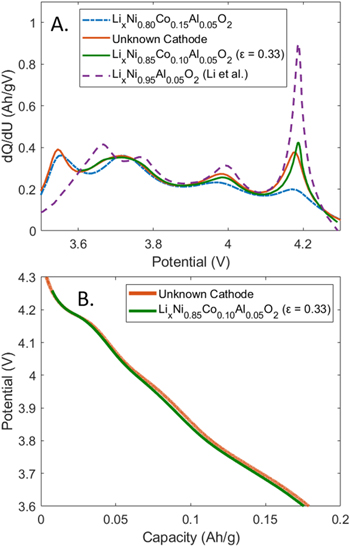
Figure 3 (a) dQ/dU vs U plot, comparing LixNi0.80Co0.15Al0.05O2, LixNi0.95Al0.05O2 (Li et al.),5 Sanyo cathode with unknown composition, and the curve with an optimal stoichiometric factor of 0.33. (b) Comparison of the predicted OCP curve using the optimal stoichiometric factor and the measured OCP curve of the unknown cathode.
Download figure:
Standard image High-resolution imageIn the final characterization step, we verified the Ni content in the extracted cathode using ICP-OES, which is a more traditional elemental composition identification method. As reported in Table IV, we found that the Ni and Co stoichiometries in the unknown cathode are  and
and  which is in close agreement with electrochemical results (
 and
and  ). The observed small difference in the Ni content may be due to a few factors. First, it is possible that a small percentage of the Ni present in the unknown cathode is not electrochemically active and can therefore be detected by ICP-OES but will not be reflected in the OCP curve. Second, there exists a limitation with the presented linear combination method, due to its assumption of a constant Al content of 5%. Prediction of an OCP curve for a cathode with a different Al content would only be possible if appropriate reference samples are characterized.
Table IV. Atomic ratio determined using ICP-OES for the LixNi0.80Co0.15Al0.05O2 cathode and unknown cathode. No Mn was detected.
| NCA cathode: LixNi0.80Co0.15Al0.05O2 | Unknown cathode: LixNi0.80+0.15εCo0.15(1−ε)Al0.05O2 | |||||
|---|---|---|---|---|---|---|
| Ni | Co | Al | Ni | Co | Al | |
| ICP-OES Ratio | 0.80 | 0.14 | 0.06 | 0.87 | 0.09 | 0.04 |
Extending OCP curve prediction to other Ni-rich cathode families
We have thus far focused on predicting the OCP curve of the LixNi0.80+0.15εCo0.15(1−ε)Al0.05O2 family, in which the Al composition is kept constant at 0.05 and the Ni:Co ratio is changed. Next, we demonstrate that the identified relationship between the stoichiometric factor, ε, and the shape of the OCP curve also holds for a member Ni-rich NCM cathode family with a general formula of LixNi0.60+0.20εCo0.20(1−ε)Mn0.20O2. In Fig. 4a, the dQ/dU vs U plot visualizes the relevant curves for three members of this family: LixNi0.60Co0.20Mn0.20O2 (NCM622, dash-dotted blue), LixNi0.70Co0.10Mn0.20O2 (NCM712, orange), and LixNi0.80Mn0.20O2 (NCM802, dashed purple).32 The two Ni redox peaks now appear at 4.03 V and 4.24 V and increase in proportion to Ni content in the cathode material. After adapting Eqs. 2 and 3 to the Ni-rich NCM family, it is possible to perform a linear combination of NCM622 and NCM802 with  to predict the dQ/dU vs U curve for NCM712. The resulting prediction (Fig. 4a, green) is shown to match well to the literature result plotted as an orange curve. Furthermore, if we compare the charge associated with the 4.03 V and 4.24 V Ni redox peaks rather than simply its shape, the agreement between charge associated with each peak for the two cases is within 1 mAh g−1 (Table V). Next, the predicted dQ/dU vs U curve is integrated, then inverted, and finally compared to the OCP curve of NCM712. The two curves closely overlap and remain within 18.5 mV of each other in the 4.3–3.6 V range.
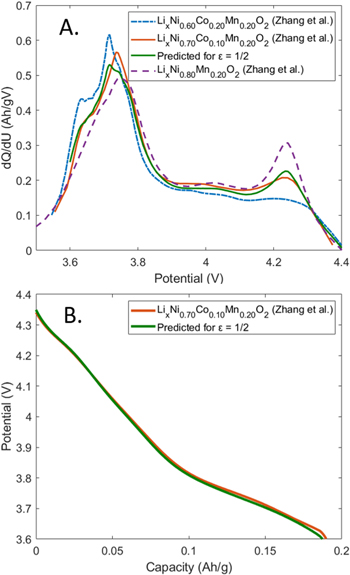
Figure 4. (a) dQ/dU vs U plot, comparing LixNi0.60Co0.20Mn0.20O2 (NCM622, Zhang et al.),32 LixNi0.70Co0.10Mn0.20O2 (NCM712, Zhang et al.),32 LixNi0.80Mn0.20O2 (NCM802, Zhang et al.),32 and the predicted curve using ε = 1/2. (b) Comparison of the predicted OCP curve for ε = 1/2 and the OCP curve of NCM712, which was electrochemically characterized by Zhang et al.32
Download figure:
Standard image High-resolution imageTable V. Compiled summary of the charge associated with the NCM family materials' two Ni redox peaks, which occur at 4.03 V and 4.24 V. The charge for the two peaks was evaluated between 3.956 V ∼ 4.112 V and 4.13 V ∼ 4.312 V, respectively, assuming a linear baseline.
| NCM family compositions | 4.03 V charge (mAh g−1) | 4.24 V charge (mAh g−1) |
|---|---|---|
| Linear baseline | 25 | 23 |
| LixNi0.60Co0.20Mn0.20O2 (Experimental)32 | 25 | 27 |
| LixNi0.70Co0.10Mn0.20O2 (Experimental)32 | 28 | 33 |
| LixNi0.70Co0.10Mn0.20O2 (Predicted) | 27 | 33 |
| LixNi0.80Mn0.20O2 (Experimental)32 | 29 | 41 |
Building upon the two examples presented above, which focused on the LixNi0.80+0.15εCo0.15(1−ε)Al0.05O2 and LixNi0.60+0.20εCo0.20(1−ε)Mn0.20O2 families, we can further extend our analysis and predict not-yet-synthesized Ni-rich cathode compositions by varying the stoichiometric factor, ε, between 0 and 1. In Fig. 5a, the dQ/dU vs U curves for a range of Ni content from 80∼95% in LixNi0.80+0.15εCo0.15(1−ε)Al0.05O2 are shown using fractional combinations of LixNi0.80Co0.15Al0.05O2 and LixNi0.95Al0.05O2. In an analogous manner, Fig. 5b shows the predicted dQ/dU vs U curves after Ni content is varied from 60∼80% in LixNi0.60+0.20εCo0.20(1−ε)Mn0.20O2. These curves can be integrated and the inverse of the results can be plotted in the form of OCP curves on a potential vs capacity (U vs Q) scale. As seen in Figs. 5c and 5d, the OCP curves have plateaus around 3.98 V and 4.18 V as well as 4.03 V and 4.24 V, respectively, which shift to higher capacity values as the Ni content in the material increases.

Figure 5. (a) Predicted dQ/dU vs U curves for varying Ni compositions in LixNi0.80+0.15εCo0.15(1−ε)Al0.05O2, where 0 ≤ ε ≤ 1. (b) Predicted dQ/dU vs U curves for varying Ni compositions in LixNi0.60+0.20εCo0.20(1−ε)Mn0.20O2, where 0 ≤ ε ≤ 1. (c) Comparison of OCP curves for the LixNi0.80+0.15εCo0.15(1−ε)Al0.05O2 family, generated by inverting the integrated dQ/dU vs U curves shown in (a). (d) Comparison of OCP curves for the LixNi0.60+0.20εCo0.20(1−ε)Mn0.20O2 family, generated by inverting the integrated dQ/dU vs U curves shown in (b).
Download figure:
Standard image High-resolution image
We note that not all cathode stoichiometries are compatible with the presented OCP prediction methodology. Through examination of the reported crystal structures of the LixNi0.80+0.15εCo0.15(1−ε)Al0.05O2 family,5 we have observed that in the potential range of interest, there must be phase consistency between two components to be combined. For example, if the objective was to predict OCP curves of Ni-rich LixNiaCobAlzO2 with z ≤ 5%, the use of OCP curves of LixNiO2 and LixNi0.80Co0.15Al0.05O2 could be logical. Nevertheless, these two stoichiometries are not compatible because they experience different phase transitions during the lithiation process. The features in the OCP curve, which are associated with the phase changes, can be easily visualized when comparing the in situ XRD patterns of LixNiO233 to those of LixNi0.80Co0.15Al0.05O2 and LixNi0.95Al0.05O2.5 First, focusing on LixNiO2, it can be seen that it has several step phase changes, due to the collapsing interlayer spacing, which appear as numerous plateaus in the OCP curve.33 Alternatively, LixNi0.80Co0.15Al0.05O2 and LixNi0.95Al0.05O2, which include Al as a stabilizing metal, have smooth phase changes as a function of the state of lithiation, and these changes occur at almost identical potentials for the two materials.5,11,33 In Fig. S3, it is evident that fractional combination of the dQ/dU vs U curves of LixNiO2 and LixNi0.80Co0.15Al0.05O2 fails to yield an accurate OCP curve for a Ni-rich NCA material with an Al content of < 5% (LixNi0.88Co0.09Al0.03O2). Therefore, our analysis indicates that for the linear combination to be successful, it is necessary for the cathode materials within the family of focus to have the same phase changes, and for these phase changes to occur at approximately the same potentials.
Looking at LixNi0.60+0.20εCo0.20(1−ε)Mn0.20O2 materials, a similar stabilization effect can be seen with the addition of constant Mn content instead of Al as in LixNi0.80+0.15εCo0.15(1−ε)Al0.05O2. In contrast to the entire NCM cathode family, in which the locations of the features in the dQ/dU vs U plot tend to shift as function of Ni, Co, and Mn stoichiometries,32 the redox peaks of the LixNi0.60Co0.20Mn0.20O2, LixNi0.70Co0.10Mn0.20O2, and LixNi0.80Mn0.20O2 materials remain at consistent values, which allows for straightforward prediction of OCP curves within this family. As a result, we hypothesize that there are other cases within the class of cathode materials with a general formula of LixNia+εbCob(1−ε)MzO2, where z is a constant and M is a transition metal, in which the OCP curve can be predicted as a function of the stoichiometric factor, ε. Additionally, it has been recently reported that the electrochemical properties of LixNi0.95−εxM0.05+εxO2 materials, where M = Al, Mn, or Mg and ≠ Co, are analogous to those of the LixNi0.80+0.15εCo0.15(1−ε)Al0.05O2 family.5 Consequently, the presented OCP prediction methodology could likely be extended to the LixNi0.95−εxM0.05+εxO2 family as well as other families materials with similar properties. Identifying these further examples would help expand the understanding of the fundamental electrochemistry of Ni-rich cathodes as well as provide a useful tool to predicting the OCP curves of these materials.
Conclusions
In this study, we demonstrate that the OCP curves of the Ni-rich NCA family (LixNi0.80+0.15εCo0.15(1−ε)Al0.05O2 family, 0 ≤ ε ≤ 1) can be predicted as a function of stoichiometric factor, ε, using a fractional combination of the OCP curves of a standard NCA material, LixNi0.80Co0.15Al0.05O2, and cobalt-free material, LixNi0.95Al0.05O2, in the dQ/dU vs U space. Using this method, it was possible to confirm the shape of the OCP curves of known Ni-rich NCA materials, such as LixNi0.90Co0.05Al0.05O2 and LixNi0.85Co0.10Al0.05O2., as well as to identify Ni composition in a cathode extracted from a commercially available battery. The identified relationship between stoichiometric factor, ε, and the OCP curve was also confirmed to be valid in the Ni-rich NCM family with a general formula of LixNi0.60+0.20εCo0.20(1−ε)Mn0.20O2, after demonstrating that the OCP curves of LixNi0.60Co0.20Mn0.20O2 and, the cobalt free, LixNi0.80Mn0.20O2, could be used to predict the OCP curve of LixNi0.70Co0.10Mn0.20O2. Finally, the presented method was used to calculate the OCP curves of not-yet-synthesized cathode material compositions in the studied cathode families and hypothesized to extend to other cathode families, in which members undergo phase changes at approximately the same potential values.
Acknowledgments
LixNi0.80Co0.15Al0.05O2 electrodes were produced at the U.S. Department of Energy's (DOE) CAMP (Cell Analysis, Modeling and Prototyping) Facility, Argonne National Laboratory. The CAMP Facility is fully supported by the DOE Vehicle Technologies Program (VTP) within the core funding of the Applied Battery Research (ABR) for Transportation Program. The authors would like to acknowledge Bryant J. Polzin for his continued support in quickly providing electrode materials from CAMP.