
Abstract
While lithium-sulfur (Li-S) batteries promise very high gravimetric energy densities, they typically suffer from short cycle life and low power densities, particularly at high electrode loadings. Highly concentrated electrolytes (2M-5M) may demonstrate improved capacity retention, but at the expense of added weight and cost of electrolyte salts and reduced rate performance. Here we report our counter-intuitive findings on very promising performance of electrolyte compositions with salt concentrations below 0.3M. Such a low concentration enables effective use of unconventional salts and electrolyte additives which do not dissolve in the ether-based solvents at higher concentrations typically used in experimental and commercial batteries, thus substantially increasing cell design freedom. The significantly lower viscosity of the low concentration electrolytes also allows for faster electrolyte permeation. This report opens a new and promising field of studying low concentration electrolytes for Li-S and likely other chemistries.
Export citation and abstract BibTeX RIS
This was Paper 515 presented at the Atlanta, Georgia, Meeting of the Society, October 13–17, 2019.
With the increasing adoption of electric vehicles, the desire for drones and electric planes to travel longer distances, and the need for cheap, grid-scale energy storage, the demands for improved battery performance and reduced battery weight and cost will grow rapidly. While commercial Li-ion batteries have been very successful so far, they are still too heavy, too costly, and are made of too many toxic materials to be the future of energy storage long-term.1,2 Lithium-sulfur (Li-S) batteries provide a promising alternative in that the cathodes are made of non-toxic, earth-abundant materials, which are both inexpensive and lightweight. Li-S batteries not only satisfy these supply-chain requirements, but also provide the highest theoretical gravimetric capacity (and the second highest gravimetric energy density) of conversion-type cathodes, far exceeding those of commercial cathode materials.3–8 With a theoretical capacity of 1,675 mAh/sulfur, S-based cathodes raise the bar of the achievable capacity for rechargeable batteries.6
Unfortunately, corrosion of the aluminum foil current collector by the LiTFSI salt,9 high cost of the electrolyte salts,10 and polysulfide dissolution into the electrolyte11 ultimately limit attainable Li-S battery capacity, rate performance and cell stability. Our group4 and others12 demonstrated that high-concentration electrolytes may suppress lithium polysulfide dissolution due to the common ion effect and overall smaller fraction of the solvent molecules that induce formation and dissolution of polysulfides. With certain salts or salt additives, they may additionally form a favorable cathode solid electrolyte interphase (CEI)13–16 that protects the S cathode against such dissolutions. However, high concentration electrolytes suffer from high viscosity17 and typically decreased ionic mobility,18 limiting active material utilization at high loadings and high rates. High electrolyte viscosity also requires longer wetting (electrode stack infiltration) time, which undesirably increases cell fabrication time and cost. Finally, high concentration electrolytes also use large amounts of relatively expensive and heavy salt(s), which reduce the specific energy of the cell and increase cell cost. Low concentration electrolytes, in contrast, have received very little attention with the expectation that they would offer substantially inferior performance for Li-S cells as they may enhance polysulfide dissolution. Interestingly, a recent comparison of the Li-S performance in 1M and 0.5M LiTFSI electrolytes showed the improved performance of the lower concentration solution, possibly due to the lower viscosity.19 Sun et al. also showed a lowered concentration improves sulfur utilization.20 Here we were interested to explore even lower molarity electrolytes with different salt and salt mixtures and investigate how their physical properties (e.g., viscosity and internal resistance) may impact Li-S cell performance (capacity, internal resistance, and long-term stability). By limiting our salt concentrations to those below 0.1M per salt (and below 0.3M for the salt mixtures), we could explore the impacts of salts which do not traditionally dissolve in ether-based electrolytes, such as LiPF6.
Methods
S/KB cathodes preparation
As we wanted to highlight the impact of electrolytes, we purposely selected S-based cathodes without any protective shells21 or oxide additives22 that may improve cathode stability. As such, we selected standard and easy-to-reproduce procedure: S/nanocarbon electrodes are prepared by melt infiltration of S (99.5%, Sigma-Aldrich, USA) into Ketjen Black® (Lion Specialty Chemicals Co. LTD) at 157 °C for 12 h, thus making S/KB composites. The specific surface area of the KB and sulfur-infiltrated KB were analyzed with the Brauner-Emmett-Teller (BET) isotherm method. The excess S was evaporated at 250 °C until the desired S:C ratio (∼50 wt% S) was achieved. The S/KB particles were then mixed with a polyacrylic acid (PAA) binder (450,000 MW, Aldrich, USA) and pure black (Superior Graphite, USA) conductive additives in a 70:20:10 S/KB:PAA:CB weight ratio. To prepare electrodes, the solids were mixed with a solvent (ethanol:water = 1:1 by volume), sonicated for 30 min and stirred in a vial over-night. The produced slurry was then cast on aluminum (Al) foil (MTI) and left to dry in air at room temperature. The active material loading was approximately 0.45 mg-S cm−2. The dried electrodes were then punched into ½ inch diameter disks, dried in a vacuum oven at 60 °C for 12 h and then assembled into 2032 coin cells with a Celgard 2500 separator, a 0.75 mm thick Li foil anode (99.9%, Alfa Aessar) and 30 μl of the prepared electrolyte.
Electrolyte preparation & characterization
All the electrolytes used in this study employed various combinations of LiTFSI (Sigma-Aldrich, USA), LiPF6 (Aldrich, battery grade), LiNO3 (Alfa Aesar, 99%) salts in identical (commonly used) ether-based solvent mixture: a 1:1 ratio by volume of dimethoxyethane (DME, 99%, Sigma-Aldrich): dioxolane (DIOX, 99%, Sigma-Aldrich). 1M LiTFSI + 0.1M LiNO3 and 3M LiTFSI + 0.1M LiNO3 electrolytes were used as references for standard and high-concentration electrolyte compositions. All the individual salt components were kept at a concentration at or below 0.1M. Table I shows the list of the experimental electrolytes investigated here.
Table I. Experimental electrolyte compositions.
| Sample | [LiTFSI] | [LiPF6] | [LiNO3] |
|---|---|---|---|
| A | 0.1M | — | 0.1M |
| B | 0.05M | 0.05M | 0.1M |
| C | — | 0.1M | 0.1M |
| D | 1M | — | 0.1M |
| E | 3M | — | 0.1M |
Once the electrolytes were prepared, their resistances and viscosities were tested. Resistance measurements were done by taking an EIS spectrum (Gamry Interface 1000, USA) in Li/Li symmetric coin cells. Viscosity measurements were taken with a RheoSense μViscometer (RheoSense, USA). Contact angle measurements were done by taking a video with a goniometer (Ramé-hart Instrument Co., USA) and processing the frames with ImageJ processing software to determine the contact angle and the time until the electrolyte was fully wetted and soaked into the electrode substrate.
Electrochemical measurements
All electrochemical experiments were done using an Arbin system (model BT2X43, USA). For galvanostatic charge-discharge testing, cells were cycled between 1.5 and 2.8 V for two cycles at C/20, followed by one cycle each at C/10, C/5, C/2, 1 C, and 2C rates. For long term tests cells were discharged at C/20 then charged and discharged at C/5 rate for 200 cycles. Each cell was characterized with EIS (Gamry Interface 1000, USA) in the frequency range 1 MHz–0.01 Hz before testing and after long term testing to investigate the change in impedance after cycling.
Post-mortem analysis
After testing, the coin cells were disassembled and inspected. The electrodes, separators, and Li foil anodes were visually examined for their color changes and any surface deposits. The color of the remaining electrolyte was also examined as a qualitative indication of the concentration of the polysulfides in the electrolyte. The electrodes were rinsed in DME before analysis with scanning electron microscopy (SEM) using Hitachi 8030 (Japan) and X-ray photoelectron spectroscopy (XPS) using Thermo K-alpha (USA) to investigate their microstructural changes and the CEI composition. The Li foil was washed in DME before SEM and energy dispersive spectroscopy (EDS) analyses on the Hitachi 8230.
Results and Discussion
Physical properties
For the electrolytes tested, the viscosities expectedly increase with increasing salt concentration. All the low concentration electrolytes have a 0.2M of total salt concentration and show similar viscosities of ∼0.5 mPa·s, regardless of their salt composition (Fig. 1a). Increasing LITFSI salt concentration to 1M tripled the viscosity to ∼1.5 mPa·s and 3M LiTFSI showed the most dramatic increase to 42.5 mPa·s. This increase in viscosity is enough to impact wetting of the separator during coin cell preparation. Figure 1b shows that while the use of higher concentration of 1M gives a slightly lower ohmic cell resistance than the low concentration electrolytes, the overall interfacial resistance with the Li foil was noticeably higher. While low electrolyte resistance is important, low resistance and fast kinetics at the Li anode interface could be more impactful to the overall cell behavior. The 3M LiTFSI gives a higher ohmic resistance (Fig. 1c), but lower interfacial resistance than many other LiTFSI-based electrolytes, while the 0.1M LiPF6 electrolyte gives the lowest interfacial resistance (Fig. 1d).
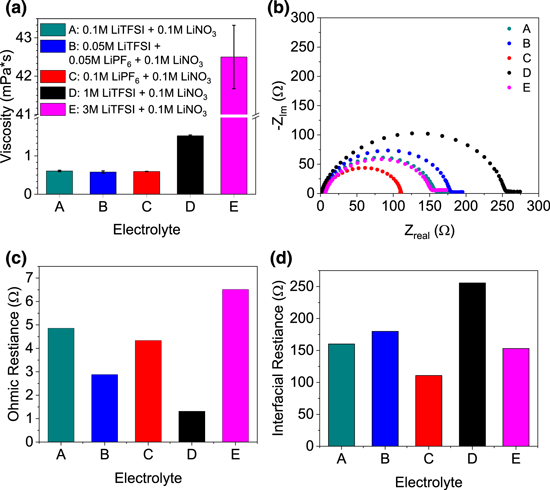
Figure 1. Physical properties of electrolytes (a) viscosity, (b) EIS from Li/Li symmetric cells, (c) ohmic resistance, (d) Li interfacial resistance. All electrolyte concentrations in 1:1 (v:v) DME:DIOX.
Download figure:
Standard image High-resolution imageContact angle measurements (Fig. 2) showed results for 0.1M LiTFSI, 1M LiTFSI, and 3M LiTFSI samples (A, D, and E). The remaining electrolytes (samples B and C) were too volatile to form a drop. While the higher angle 1M LiTFSI was only slightly higher than the 0.1M LiTFSI, the 3M LiTFSI was more than double the contact angle of both. Samples A, D, and E took 1.5, 3, and 10 seconds respectively to soak into the electrodes, matching with the viscosity data. The lower contact angle and faster time to absorb make these low concentration electrolytes more attractive than their high concentration counterparts from the cell fabrication point of view.
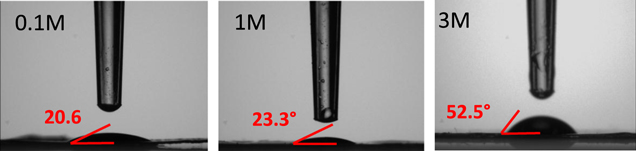
Figure 2. Contact angle measurements revealing wetting of 0.1M, 1M and 3M LiTFSI electrolytes (all with 0.1M LiNO3) on the identically produced electrodes.
Download figure:
Standard image High-resolution imageThe sorption isotherms and the pore size distribution are given in Fig. 3 and clearly indicate that sulfur is filling the pores in the KB samples. The BET specific surface area of the KB is 1303 m 2g−1 and the surface are of the sulfur-carbon composite is 227 m 2g−1.
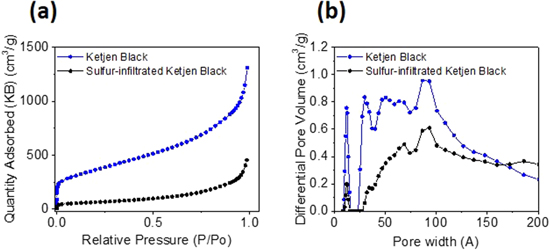
Figure 3. Characterization of pristine Ketjen Black and sulfur-infiltrated Ketjen Black with N2 sorption: (a) isotherms, (b) pore size distributions.
Download figure:
Standard image High-resolution imageElectrochemical testing
Figure 4 shows the electrochemical performance of the low concentration electrolytes. Of the low concentration electrolytes and 1M LiTFSI, the performance of the low concentration electrolytes across C-rates is similar, with the 0.1M LiTFSI electrolyte on average performing the worst. Figure 4b displays the C/10 charge/discharge cycle for each electrolyte. All low concentration electrolytes exhibit flat plateaus, low hysteresis, and low polarization. Similarly, at 2C (Fig. 4c), the reaction still proceeds along the correct pathway, with higher hysteresis, but no evidence of significant kinetic limitations. A comparison of long-term testing (Fig. 4d) shows the lowest decay in capacity for the mixed LiTFSI/LiPF6 electrolyte. The 0.1M LiTFSI electrolyte has a higher initial capacity, but is less stable, as is the 0.1M LiPF6, the combination proves the most stable at this rate.

Figure 4. Electrochemical results for low concentration electrolytes (a) c-rate testing, (b) charge-discharge at C/10, (c) charge-discharge at 2C, (d) cycle stability at C/5, (e) Charge-discharge change through long term test with 0.05M LiTFSI + 0.05M LiPF6 electrolyte. All with 0.1M LiNO3 in 1:1 DME:DIOX.
Download figure:
Standard image High-resolution imageLow concentration electrolyte samples A, B, and C show similar capacity and hysteresis to the 1M LiTFSI electrolyte, indicating that the salt concentration above 0.1–0.2M (to around 1M) may be unnecessary additions to the electrolyte weight and cost. Sample B performs comparably or better than sample D across C-rates (Figs. 5a–5c). Within error, the difference between 1M and the low concentration electrolytes is not significant and thus the lighter, cheaper low-concentration electrolytes can likely replace the 1M LiTFSI standard without sacrificing performance. Even for the relatively thin electrodes tested here, the highly concentrated electrolyte (3M LiTFSI—sample E) enables the highest capacity, it does so with higher polarization, higher resistance, and an inefficient conversion reaction illustrated by the curved plateau. And, as previously discussed, it suffers from undesirably high viscosity and increased cost. In contrast, cheaper and less viscous electrolytes A-C offer much flatter plateaus, significantly lower hysteresis, and capacity similar to or better than the conventional 1M LiTFSI (sample D).
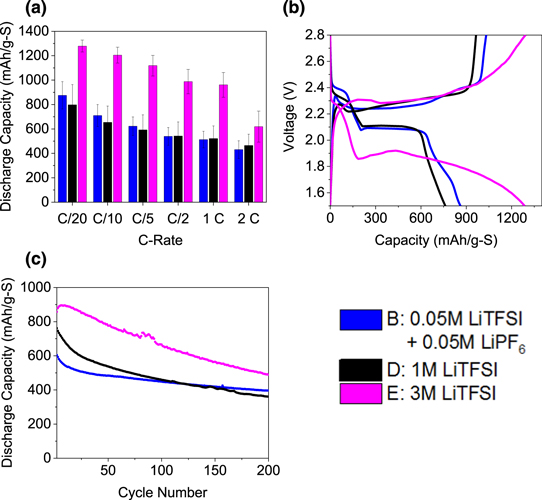
Figure 5. Comparison of electrochemical results for best low concentration electrolyte and high concentration electrolytes (a) c-rate testing, (b) charge-discharge at C/10, (c) cycle stability at C/5. All electrolytes with 0.1M LiNO3 in 1:1 DME:DIOX.
Download figure:
Standard image High-resolution imageComparing EIS results from before and after long-term testing (Fig. 6) reveals the reduction in impedance for the 0.1M electrolyte to be the greatest. Note that for all the electrolytes shown, the major arc decreased in size during testing, indicating a lower interfacial resistances. Yet, the concentrated 3M electrolyte exhibits the largest impedance and the largest interfacial resistance after cycling.

Figure 6. (a) Comparison of EIS results for 0.05M LiTFSI + 0.05M LiPF6 electrolyte with 1M and 3M LiTFSI electrolytes (all with 0.1M LiNO3 in 1:1 DME:DIOX); (b) Zoom into a high-frequency region.
Download figure:
Standard image High-resolution imagePost mortem SEM/EDS results
Post-mortem SEM analysis of the tested S-KB cathodes shows very small changes in the microstructures for all samples (Fig. 7). Individual carbon particles are visible without a change in morphology and no thick surface layer (e.g., CEI or re-deposited (poly)sulfides or S), likely related to the very high external surface area of the porous KB particles and relatively small electrode loadings (Fig. 7). This may be beneficial as it should allow conductive carbon of KB to remain being available for charge transfer, but may also explain small differences in the electrochemical performance between cells (Fig. 4). The Li anode (Figs. 8a–8c), on the other hand, showed significant changes after cycling. We can observe distinct new features that exhibit four additional elements segregated together: S, C, F and O. All Li foil samples were mostly bare Li in the center, with the intensity and size of features increasing towards the edge. Figures 8d, 8e show EDS results from the Li foil at the end of a 2C discharge. The 1M electrolyte produced the greatest (normalized) intensity of N, F, and S, as compared with both the low concentration and high concentration electrolytes, indicating the largest S dissolution and the thickest SEI formation. The LiTFSI, LiPF6 mixed electrolytes has a greater F intensity than the 0.1M LiTFSI electrolyte, which follows from the additional F available from the decomposition of the LiPF6. Mapping of the mixed low concentration LiTFSI, LiPF6 electrolyte shows that the features are mostly composed of O, S, and F, with C being more uniform across the surface.
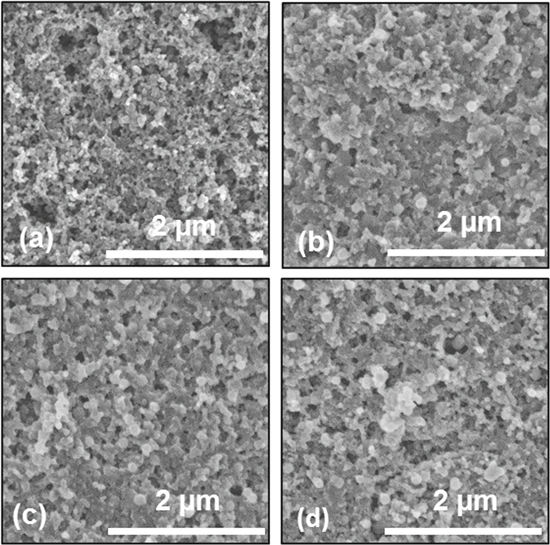
Figure 7. (a) Pristine cathode and post-mortem SEM of cathode after C-rate testing of (b) 0.1M LiTFSI (c) Li foil. 0.05M LiTFSI + 0.05M LiPF6, (d) 1M LiTFSI.
Download figure:
Standard image High-resolution image
Figure 8. Post-mortem SEM of Li foil after C-rate testing of (a) 0.1M LiTFSI, (b) 0.05M LiTFSI + 0.05M LiPF6, (c) 1M LiTFSI cells, (d) EDS spectra on Li foil, (e) EDS mapping on Li foil tested with 0.05M LiTFSI + 0.05M LiPF6 (i-O, ii-S, iii-F, iv-C).
Download figure:
Standard image High-resolution imageXPS results
Post-mortem XPS analysis of thin tested cathodes (Fig. 9) indicates decomposition of the LiTFSI salt and electrolyte solvents with the formation of slightly different CEI in the case of all electrolyte compositions.23–26 For the low concentration electrolytes, CEI species mostly include: CFn, LiF, N-containing compounds, sulfites, and sulfates (Fig. 10). Overall, even 1/10–1/3 salt concentration in the electrolyte may apparently be enough to reproduce the composition of the protective CEI formed in 1M and 3M electrolyte compositions. Electrolytes containing 0.05–0.1M LiPF6 show lower intensities of CF2 than the majority-LiTFSI electrolytes while having a higher ratio of LiF to CFn. Since LiF can be created by the decomposition of both LiTFSI and LiPF6,27 the multiple pathways to LiF make it the more dominant F-containing compound on the surface. Interestingly, only the electrolyte comprised of 0.05M LiPF6 and 0.05M LiTFSI contains the most noticeable amount of Li3N, a compound very important for favorable electrode protection.28 The low concentration electrolytes have more N–O containing compounds than N-containing organic compounds, relatively, as compared to the 1 and 3M electrolytes. This is likely due to the higher relative proportion of LiNO3 in the low M electrolytes since all five electrolytes comprised 0.1M LiNO3. Perhaps with less LiTFSI to break down, there are more N–O containing species leftover to deposit and favorably protect the cathode. Only 0.1M LiTFSI exhibits both CF2 and CF3 bonds, while all electrolytes show C–C, C–H, C–O, and C=O bonds consistent with the decomposition and polymerization of the dioxolane solvent.29 Another interesting observation—electrodes from the 1M LiTFSI, 3M LiTFSI and 0.1M LiPF6 electrolyte cells did not show any Li2S on the surface, suggesting the incomplete reduction of polysulfides (the electrodes were examined at the end of discharge, thus mostly comprising Li2S in the bulk). The low concentration LiTFSI samples A and B cells showed mostly colorless electrolytes during the post-mortem analysis, further supporting the minimum content of polysulfides remaining in the bulk of the electrolyte. The lack of yellowing of the low concentration electrolyte also goes against the theory that high concentration electrolytes are necessary to minimize polysulfide dissolution. Low concentrations of LiTFSI showed higher surface intensities of sulfites over sulfates, with the opposite true for high concentrations of LiTFSI. This may indicate a less thorough oxidation of S after the decomposition of the LiTFSI. While increasing electrolyte concentration undesirably increases cell polymerization,27 the low concentration electrolytes are clearly adequate to achieve similar or better rate performance (Figs. 4 and 5) and may have more favorable CEI protection.

Figure 9. XPS results and peak deconvolution of S cathodes for all electrolytes (all with 0.1M LiNO3 in 1:1 DME:DIOX): (a) F, (b), N, (c) C, (d) S spectra.
Download figure:
Standard image High-resolution image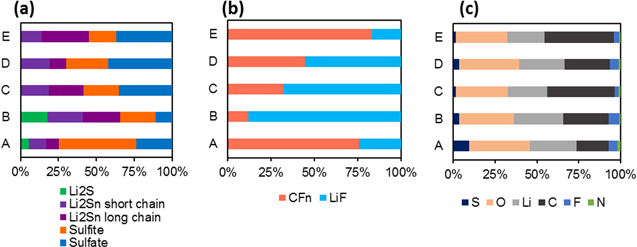
Figure 10. Quantification of XPS peaks of post mortem S cathodes with electrolytes A (0.1M LiTFSI), B (0.05M LiTFSI + 0.05M LiPF6), C (0.1M LiPF6), D (1M LiTFSI), and E (3M LiTFSI) for (a) S compounds, (b), F compounds, (c) by element. All electrolytes have 0.1M LiNO3 and are in 1:1 (v:v) DME:DIOX.
Download figure:
Standard image High-resolution image
Conclusion
This work reports on the first exploration of extremely low (<0.3M) salt concentrations in Li-S batteries. This study combined two common electrolyte salts, LiTFSI, and LiPF6, at low concentration and showed that their combination produced capacities comparable to the conventional 1M LiTFSI electrolyte. In contrast to our initial expectations, reducing electrolyte concentration from 1M to 0.2M did not increase polysulfide dissolution and Li2S precipitation on the Li anode. In fact, both the C-rate and long-term cycling tests reveal low concentration electrolytes perform similarly or better than the standard 1M electrolyte. Post-mortem SEM and XPS analysis illustrate that the low salt concentrations maintain the same cathode microstructure after cycling with no re-precipitated active material visible, while the Li anode showed smaller S content than 1M electrolyte. Low concentration electrolytes enable lightweight batteries at lower cost while offering similar or better rate performance and better stability to than the more traditionally used 1M LiTFSI or 3M LiTFSI electrolytes. Based on such promising results, our future studies on low concentrated electrolytes will be focused on increasing mass loadings, conducting tests in pouch cells (thus with minimum content of electrolyte excess) and using more advanced surface-protected S cathodes that exhibit substantially reduced polysulfide formation and dissolution.
Acknowledgments
This work was supported by US Army CCDC AvMC under contract numbers W31P4Q18D0002-W31P4Q18F0133.