

Abstract
The influence of various synthesis conditions of a metal-nitrogen-carbon (M-N/C) catalyst material on oxygen reduction reaction (ORR) kinetics is discussed. Seven M-N/C catalysts based on cobalt are obtained by changing various synthesis conditions, such as the mixing environment, pyrolysis gas, and post-treatment. The ORR activity and stability measurements are performed using the classical three-electrode configuration in a 0.1 M HClO4 solution. The most active and stable ORR catalyst proves to be the material obtained by mixing a cobalt salt, 2,2'-bipyridine, and a high surface area silicon carbide derived carbon together in water and pyrolyzing the mixture in argon. In a fuel cell test, however, a maximum power density value of 135 mW cm−2 is achieved with the catalyst mixed together in a planetary ball-mill at a low catalyst loading of 1.0 ± 0.1 mg cm−2 and at a test cell temperature of 60 oC despite of the fact that preparing the catalyst via dry ball-milling reduces the surface area of the material roughly 40% more than in the case of using a solution-based method. Consequently, mixing the catalyst precursors together without any additional chemicals in a planetary ball-mill instead of in a solution appears to be the most promising choice.
Export citation and abstract BibTeX RIS

This is an open access article distributed under the terms of the Creative Commons Attribution 4.0 License (CC BY, http://creativecommons.org/licenses/by/4.0/), which permits unrestricted reuse of the work in any medium, provided the original work is properly cited.
Polymer electrolyte membrane fuel cells (PEMFC) are promising candidates for replacing internal combustion engines as power sources in various applications.1 At the heart of these novel electrochemical devices is the cathode catalyst. Current state-of-the-art catalysts are based on platinum, an expensive and scarce precious metal.2 In order to overcome this issue, one of the proposed long-term solutions is to replace platinum with catalysts based on non-platinum group metals, nitrogen, and carbon (M-N/C).3 Many authors have shown promising results in this research field and highly active M-N/C catalysts have been developed using a wide variety of precursors and synthesis methods.4–9 The large advancements made during recent years are further illustrated by the fact that commercially available M-N/C catalysts are already being developed and tested by a few companies, for instance Pajarito Powder10 and the Nisshinbo Group.11
As these M-N/C type catalysts are in transition from research and development in laboratories to more scaled-up manufacturing, special consideration has to be given to the development of low cost synthesis methods. This includes the cost of precursors, synthesis conditions, additional chemicals, and overall sustainability, which all significantly contribute to the manufacturing costs. These parameters should be optimized in a way that the final cost of the M-N/C catalyst is as low as possible. Ultimately, the main attraction of these novel catalysts has been and should continue to be their significantly lower price compared to conventional state-of-the-art Pt-containing catalysts.12–14
Different research groups apply various synthesis methods to produce M-N/C type catalysts (Table I). These methods range from more complicated multi-step procedures15–17 to simple one-step and one-pot approaches.18–20 While these wide approaches are fairly productive in terms of finding new ways to produce novel M-N/C catalysts, information about how various synthesis parameters affect a catalysts characteristics is sparse. The influence of only a few of the parameters have been studied extensively, such as the transition metal content,21–27 pyrolysis temperature,24–32 and role of different nitrogen precursors.31–33 In terms of the pyrolysis environment, NH3 is often used to additionally dope the catalyst with nitrogen, thus increasing the oxygen reduction reaction (ORR) activity of the catalyst noticeably.34–38 Another interesting proposal gaining attention is co-doping the M-N/C catalysts with another heteroatom, for instance sulfur.39–43 It has been suggested that doing so changes the electronic properties of the catalyst which in turn impacts the catalytic activity of the material.44 Among the different studied heteroatoms, sulfur has been shown to have the most positive effect on the ORR activity.43 Many groups who obtained catalysts with high ORR activities have a post-treatment step in their synthesis which involves washing the material with acid to remove unstable and inactive metal species and then pyrolyzing the treated catalyst for a second time.4,24,34,45 The second pyrolysis removes the various residual functional groups left behind by the acid leaching, thus reactivating the material.46 As a result, the post-treatment procedure improves both the activity and long-term stability of the catalyst.
Table I. Summary of used synthesis methods, studied synthesis parameters, and electrochemical data of different M-N/C type catalysts.
| M-N/C catalyst | Synthesis method | Parameter studied | Eonset (V vs RHE) | FC test | References |
|---|---|---|---|---|---|
| Fe/N/CF | One-pot ball-milling | ZIF-8 content | 0.93 | PEMFC | 4 |
| Electrospinning | 0.5 M H2SO4 | ||||
| Post-treatment step | |||||
| Fe/Phen/Z8 | One-pot mixture | Pyrolysis temp | — | PEMFC | 7 |
| Dry ball-milling | NH3 treatment | ||||
| NH3 treatment | |||||
| Co-Nx/C | Multi-step | — | 0.95 | — | 15 |
| Nanorod arrays | 0.1 M KOH | ||||
| Fe-NMG | Multi-step | Nitrogen precursor | 0.96 | AEMFC | 16 |
| Sacrificial support | 0.1 M KOH | ||||
| NH3 treatment | |||||
| Fe@Aza-PON | Multi-step | — | ∼0.9a) | — | 17 |
| NaBH4 reduction | 0.1 M KOH | ||||
| Freeze-drying | |||||
| Zn(mIm)2TPIP | One-pot mixture | Mixing method | 0.9 | PEMFC | 19 |
| Post-treatment step | 0.1 M HClO4 | ||||
| CoN‒CF-700 | One-pot mixture | Pyrolysis temp | 0.94 | — | 20 |
| Acid washing | 0.1 M KOH | ||||
| FeNC-P | One-pot mixture | Metal content | ∼0.9a) | — | 22 |
| Post-treatment step | 0.5 M H2SO4 | ||||
| PFA-Fe5–900-ALP | One-pot mixture | Metal content | 0.86 | — | 24 |
| Post-treatment step | Pyrolysis temp | 0.1 M HClO4 | |||
| 20Co-NC-1100 | One-pot mixture | Pyrolysis temp | 0.93 | PEMFC | 27 |
| One-step | Metal content | 0.5 M H2SO4 | |||
| Fe-N-C | One-pot mixture | Mixing method | ∼0.9a) | PEMFC | 35 |
| Dry ball-milling | 0.5 M H2SO4 | ||||
| NH3 treatment | |||||
| Fe14NDC-9-W2M−9 | One-pot mixture | Metal content | 0.821 | — | 39 |
| Post-treatment step | Pyrolysis temp | 0.1 M HClO4 | |||
| SN_Fe27 | One-pot mixture | Metal content | ∼0.9a) | — | 43 |
| Post-treatment step | Heteroatom doping | 0.1 M HClO4 | |||
| Fe0.5−950 | One-pot ball-milling | NH3 treatment | ∼0.95a) | PEMFC | 47 |
| NH3 treatment | 0.1 M H2SO4 | ||||
| Fe-N-C | One-pot mixture | — | 0.83 | PEMFC | 48 |
| Sacrificial support | 0.5 M H2SO4 | DMFC | |||
| Acid washing | |||||
| CA#1 | One-pot mixture | — | — | PEMFCa) | 49 |
| Dry ball-milling | |||||
| Post-treatment step |
It is highly desired that the rotating disc electrode (RDE) technique would correctly predict the ORR activity in PEMFCs.3,35 Therefore, generally the activity of these M-N/C type catalysts is initially studied using widespread and well-developed techniques in a standard three-electrode configuration.1,3 However, studying these catalysts in more practical fuel cell conditions is not yet as universal (Table I). The performance of a catalyst in a fuel cell experiment is influenced by various conditions, such as the catalyst loading, catalyst coating techniques, cell temperatures, used gases and their pressures, and ionomer content.3,50 Consequently, comparing the fuel cell testing results of different workgroups is challenging due to the inconsistency of the applied measurement conditions.14 As a result, making complex comparisons between the results obtained from RDE measurements and the single cell tests is problematic due to the remarkably different environment and conditions present in the two experiments.35 For example, Jaouen et al.35 varied the Nafion ionomer to catalyst ratio and synthesis conditions which led to a conclusion that the ORR activity in PEMFC conditions is comparatively predictable with the RDE technique for some catalysts when the ink is optimized. It is increasingly important that researchers also investigate how their synthesized catalyst materials behave in a single cell in order to gain more useful insight regarding the activity and stability of their catalysts.
Previously, we utilized a solution-based synthesis method to prepare active M-N/C type ORR catalysts based on cobalt.51 The purpose of the present study is to gain insight into how various synthesis parameters affect the electrochemical performance of a catalyst. The catalysts discussed here have been synthesized using a silicon carbide derived carbon (CDC) powder produced in-house as the carbon support material. The nitrogen source was chosen based on our previous works studying the influence of various nitrogen precursors on the catalytic activity of M-N/C type catalysts.33,51 It was found that catalysts synthesized using 2,2'-bipyridine as the nitrogen source provided high and equal ORR activities compared to catalysts synthesized with other promising nitrogen sources, such as 1,10-phenanthroline. However, 2,2'-bipyridine is more readily available for large-scale production in the future and is therefore a more sustainable candidate as a nitrogen source.
The solubility of this nitrogen precursor, 2,2'-bipyridine, severely depends on the solvent.52 Due to this, catalyst precursors were mixed together in either water, where 2,2'-bipyridine dissolves only slightly, or in ethanol, where the dissolution is complete, to study the importance of nitrogen precursor solubility. In this work, the co-doping with sulfur was hoped to be achieved via the simple addition of sulfuric acid into the precursor mixture. A comparison between Ar and the less expensive N2 as the pyrolysis environment was made. The impact of the common post-treatment step was also studied. Finally, moving from a solution-based mixing technique to a dry mechanical preparation method, namely ball-milling, would decrease the amount of possibly hazardous chemicals involved.53 For comparison, the application of a commercial Vulcan® XC-72 carbon powder as the catalyst support was investigated as well. In total seven different catalyst materials were synthesized and their ORR activity has been measured in a three-electrode measurement setup. Additionally, the stability of these catalysts in such conditions was studied in a week-long test. To conclude, the most promising catalysts were established and their performance was studied in a fuel cell mode.
Experimental
Carbon support preparation
The carbon support material used in this work was a CDC synthesized from silicon carbide (SiC, 98.5%, 320 grit powder, Alfa Aesar). A detailed synthesis procedure has been discussed in a previous study.54 Shortly, the silicon carbide powder was inserted into a tube furnace, where silicon was removed from the material by chlorination (Cl2, AGA, 99.99%, gas flow 100 ml min−1) at 1100 oC. In order to increase the porosity of the resulting powder, post-activation treatment with CO2 (AGA, 99.99%, gas flow 50 ml min−1) at 950 oC was conducted for 6 h, yielding the silicon CDC support material shortly noted as C.
Catalyst synthesis
The subject of this study is the detailed analysis of a solution-based M-N/C catalyst synthesis method which has previously been used to produce catalysts with high ORR activities.31,33,51
A number of synthesis parameters were controlled and changed to produce the catalysts under study in the present work (Fig. 1). First, the cobalt (Co(NO3)2 6H2O, ≥99.0%, Sigma-Aldrich) and nitrogen (2,2'-bipyridine, ReagentPlus®, ≥99%, Sigma-Aldrich) precursors were simply mixed together with the carbon support material C in Milli-Q+ water while stirring with a magnetic stir bar for 3 h. The solvent was then removed with a rotary evaporator and the dry powder was pyrolyzed in an Ar flow (AGA, 99.999%, 200 ml min−1) at 800 oC for 1.5 h. The resulting material was named Co-N/C (step 1 in Fig. 1). In comparison, our previously studied catalyst denoted in this work as Co'-N/C' was synthesized using a different cobalt source and a carbon support which had been activated for only 3 h (C').51

Figure 1. Synthesis scheme of the M-N/C catalysts.
Download figure:
Standard image High-resolution imageThe synthesized catalyst Co-N/C was then post-treated in order to produce catalyst Co-N/C_AL-p (step 2 in Fig. 1). The acid leaching was conducted in 0.5 M H2SO4 at 80 oC for 8 h and the sample was washed with Milli-Q+ water. Afterwards, a second pyrolysis was carried out on the acid leached sample in Ar at 800 oC for 1.5 h. The third new catalyst, Co-N/C_N2 (step 3 in Fig. 1), was synthesized analogously to the first catalyst but the pyrolysis gas was switched from Ar to N2 (AGA, 99.999%, 200 ml min−1). Next, the mixing solvent was changed from Milli-Q+ water to ethanol (≥95.0%, Sigma-Aldrich) to ensure complete dissolving of the N precursor and the catalyst prepared was denoted as Co-N/C_EtOH (step 4 in Fig. 1). A small amount of sulfuric acid (ACS reagent, 95.0%–97.0%, Sigma-Aldrich) was added to the N precursor prior to the mixing step resulting in the synthesis of the sulfur containing catalyst Co-N-S/C (step 5 in Fig. 1).
Next, the solution-based mixing step was replaced with dry milling the precursor mixture for 2 h at 300 rpm in a planetary ball mill (FRITSCH Pulverisette 6) containing 5 zirconia balls (20 mm diameter) and the prepared catalyst was named Co-N/C_BM (step 6 in Fig. 1). For comparison, a catalyst utilizing Vulcan® XC-72 (Fuel Cell Earth) as the carbon support material, Co-N/Vulcan, was additionally synthesized (step 7 in Fig. 1) to study the impact of the support material parameters (porosity, pore size distribution) on the catalytic characteristics. The Co content in all synthesized catalysts was calculated to be 5 wt%. For all of the synthesized catalysts the yield was nearly 70%.
All of the studied catalyst materials and the preparation conditions used are presented in Table II.
Table II. Synthesis conditions.
| No. in Fig. 1 | Catalyst | Carbon support | Precursors | Mixing environment | Pyrolysis gas | Post-treatment |
|---|---|---|---|---|---|---|
| 1 | Co-N/C | C | Co(NO3)26H2O |
Milli-Q+ water | Ar | — |
| 2,2'-bipyridine | ||||||
| 2 | Co-N/C_AL-p | C | Co(NO3)26H2O |
Milli-Q+ water | Ar | Acid leaching |
| 2,2'-bipyridine | Second pyrolysis | |||||
| 3 | Co-N/C_N2 | C | Co(NO3)26H2O |
Milli-Q+ water | N2 | — |
| 2,2'-bipyridine | ||||||
| 4 | Co-N/C_EtOH | C | Co(NO3)26H2O |
Ethanol | Ar | — |
| 2,2'-bipyridine | ||||||
| 5 | Co-N-S/C | C | Co(NO3)26H2O |
Ethanol | Ar | — |
| 2,2'-bipyridine | ||||||
| H2SO4 | ||||||
| 6 | Co-N/C_BM | C | Co(NO3)26H2O |
Ball-milling | Ar | — |
| 2,2'-bipyridine | ||||||
| 7 | Co-N/Vulcan | Vulcan® XC-72 | Co(NO3)26H2O |
Milli-Q+ water | Ar | — |
| 2,2'-bipyridine | ||||||
| — | Co'-N/C'51 | C' | Co(NH3)6Cl3 | Milli-Q+ water | Ar | — |
| 2,2'-bipyridine |
Characterization methods
Low-temperature N2 sorption
The porosity of the catalysts was analyzed with the low-temperature nitrogen sorption method. The samples were subjected to the measurements using an ASAP 2020 device (Micromeritics). The specific surface area values were attained using the Brunauer–Emmett–Teller (BET) multipoint theory.
Inductively coupled plasma mass spectrometry
Inductively coupled plasma mass spectrometry (ICP-MS) was used to study the total Co content in the catalysts. The samples were dissolved in hot Aqua Regia (3:1 HCl:HNO3, CarlRoth ROTIPURAN Supra acids) for 24 h, centrifuged at 4000 rpm for 20 min, and inserted into a spectrometer (ICP-MS, Agilent 8800) for the measurements.
High-resolution scanning electron microscopy and transmission electron microscopy
The analysis of the surface morphology was performed with a high-resolution scanning electron microscope (HR-SEM, Zeiss Merlin). The measurements were made at an operating voltage of 2 kV. The chemical composition of the prepared samples was determined using an energy dispersive X-ray spectroscopy (EDS) system (Bruker EDX-XFlash® 6/30 detector). An operating voltage of 7 kV was used for the EDS analysis and the concentrations of elements were calculated by using P/B-ZAF standardless mode.
The transmission electron microscopy (TEM) micrographs were obtained with a JEOL JEM-2100 device (JEOL GmbH, Eching, Germany) applying an acceleration voltage of 200 kV. Approximately 100 metallic particles were measured for each catalyst material in order to study the average particle size and analyze their particle size distribution.
X-ray photoelectron spectroscopy
The chemical composition of the Co-N/C catalysts was investigated using X-ray photoelectron spectroscopy (XPS). The measurement device was equipped with an electron energy analyzer (SCIENTA SES 100) and a non-monochromatic twin anode X-ray tube (Thermo XR3E2). Casa XPS software was used to analyze the collected data.55
Preparation of electrodes and three-electrode measurements
To prepare the catalyst ink, isopropanol (99.0%, Sigma-Aldrich), Milli-Q+ water, and Nafion® (∼5% solution, Sigma-Aldrich, Aldrich Chemistry) were added to a small amount of the studied catalyst powder and the mixture was treated in a cooled ultrasonic bath for 1 h. The catalyst ink was then deposited onto polished glassy carbon electrodes in 9 μl aliquots to attain a final loading of 1.0 ± 0.1 mg cm−2 for all of the studied catalyst materials.
The electrochemical behavior of the synthesized catalysts was studied using common electrochemical methods, namely RDE and cyclic voltammetry (CV). A three-electrode setup consisting of a large area glassy carbon electrode covered with the studied catalyst as the working electrode, a saturated calomel electrode (SCE, REF421, Radiometer analytical) as the reference electrode, and a glassy carbon rod as the counter electrode were used for the measurements. The measurements were conducted in a 0.1 M HClO4 solution (made from 67%–72% HClO4, Sigma-Aldrich, Fluka Analytical). Electrochemical impedance spectroscopy (EIS) data were used to correct the measured current values against the ohmic potential drop.
Membrane-electrode-assembly preparation
In order to study the selected catalysts in fuel cell conditions the catalyst inks were prepared by mixing the catalyst powders with isopropanol, Milli-Q+ water, and Nafion®. The amount of Nafion® was chosen so that the ionomer content was 25%. Firstly, the inks were treated in an ultrasonic bath for 30 min. Afterwards, magnetic stir bars were used to mix the catalyst inks overnight. As a final step, the catalyst inks were additionally treated with an ultrasonic probe immediately before the electrode coating stage.
The membrane-electrode-assemblies (MEAs) with a surface area of 5 cm2 were prepared using a Sono-Tek ExactaCoat ultrasonic spray coating device and a previously applied method with minor modifications.56 To achieve a cathode loading of 1.0 ± 0.1 mg cm−2, the studied catalyst ink (prepared from either Co'-N/C', Co-N/C or Co-N/C_BM) was fed at a flow rate of 0.34 cm3 min−1 into the AccuMist nozzle operating at 120 kHz and deposited onto a Nafion® 115 membrane, which was thereafter coated with the anode catalyst on the opposite side. For all of the prepared MEAs the anode was 60 wt% Pt/Vulcan (Fuel Cells ETC) with a constant catalyst loading of 1.0 ± 0.1 mg cm−2.
PEMFC measurements
The experiments were conducted using an in-house fuel cell test station comprised of a potentiostat/galvanostat (PGSTAT302N, FRA32M, Autolab) equipped with a booster (BOOSTER20A, Autolab). During the measurements the electrodes were fed with H2 and O2 at 100% relative humidity, a fixed flow rate of 200 ml min−1, and applying a backpressure of 100 kPa. The measurement cell was kept at a constant temperature of 60 oC. At first, the single cell was pre-conditioned at open cell potential (OCP) for 120 min and the corresponding values were recorded for all studied MEAs. Afterwards, polarization curves were measured by increasing the current in 0.2 A intervals and allocating 60 s collection time for each data point. The obtained measurement data were additionally used to calculate the power density curves. Finally, EIS was used to determine the electrolyte resistance values which were used to obtain the iR-corrected polarization curves.
Results and Discussion
Physical characterization
Low-temperature N2 sorption
The nitrogen sorption analysis method was used to study the specific surface area (SBET) of the porous carbon materials under study (Fig. 2). From the measurement results it is clear that the CDC supports used in our previous work51 and in this study are highly porous materials with extremely high surface area (SBET values are given in Fig. 2). Nonetheless, the carbon support utilized in this work has a considerably higher surface area (∼2100 m2 g−1) than the previously used catalyst support material (∼1400 m2 g−1), which is due to the doubly longer CO2 post-activation treatment. Modifying the carbon with cobalt and nitrogen significantly reduces the surface area of the material in the case of all studied catalysts. As a result of the more porous carbon support, almost all of the newly synthesized catalyst materials based on CDC have higher and roughly equal (∼1400 m2 g−1) surface areas compared to our previously studied catalyst (∼1000 m2 g−1).51 The measurement data show that modifying the synthesis parameters does not influence the final surface area of the catalysts prepared using the solution-based method. One clear exception is Co-N/C_BM, the catalyst prepared by ball-milling, which displays a surface area of roughly only 900 m2 g−1. This disparity shows that mixing the precursors together with the dry ball-milling method modifies the carbon support material further by reducing the surface area of the material roughly 40% more than in the case of using a solution-based preparation method. In contrast, the Co-N/Vulcan catalyst has a vastly smaller specific surface area of ∼200 m2 g−1.

Figure 2. The differential pore volume vs pore width plots for the studied materials and their specific surface area values (noted in figure).
Download figure:
Standard image High-resolution imageIt is interesting to note that according to the pore size distribution data (Fig. 2) the adsorption of cobalt-nitrogen complexes on the carbon support and the subsequent pyrolysis decrease not only the amount of micropores but also the amount of slightly larger mesopores within the range from 2 to 4 nm. Most of the studied catalysts prepared with the solution-based method in general display similar pore size distributions. However, the ball-milled material Co-N/C_BM has a significantly lower amount of micropores and especially mesopores. The difference in pore size distributions can again be explained by the different mixing methods used. This effect was also demonstrated by Ratso et al.57 studying similar M-N/C materials prepared via ball-milling and based on boron and titanium CDC.
ICP-MS
The obtained ICP-MS measurement data (Table III) show that the cobalt content of the synthesized catalysts is comparable to the 5 wt% of Co used in the catalyst precursor mixture. Consequently, relatively low amounts of cobalt were lost as a result of the synthesis procedure. It can be argued that the modification of the synthesis parameters did not significantly influence the final amount of cobalt in the catalysts, as the content of Co was within the margin of error for this type of measurement in almost all of the studied catalyst materials. However, the post-treated sample contained only 1.3 wt% of Co, indicating that the acid leaching was successful in removing a considerable portion of metal from the catalyst. Additionally, a small amount (0.2 wt%) of Zr was detected in Co-N/C_BM, which can be attributed to the zirconia balls used in the ball-milling procedure. This contamination effect has been previously demonstrated by other groups as well.53,58
Table III. Elemental characterization for the M-N/C catalysts.
| Elemental composition/wt% | |||||||
|---|---|---|---|---|---|---|---|
| ICP-MS | SEM-EDS | ||||||
| Catalyst | Co | C | O | N | Co | S | Si |
| Co-N/C | 3.8 | 89 | 5.4 | 3.4 | 2.4 | — | 0.3 |
| Co-N/C_AL-p | 1.3 | 90 | 5.2 | 3.1 | 0.8 | — | 0.7 |
| Co-N/C_N2 | 4.2 | 89 | 5.5 | 3.0 | 2.4 | — | 0.3 |
| Co-N/C_EtOH | 4.7 | 88 | 5.8 | 3.0 | 2.6 | — | 0.3 |
| Co-N-S/C | 4.7 | 88 | 5.6 | 2.9 | 2.6 | 0.2 | 0.4 |
| Co-N/C_BM | 5.1 | 89 | 4.9 | 3.2 | 2.8 | — | 0.3 |
| Co-N/Vulcan | 5.5 | 91 | 3.5 | 2.0 | 2.9 | 0.4 | 0.2 |
| Co'-N/C'51 | 5.8 | 87 | 6.6 | 3.8 | 2.1 | — | 0.5 |
HR-SEM and TEM
HR-SEM images were taken for all of the synthesized catalyst materials. Using Co-N/C as an example (Figs. 3a and 3b), it can be seen that the materials based on CDC are fairly inhomogeneous and consist of different-sized grains which are separated by pores of various sizes. Additionally, some of the carbon grains seem to also be porous themselves, indicating that these carbon materials are extensively porous systems. The carbon grains are decorated with small bright metallic particles which were later analyzed using TEM. According to the HR-SEM images, no significant differences in surface morphology were noticed between most of the catalyst materials based on CDC. Mixing the catalyst precursors together using dry ball-milling (instead of a solution-based method) changes the surface morphology of the catalyst extensively (Fig. 3c). Comparing the various HR-SEM images shows that ball-milling severely compresses the carbon grains together. The smaller carbon flakes are crushed into the larger pieces, forming sizeable new cavities in the micrometer scale which are not present in the solution-based catalysts. A more detailed image (Fig. 3d) indicates that ball-milling also changes the overall texture of the carbon grains. While the grain surfaces are relatively smooth for the catalysts prepared via a solution-based method (Fig. 3b), the grains of the ball-milled catalyst are much rougher and less flat.

Figure 3. HR-SEM images taken for (a), (b) Co-N/C and (c), (d) Co-N/C_BM.
Download figure:
Standard image High-resolution imageThe catalyst synthesized by using Vulcan as the carbon support displays an immensely different surface morphology (Fig. 4a) compared with Co-N/C (Fig. 3a). In this case, the material consists of nanoscopic spherical particles. These particles are more homogeneous in size and shape compared with the grains found in materials based on CDC and are separated by large cavities.
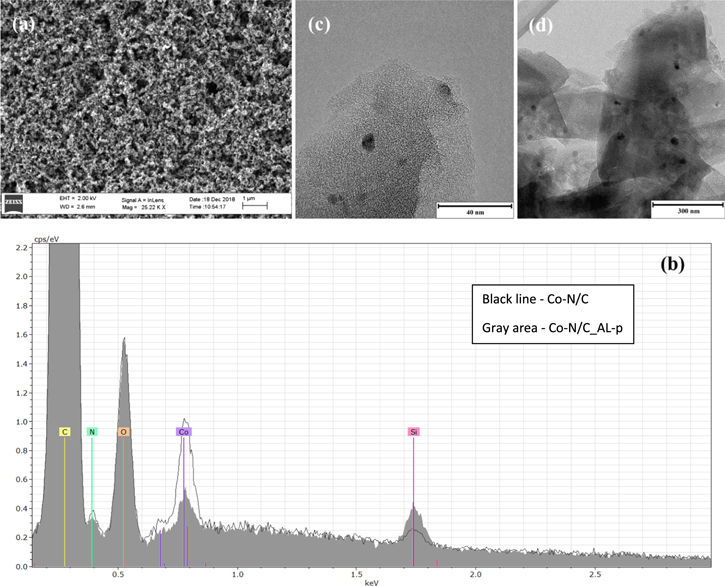
Figure 4. HR-SEM image taken for (a) Co-N/Vulcan and (b) SEM-EDS spectra comparing the elemental composition of Co-N/C and Co-N/C_AL-p (noted in figure). TEM images taken for (c) Co-N/C and (d) Co-N/C_AL-p.
Download figure:
Standard image High-resolution imageAt least three large regions (roughly 0.06 mm2 area) of every synthesized catalyst were also subjected to the EDS analysis in order to study their elemental composition (Table III). The content of carbon is fairly uniform amongst all of the studied catalyst materials at 90 wt%. Oxygen also constitutes a significant proportion of the catalysts at roughly 5 wt%. The cobalt content is rather consistent (∼2.6 wt%) in most of the studied catalysts. All of the catalysts based on CDC contain nitrogen ranging from 2.9 to 3.4 wt%. The percentage of nitrogen in Co-N/Vulcan was lower (at 2.0 wt%). Additionally, 0.2 wt% of sulfur was measured in Co-N-S/C, demonstrating that the catalyst was successfully co-doped with both N and S, but only to a small degree. A small amount of sulfur (0.4 wt%) was additionally detected in the catalyst Co-N/Vulcan, which can most likely be attributed to Vulcan itself. Finally, a small amount of silicon was found in all of the studied catalyst materials, which might originate from the quartz boat used in the pyrolysis step of the synthesis.
Regarding the post-treated catalyst Co-N/C_AL-p, a significant portion of the cobalt (from 2.4 wt% down to 0.8 wt%) was removed during the acid leaching process (Fig. 4b, Table III). This suggests that the cobalt clusters which are on the surface of the grains are largely removed during the acid leaching process. In contrast, the amount of nitrogen measured in the catalysts does not seem to be affected by the post-treatment to such an extent.24 Therefore, it can be argued that the post-treatment procedure mainly affects inactive metallic cobalt species and the active Co-Nx sites are largely unaffected.
The catalyst materials were additionally studied using TEM. For Co-N/C (Fig. 4c), the average size of the cobalt particles was 13 nm. Similar images were obtained for most of the other studied catalyst materials and the average particle sizes ranged from 12 to 14 nm. Additionally, the particle size distribution was found to be fairly independent of the used synthesis parameters. However, the TEM images obtained for the post-treated catalyst Co-N/C_AL-p (Fig. 4d) show that the average size of the cobalt particles is 23 nm, which is somewhat larger compared to the untreated catalyst Co-N/C. This may be caused by the second pyrolysis which promotes the agglomeration of cobalt particles.
XPS
The elemental composition of the catalysts was additionally studied with XPS. Nearly identical spectra were obtained for all of the studied catalysts (not shown here for shortness). It was found that in addition to carbon, cobalt, and nitrogen, the catalysts contain a considerable amount of oxygen. The nitrogen content in particular was analyzed further and the results ranged from 1.9 to 2.6 at% for the catalysts based on CDC (Table IV). A slightly lower amount of nitrogen, 1.7 at%, was found in Co-N/Vulcan, which is in agreement with the SEM-EDS results.
Table IV. XPS data for the M-N/C catalysts.
| Form of nitrogen/% | |||||||||
|---|---|---|---|---|---|---|---|---|---|
| Catalyst | C/at% | Co/at% | O/at% | N/at% | Pyridinic | Co-Nx | Pyrrolic | Graphitic | N–O species |
| Co-N/C | 89 | 0.2 | 8.4 | 2.2 | 19 | 22 | 29 | 20 | 7 |
| Co-N/C_AL-p | 94 | 0.05 | 4.1 | 2.2 | 18 | 29 | 31 | 16 | 5 |
| Co-N/C_N2 | 92 | 0.1 | 5.6 | 1.9 | 22 | 33 | 30 | 11 | 4 |
| Co-N/C_EtOH | 92 | 0.1 | 5.5 | 2.6 | 19 | 25 | 26 | 25 | 5 |
| Co-N-S/C | 93 | 0.2 | 4.0 | 2.4 | 15 | 34 | 35 | 12 | 5 |
| Co-N/C_BM | 88 | 0.02 | 9.5 | 2.4 | 23 | 30 | 30 | 12 | 6 |
| Co-N/Vulcan | 85 | 0.3 | 13.2 | 1.7 | 13 | 28 | 41 | 16 | 1 |
| Co'-N/C'51 | 94 | 0.5 | 5.5 | 1.4 | 36 | 26 | 27 | 6 | 6 |
The amount of Co established by XPS in the catalysts is noticeably lower than obtained by ICP-MS measurements. This difference is most likely caused by layers of carbon covering the cobalt particles as already discussed in our previous work.51 Nevertheless, deconvoluting the detailed Co2p3/2 spectra in general revealed 3 peaks for all the studied catalyst materials. These peaks can be assigned to metallic cobalt (778.1 eV), cobalt oxide species (779.8 eV), and Co-N4 moieties (782.0 eV).27,59,60 The measurement data showed that the catalyst materials contain mainly Co(II) species and a small amount of metallic cobalt. However, detecting cobalt in highly porous carbon materials is not very sensitive and therefore the analysis of the state of Co is difficult using XPS.43,60
The detailed nitrogen spectra were also analyzed and deconvoluted into 5 separate peaks each corresponding to various nitrogen forms/species: pyridinic, Co-Nx, pyrrolic, graphitic, and N–O.61 Considering the relatively large measurement error in this type of analysis, the overall nitrogen composition is fairly similar across all of the studied samples (Table IV). Therefore, no significant connection can be made between the nitrogen composition and the synthesis parameters applied in this work. In contrast, other groups have shown that the chemical structure is strongly influenced by the pyrolysis temperature,61,62 but in the present study the temperature was kept constant at 800 oC.
Electrochemical characterization
ORR activity analysis
The electrochemical behavior of the synthesized catalysts was initially characterized using the RDE method. Figure 5 shows the background current corrected ORR curves measured at 1500 rpm for all catalysts studied. It is clear that all of the catalyst materials based on CDC display high and quite similar ORR activities within the mixed kinetics regions and well-developed plateaus in the mass-transfer limited region (E < 0.3 V vs SCE).
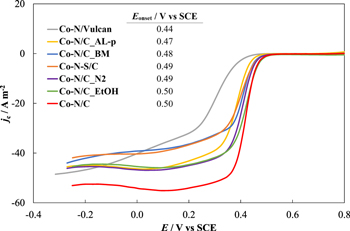
Figure 5. ORR curves measured for the synthesized catalysts (noted in figure). Conditions: 0.1 M HClO4 aqueous solution, 1500 rpm, scan rate 10 mV s−1.
Download figure:
Standard image High-resolution imageOnly small differences can be observed when considering the onset potential values (E value at which jc = −1.0 A m−2) of these catalysts (Fig. 5). This may be due to the similar nitrogen content established in the catalysts using HR-SEM and XPS (Tables III and IV). While the content of Co in the catalysts varies slightly according to ICP-MS measurements (3.7–5.1 wt%), it has previously been shown for similar materials that in this range the amount of cobalt does not significantly influence the final ORR activity of the catalysts.25,33 It has been suggested that this is caused by the saturation of Co-Nx active sites at a cobalt concentration larger than ∼3 wt%. Therefore, for the following analysis we focus on the synthesis parameters influencing the ORR activity.
The two materials with the highest onset potential values of 0.50 ± 0.01 V vs SCE were Co-N/C and Co-N/C_EtOH. Because these values are equal, it can be argued that enhanced solubility of the nitrogen precursor does not result in higher ORR activity when considering our solution-based synthesis method. Changing the pyrolysis gas from argon (Co-N/C) to the less expensive nitrogen (Co-N/C_N2) did not significantly impact the catalytic activity (ΔEonset ≈ 10 mV) of the catalyst as well. These two findings present an opportunity to optimize the catalyst synthesis method to be as cost-efficient as possible regarding the needs of large-scale manufacturing.
The ORR activity of the nitrogen and sulfur co-doped catalyst (Co-N-S/C) was nearly equal (ΔEonset ≈ 10 mV) compared to the activity of the catalyst doped with only N (Co-N/C). As a result regarding our catalysts, the addition of sulfur did not improve the activity and proved not to be beneficial as suggested by other groups.40–43 This could be due to the particularly low amount of S (only 0.2 wt% as confirmed by SEM-EDS) in our catalyst, since the synergistic effect of S and N was achieved by Sahraie et al.43 at a much higher sulfur to nitrogen ratio.
Despite the fact that the catalyst prepared via ball-milling displays a noticeably smaller specific surface area than the catalyst prepared via a solution-based method, the onset potential value of this material is only 20 mV lower. Therefore, no definite correlation between the two variables, i.e. the surface area and the ORR activity of a catalyst, can be made. It can be argued that in the case of our catalysts with extensive porosities the surface area is not the limiting factor regarding the ORR activity. Moreover, the amount of mesopores has been shown as beneficial to the electrochemical performance of platinum-based electrocatalysts.63 However, when comparing Co-N/C_BM and Co-N/C, two catalysts with distinctly different amount of mesopores in the range from 2 to 4 nm (Fig. 2), the increased mesoporosity does not seem to provide significantly enhanced ORR activity. This is further corroborated by the high activity (Eonset = 0.49 V vs SCE) of our previously studied catalyst Co'-N/C' which displays an almost identical pore size distribution compared to Co-N/C_BM and is thus noticeably less mesoporous than Co-N/C. The influence of the mixing conditions was also briefly studied by Zhao et al.19 who found no significant difference between the electrocatalytic activities of catalysts prepared by wet chemistry or ball-milling methods.
The common acid leaching and second pyrolysis post-treatment did not result in enhanced catalytic activity as it is often discussed in the literature.24,43,46,64 The post-treated sample Co-N/C_AL-p has a 30 mV lower onset potential value compared to the initial untreated catalyst Co-N/C. Pérez et al.24 proposed that the acid leaching and second pyrolysis procedure increases the ORR activity of a catalyst because the post-treatment step creates new active centers, increases the surface area or improves pore connectivity due to the formation of new mesopores. In their work, post-treating the catalyst increased the surface area by 60% and resulted in a 60 mV positive shift in the Eonset value. These changes were not observed in our case.
A more significant difference in activity can be seen when considering the onset potential of Co-N/Vulcan. This catalyst synthesized using a commercial Vulcan® XC-72 carbon powder as the carbon support is 60 mV less active than the most active catalyst synthesized with a CDC support material. The considerably lower activity of the Co-N/Vulcan catalyst can be correlated with reduced nitrogen content measured by HR-SEM and XPS compared to the other studied catalysts (Tables III and IV).
The comparable ORR activities of the catalysts based on CDC are also indicated in the Tafel-like plots constructed according to the Koutecky-Levich equation (Fig. 6). At lower current densities (log(∣jk∣ / A m−2) < 1.0) all of the catalysts based on CDC display relatively long nearly linear regions. For these catalysts, the slope values of the linear regions were ∼60 mV dec−1. However, the catalyst based on Vulcan® XC-72 exhibited a higher slope value of 81 mV dec−1 indicating more sluggish reaction kinetics compared to the catalysts based on CDC. Additionally, the Koutecky-Levich equation was used to calculate the number of electrons transferred in the reaction (nK-L), which was 3 or somewhat higher for all of the catalyst materials studied (Fig. 6 inset). Similar values have been calculated by other groups studying M-N/C type ORR catalysts based on cobalt in acid media as well.65
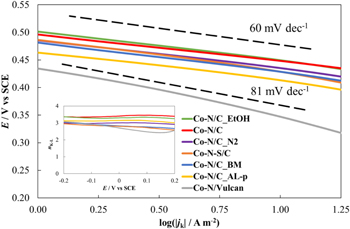
Figure 6. Tafel-like plots corresponding to the synthesized M-N/C catalysts (noted in figure). Inset- the number of electrons transferred in the potential range from −0.2 to 0.2 V vs SCE for the studied catalysts.
Download figure:
Standard image High-resolution imageNext, the synthesized catalysts were studied using the common CV method. The CV curves were measured in a 0.1 M HClO4 solution and well-defined oxygen reduction peaks were obtained for all of the studied catalysts (not shown here for shortness). Most of the synthesized materials have extremely similar ORR activities, with oxygen reduction peak potential (Ep) values of 0.41 V vs SCE at a scan rate of 5 mV s−1. A slightly lower Ep of 0.39 V vs SCE was obtained for the post-treated catalyst Co-N/C_AL-p. Thus, indicating that the post-treatment procedure did not improve the catalytic activity of the catalysts under study.
Once again, the importance of the carbon support material is pointed out by the peak potential values for Co-N/Vulcan. The measured Ep value is ∼100 mV lower than in the case of the CDC-based catalysts. This result indicates that the choice of the carbon support material has a much larger impact on the ORR activity of the catalysts than modifications in the synthesis parameters studied in this work. A similar conclusion was reached in a study conducted by Zitolo et al.66 where the differences in the activity of two otherwise very similar M-N/C type catalysts was caused by the different physico-chemical properties of the support material. It has been shown that even in the case of CDC, the origin carbide severely affects the final electrochemical performance of a catalyst.57,67 These studies also show that the ORR activity of the carbon support material itself cannot be used to predict the activity of a M-N/C catalyst derived from the carbon support.
ORR stability measurements
All of the studied catalysts were subjected to a previously developed stability testing protocol.33,51 The measurements consisted of daily ORR activity assessments at 24 h intervals using RDE and overnight potential cycling from −0.11 to 0.91 V vs SCE in an argon saturated solution at a scan rate of 1 mV s−1. This procedure was repeated for a total of 7 d.
The daily RDE measurements reveal that the current values decrease in time in both the mass-transfer limited and mixed kinetics regions similarly for all catalysts studied (Fig. 7 inset). After 7 d of measurements, a noticeable decline in activity can be observed, which was also established in our previous work studying similar M-N/C type catalysts.51 This activity loss can be caused by a variety of different processes.47 For instance, the leaching of cobalt from the active site in an acidic environment, the oxidation of both the carbon matrix or the active site by H2O2, the protonation of the active site, and even the corrosion of the carbon support under high potentials.

Figure 7. Activity decrease rates for the M-N/C catalysts (noted in figure). Inset- ORR curves measured for Co-N/C at the beginning and end of the stability measurements (3000 rpm, scan rate 10 mV s−1).
Download figure:
Standard image High-resolution imageIn order to evaluate the degree of ORR activity degradation the differences in initial and final working electrode potentials at a fixed current density (−25 A m−2) were calculated. These values were then divided by the duration of the stability measurements to obtain the activity decrease rates (ADR) (Fig. 7). The most stable catalyst proved to be Co-N/C with an ADR of 0.35 ± 0.05 mV h−1. Higher ADR values of ∼0.5 mV h−1 were observed for the other catalysts based on CDC. However, the addition of sulfur decreased the stability more noticeably and as a result, the catalyst co-doped with nitrogen and sulfur proved to be the least stable among the CDC-based catalysts. A similar result was obtained by Kramm et al. who demonstrated that a sulfur-free catalyst displayed better stability compared to a sulfur-containing catalyst in acidic media.68
The stability of Co-N/Vulcan was also studied in identical conditions. Indeed, the catalyst comprising of the commercial carbon powder proved to be considerably less stable, as the calculated ADR was 1.45 ± 0.05 mV h−1. This means that Co-N/Vulcan is almost five times less stable than our most stable catalyst Co-N/C. Therefore, the choice of the carbon support characteristics is critical when catalysts with high ORR activities and stabilities are desired. Furthermore, this stark difference in stability between the Vulcan-based and CDC-based catalysts illustrates that the carbon support materials characteristics are much more important than the synthesis parameters applied for the preparation of the catalysts studied in this work.
Fuel cell testing
Three catalysts, Co'-N/C', Co-N/C, and Co-N/C_BM, were selected for fuel cell testing. First, the catalyst Co'-N/C' has already been studied in a three-electrode setup in our previous study and has been found to have high ORR activity.51 The second catalyst chosen was Co-N/C, as this material was found to be the most active and stable of the catalysts synthesized and studied in this work. Finally, the catalyst Co-N/C_BM displayed unique surface morphology (Figs. 4c and 4d) due to the severely different mixing procedure compared to the other studied catalysts. Additionally, while almost all of the studied catalysts based on CDC behaved similarly in RDE measurements, the three chosen catalysts proved to be the most variable and interesting from the physical characterization point of view.
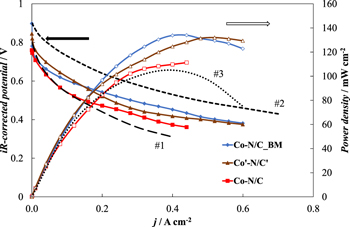
Figure 8 shows the measured polarization curves for the studied catalyst materials after iR-correction and the power density curves calculated from the as-measured data. From the results, it can be seen that the tested materials behave very similarly in the single cell tests. While the measured OCP values differ slightly between the catalysts, the polarization curves start to converge more as the current density is increased.
Figure 8. iR-corrected polarization curves and power density curves measured in a single cell for three M-N/C catalyst materials studied (noted in figure). Dashed lines (#1 and #2) illustrate measurement data estimated from Ref. 35 and dotted line (#3) from Ref. 48.
Download figure:
Standard image High-resolution image
Direct comparison of established results obtained by other workgroups is difficult because of the wide variety of different measurement conditions utilized.14 For example, it has been shown that the ionomer content in the catalyst can be optimized to severely improve the final performance of a single cell.35 From that work, two polarization curves which were obtained at a loading of 1.0 ± 0.1 mg cm−2 with M-N/C type catalysts synthesized by ball-milling iron(II) acetate, 1,10-phenanthroline, and Black Pearls 2000 have been added to Fig. 8 (noted as #1 and #2). For the sake of an effective comparison the first added polarization curve (#1) was chosen so that the ionomer to catalyst ratio is as similar as possible to the ratio used in the present work. The activity of this reference catalyst is comparable to the activity achieved with the three catalysts studied here. However, the second added curve (#2) was obtained when the ionomer content in the catalyst was optimized by increasing it by roughly four times. In that case, immensely larger current density values were achieved indicating the severe importance of optimizing the ionomer to catalyst ratio in electrodes prepared from M-N/C type ORR catalyst materials.
Maximum power density values of 135 mW cm−2 were reached for the catalysts Co-N/C_BM and Co'-N/C' and a slightly lower value of 110 mW cm−2 was established for the catalyst Co-N/C. A number of groups studying M-N/C type catalysts have reported similar power density values when applying comparable measurement conditions.69,70 For instance, Osmieri et al.48 utilized a facile one-pot synthesis method using a silica templating agent to synthesize a M-N/C catalyst material based on Fe which was studied in a single cell operating at 60 oC. In that work a maximum power density of 105 mW cm−2 (line noted as #3 in Fig. 8) was reached at a catalyst loading of 2.5 mg cm−2 compared to the 135 mW cm−2 achieved here with a lower loading of 1.0 ± 0.1 mg cm−2. It has been shown that several parameters can be further optimized to increase the final activity of a single cell, e. g. the rational design of the catalyst layer.4,49
The different behavior of Co-N/C and Co-N/C_BM in RDE and fuel cell measurements can be explained by a number of factors. Firstly, the RDE measurements were done in a HClO4 solution while the environment in a PEMFC more closely resembles sulfuric acid due to the chemical structure of the ionomer. Additionally, the used ionomer content in the catalyst materials was noticeably different in the RDE and PEMFC tests. This becomes an issue because it has previously been shown that varying the ionomer content influences the catalytic activity of different M-N/C type catalysts differently.35 Therefore, it is difficult to correctly predict the activity of a catalyst material in a PEMFC based on data obtained in RDE measurements.
Conclusions
In this work, a previously studied facile synthesis method was used as a basis to synthesize seven M-N/C type ORR catalyst materials while varying the synthesis conditions:
- Metal source Co(NO3)2, 2,2-bipyridine, and a high surface area silicon carbide derived carbon (CDC) mixed together in water and pyrolyzed in argon
- Precursor mixing environment changed from water to ethanol
- Pyrolysis gas switched from Ar to N2
- Catalyst additionally doped with S
- Post-treatment—acid leaching and second pyrolysis
- Solution-based method changed to a dry ball-milling procedure
- Commercial Vulcan® XC-72 used as a carbon support material
According to the electrochemical measurements conducted in 0.1 M HClO4 solution, the most active and stable ORR catalyst proved to be the material mixed together in water and pyrolyzed in argon. This catalyst material displayed a high onset potential (Eonset) value of 0.50 V vs SCE and a low activity decrease rate (ADR) of 0.35 mV h−1. Most of the other catalysts based on CDC exhibited similar ORR activity with Eonset values in the range from 0.50 to 0.47 V vs SCE and ADR values of roughly 0.5 mV h−1. The catalyst additionally doped with S was less stable with an ADR value of 0.74 mV h−1. In contrast, the catalyst based on Vulcan® XC-72 was exceptionally less active and less stable compared to the CDC-based catalyst materials studied. Therefore, the carbon support material characteristics appeared to be the largest influencer of the final performance of M-N/C type ORR catalysts.
Three M-N/C catalyst materials were chosen based on the largest differences in specific surface area and surface morphology identified via the physical characterization methods and studied further in a PEMFC experiment. The highest maximum power density value of 135 mW cm−2 was reached at a low cathode catalyst loading of 1.0 ± 0.1 mg cm−2 and cell operating temperature of 60 oC for the catalyst prepared by ball-milling. The achieved performances can be further improved by optimizing the ionomer to catalyst ratio. Consequently, mixing the catalyst precursors together via dry ball-milling without the use of any additional chemicals seems to be the most economically viable option.
The results of this work indicate that tuning the synthesis parameters studied here does not have a substantial effect on the ORR activity of the catalysts. This presents an opportunity to choose the synthesis parameters so that the catalyst manufacturing process is as cost-effective and environmentally friendly as possible.
Acknowledgments
This work was supported by the EU through the European Regional Development Fund under projects TK141 "Advanced materials and high-technology devices for energy recuperation systems" (2014–2020.4.01.15–0011), NAMUR 'Nanomaterials—research and applications' (3.2.0304.12–0397) and by the Estonian institutional research grant No. IUT20–13.