
Abstract
Electrosynthesis of ammonia using nitrogen and water provides a potential alternative to the thermochemical process (Haber-Bosch) in a clean, sustainable, and decentralized way when electricity is generated from renewable sources. To enable the widespread commercialization of this technology, an electrocatalyst to convert nitrogen (N2) to ammonia (NH3) with high selectivity and activity must be developed. Here, we report our findings in the investigation into the role of incorporating palladium (Pd) in bimetallic Au-Ag nanocages on the electrocatalytic activity of the nitrogen reduction reaction (NRR) under ambient conditions. The localized surface plasmon resonance (LSPR) peak position of the resulting trimetallic nanoparticles is tuned with Pd concentration, achieving the highest electrocatalytic NRR activity (NH3 yield rate = 5.80 μg cm−2 h−1, Faradaic efficiency = 48.94%) using Au-Ag-Pd-850 nanoparticles at −0.3 V vs RHE. This activity corresponds to the production energy efficiency of 28.9% with an electrical energy input of 19.1 MWh / ton NH3. The enhanced NRR activity is attributed mainly to the formation of a highly porous Pd layer with remarkably high surface area active for NRR. In addition, operando surface-enhanced Raman spectroscopy (SERS) is used to probe the mechanism of NRR on the trimetallic nanostructures and to identify the intermediate species at the electrode-electrolyte interface.
Export citation and abstract BibTeX RIS

This is an open access article distributed under the terms of the Creative Commons Attribution 4.0 License (CC BY, http://creativecommons.org/licenses/by/4.0/), which permits unrestricted reuse of the work in any medium, provided the original work is properly cited.
This was paper 2220 presented at the Atlanta, Georgia, Meeting of the Society, October 13–17, 2019. This paper is part of the JES Focus Issue on Heterogeneous Functional Materials for Energy Conversion and Storage.
Ammonia is one of the most widely produced commodities in the world, with 146 million tons being produced globally in 2015 with an estimated increase in production of 3%–5% per year.1 Ammonia is used in numerous applications, most notably as a vital agrochemical and as a precursor for pharmaceutical products.2–4 In addition to its widespread utility, ammonia also holds great promise as a carbon-neutral liquid fuel for storing intermittent renewable energy sources when supply exceeds demand in the grid as well as for power generation due to the compound's high energy density (5.6 MWh ton−1) and hydrogen content (17.6 wt%).5 The conventional thermochemical process (i.e., Haber-Bosch process) for ammonia synthesis is capital- and energy-intensive, consuming 1%–2% of the global annual energy supply and 60% of the worldwide hydrogen production, and it emits 1%–2% of global CO2 annually.1,6 Renewably derived electrochemical synthesis of ammonia could provide a clean, sustainable, and decentralized route to the thermochemical process.7
The lack of an active electrocatalyst to convert N2 to NH3 with high selectivity and activity is a bottleneck for the large scale electrosynthesis of ammonia under ambient conditions.8 Single-atom and hybrid Au electrocatalysts have shown relatively high activity due to the ability of Au to strongly adsorb and break N N through the associative mechanism, with further sequential hydrogenation to form adsorbed N2Hx species (1 < x < 4); the rate-determining step is N2 dissociation (reduction of N2* to generate N2H*).9–14 It has been demonstrated that the rate-determining step kinetics is accelerated on transition metal hydrides, where H* species on the catalyst surface directly react with the dissolved nitrogen in the electrolyte to form N2H*.15–17 In addition, a lithium mediated strategy (Li+
  Li
Li  Li3N
Li3N  NH3) on the transition metal catalyst could enhance the electrochemical NRR activity at low temperatures due to lithium's unique ability to break the nitrogen triple bond, followed by hydrogenation to generate ammonia.18–20
In our previous studies, we demonstrated the use of shape and pore-size controlled Au and bimetallic Au-Ag nanocages, with tunable localized surface plasmon resonance (LSPR) peak positions, as electrocatalysts for ammonia synthesis in an ionic aqueous solution with Faradaic efficiency >35%.21–23 The optimization of the structure, morphology, and composition is critical to enhancing the rate of electro-reduction of N2 to NH3.22,23 We found that Au is catalytically more active than Ag in both photo- and electrochemical NRR.22,24 Therefore, it is desired to replace Ag with another catalytic transition metal with higher NRR activity. This new metal must correctly modify the electronic structure of the nanoparticles by shifting the d-band center to ensure the optimum binding energy of an adsorbed species on the catalyst surface.25 It was demonstrated that the electrochemical NRR takes place on the surface of Pd catalyst through the formation of Pd hydrides (PdHx) at low overpotentials, followed by surface hydrogenation reactions.17 The formation of PdHx could weaken Pd −H bonding (proton adsorption strength on the Pd surface), leading to enhanced binding of Pd surface with N2 and N-containing adsorbates. Here, we aim to investigate the role of incorporating palladium into bimetallic Au-Ag nanostructures on the electrocatalytic NRR activity in 0.5 M LiClO4 (aq.) solution. Since the reduction potential of Pd (∼0.65 V vs RHE) is higher than that of Ag (∼0.5 V vs RHE) but lower than that of Au (∼1.2 V vs RHE), Ag can only be replaced with Pd in the galvanic replacement process after the addition of Pd salt (K2PdCl4 (aq.)) in the bimetallic Au-Ag nanostructures template. The red shifting of the LSPR peak position of the trimetallic nanostructures indicates either the replacement of Ag with Pd or the growth of Pd on Au. We also report energy input (MWh ton−1NH3) and production energy efficiency (%) of ammonia in the N2 electrolysis system using our synthesized nanocatalysts, and we compare our results with the state-of-the-art Haber-Bosch system.
In situ and operando surface-enhanced spectroscopy is a technique well suited to probe electrochemical reactions at the electrode/electrolyte interface, and several studies have shown a great success for studying electrocatalytic water splitting and CO2 reduction reactions.26–28 Recently, surface-enhanced infrared absorption spectroscopy (SEIRAS) was used to determine electrocatalytic NRR mechanisms on Au and Pt surfaces.29 Operando surface enhanced Raman spectroscopy (SERS) allows for the detection of intermediate species even in low abundance and is used for the determination of NRR mechanisms using trimetallic Au-Ag-Pd nanostructures.
Results and Discussion
Bimetallic porous Au-Ag nanocages with an LSPR peak position at 650 nm are synthesized by the galvanic replacement method by adding HAuCl4 (aq.) solution to a solution of solid silver nanocubes (AgNCs) (Figs. 1a and 1b).21–24 Trimetallic Au-Ag-Pd nanostructures are synthesized by adding K2PdCl4 (aq.) solution to the porous bimetallic Au-Ag nanocages dispersed in DI water with the LSPR peak at 650 nm. The volume of the Pd2+ precursor added to the Au-Ag template, and subsequent reduction of Pd2+ to Pd0 (two Ag atoms are replaced with one palladium atom), is controlled by measuring the redshift in the LSPR peak positions of nanoparticles. As the amount of Pd salt solution increases, the amount of redshift and the LSPR bandwidth increases (Fig. 1a). Excessive addition of Pd salt results in aggregation and collapsing of the nanocages. The LSPR peak of the resulting trimetallic Au-Ag-Pd redshifts from 650 nm to 850 nm; indicating the replacement of the remaining Ag atoms in the Au-Ag nanocages with Pd atoms (galvanic replacement) or the growth of Pd on Au (Fig. 1). Due to the lattice mismatch between Pd (3.890  ) and Au (4.079
  ), when Pd2+ precursor is added to the solution of Au-Ag nanocages, islands of palladium are formed on the Au surface. By further addition of the Pd salt solution, the islands are grown more, building a highly rough and porous surface (Figs. 1c and 1d).

Figure 1. UV-Vis extinction spectra of silver nanocubes, bimetallic Au-Ag nanocages, and trimetallic Au-Ag-Pd nanoparticles with the LSPR peak positions at 750 nm and 850 nm. TEM images of (b) Au-Ag-650, (c) Au-Ag-Pd-750, and (d) Au-Ag-Pd-850. Silver nanocubes with the LSPR peak position at 412 nm are used as a template to synthesize various bimetallic and trimetallic nanoparticles.
Download figure:
Standard image High-resolution imageScanning transmission electron microscopy (STEM) and energy dispersive X-ray (EDX) spectroscopy are performed on a single trimetallic nanostructure to determine the structure, the elemental composition, and distribution of Au-Ag-Pd-750 and Au-Ag-Pd-850 nanoparticles (Fig. 2). For Au-Ag-Pd-750, Pd islands are distributed in the Au-Ag nanocages structure, indicating the successful incorporation of Pd into bimetallic Au-Ag nanocages, and the synthesis of trimetallic Au-Ag-Pd nanoparticles (Figs. 2a–2f). By increasing the amount of Pd salt solution and red shifting the LSPR peak from 750 nm to 850 nm, a continuous porous layer of Pd is formed at the exterior surface of the nanoparticles (Figs. 2g–2l). In addition, inductively coupled plasma emission spectroscopy (ICPES) measurements reveal that by adding the Pd salt solution into the Au-Ag nanocages, the Au content remains relatively unchanged while the Ag content decreases from 2.68 mg l−1 to 1.35 mg l−1 when the LSPR peak redshifts from 650 nm to 850 nm (Table I). This indicates that the galvanic replacement of Ag atoms with Pd ions is one of the mechanisms for the reduction of Pd2+ to Pd0 in which the concentration of Pd increases to 1.23 mg l−1 and 2.77 mg l−1 as the LSPR peak redshifts to 750 nm and 850 nm. The stoichiometric balance between Ag and Pd (Pd2+(aq.) + 2Ag0(s) Pd0(s) + 2Ag+(aq.)) and the Pd and Ag contents in Table I reveal that the reduction of Pd2+ to Pd0 is also accomplished through the island-growth mode on Au atoms (Fig. 2i).30,31
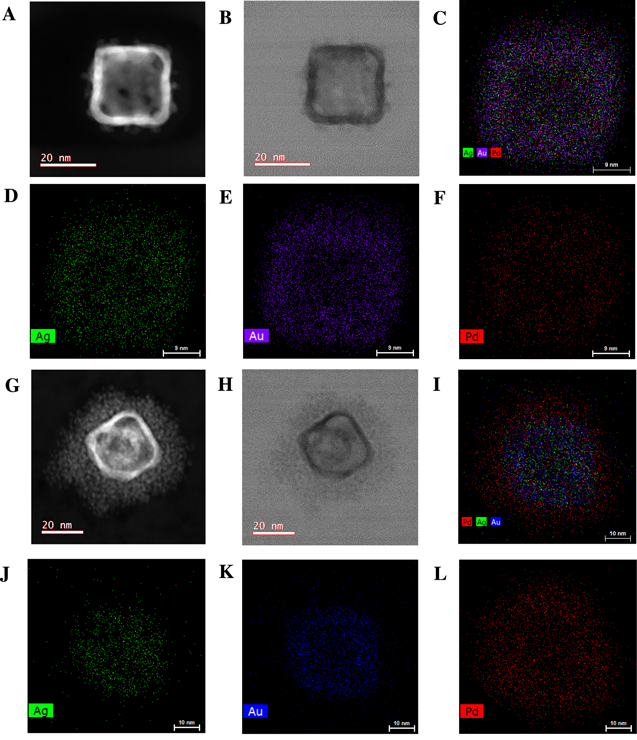
Figure 2. STEM (a), HRTEM (b), and EDX elemental mapping (c, d, e, f) of a representative single Au-Ag-Pd-750 nanoparticle. STEM (g), HRTEM (h), and EDX elemental mapping (i, j, k, l) of a representative single Au-Ag-Pd-850 nanoparticle.
Download figure:
Standard image High-resolution imageTable I. Au, Ag, and Pd concentrations of nanoparticles are determined by inductively coupled plasma emission spectroscopy (ICPES). The electrochemical surface areas (ECSA) of nanoparticles are determined based on the reduction peak of Au oxide and Pd oxide during CV measurements in Ar-saturated 0.1M LiOH solution at a scan rate of 50 mV s−1.
| Catalyst | Ag Conc. (μg ml−1) | Au Conc. (μg ml−1) | Pd Conc. (μg ml−1) | Au Contenta) (at. %) | Pd Content (at. %) | ECSAAu (m2 g−1) | ECSAPd (m2 g−1) |
|---|---|---|---|---|---|---|---|
| Au-Ag-650 | 2.68 | 1.32 | NA | 21.25 | NA | 23.3 | NA |
| Au-Ag-Pd-750 | 1.88 | 1.31 | 1.23 | 18.66 | 32.43 | 20.8 | 291.4 |
| Au-Ag-Pd-850 | 1.35 | 1.29 | 2.77 | 14.52 | 57.72 | 22.2 | 345.4 |
a)atomic content is calculated using Au, Ag, and Pd concentrations divided by the molar mass of Au (196.97 g mol−1), Ag (107.87 g mol−1) and Pd (106.42 g mol−1).
X-ray photoelectron spectroscopy (XPS) results of Au-Ag-Pd-850 nanoparticles reveal a spin–orbit doublet for Au 4 f at 84.0 eV and 87.7 eV which is consistent with our prior study, indicating that the zero-valence state of Au (Au0) is preserved after the addition and reduction of the Pd2+ precursor in bimetallic Au-Ag nanocages (Fig. 3a).24 The Ag 3d doublet energy peaks at 367.9 eV and 373.9 eV slightly shifts to lower binding energy (0.2 eV) compared to the Ag 3d doublet in bimetallic Au-Ag nanocages; this is attributed to the interaction and charge distribution of metallic Ag0 and Pd precursors that occur after galvanic replacement (Fig. 3b).32 The Pd 3d spectrum is deconvoluted into two pairs of doublets. The doublet peaks at 335.8 eV, and 340.8 eV correspond to Pd at zero-valence state, suggesting the successful incorporation of Pd0 in the bimetallic Au-Ag nanocages. The doublet peaks at higher binding energies and with lower intensities than those of zero-valence Pd metal (337.1 eV and 342.5 eV) are attributed to the oxidized Pd states (Pdn+) (Fig. 3c).33 The X-ray diffraction (XRD) patterns of Au-Ag-Pd and Au-Ag nanocages indicate the presence of metallic Pd which is evident from the three distinct peaks at higher 2  angles (40.4o, 46.9o, 68.4o) in Au-Ag-Pd compared to those of the Au-Ag nanocages (38.3o, 44.6o, 64.7o) (Fig. 3d).

Figure 3. XPS spectra of (a) Au 4f, (b) Ag 3d, and (c) Pd 3d of Au-Ag-Pd-850 nanoparticles. All spectra were shift corrected using a standard reference C1s, C-C peak at 284.8 eV. (d) XRD pattern of Au-Ag and Au-Ag-Pd nanocages. The Pd diffraction peaks shift to higher 2 angles due to the smaller lattice parameter (3.890
 ) compared to those of Au (4.079 Å) and Ag (4.086 Å).
Download figure:
Standard image High-resolution imageThe electrochemical surface area (ECSA) of the Au-Ag-Pd nanoparticles is determined using a three-electrode cell with a rotating disk electrode (RDE) and performing cyclic voltammetry (CV) in an Ar-saturated 0.1 M LiOH (aq.) at zero rotation rate at a scan rate of 50 mV s−1. The ECSAPd is calculated from the reduction peak of Pd oxide after double-layer correction and a charge density of 424 μC cm−2Pd (Fig. 4a and Table I). The ECSAs of the nanoparticles are normalized to the Pd and Au loading on the working electrode, obtained from ICPES measurements (Table I). Au-Ag-Pd-850 has a higher surface area (345.4 m2 g−1) compared to the Au-Ag-Pd-750 (291.4 m2 g−1). This can be attributed to the existence of a thick porous layer of Pd at the exterior surface of the Au-Ag-Pd-850 nanoparticles, which increases the ECSA for catalytic reactions. It is well known that rough surfaces are catalytically more active than smooth surfaces, as atoms present on rough surfaces are more thermodynamically active.30,34 The ECSAPd obtained using our trimetallic Au-Ag-Pd-850 nanoparticles is approximately five times higher than the ECSAPd of the commercial Pd/C catalysts.17,35 Although the reduction peak area of Pd oxide is remarkably higher than that of Ag oxide, due to the comparable reduction potentials of these two metal oxides, the reduction peak area of Ag oxide is subtracted from the actual reduction peak area centered at around 0.5 V vs RHE to determine the ECSAPd (Fig. 4a). The observed negative shift in the electrochemical reduction of Pd oxide (∼0.1 V) in our trimetallic nanostructures, compared to the pure Pd, is attributed to the slight alloying of Pd and Ag at their interface during the galvanic replacement reaction.36 The ECSAsAu of trimetallic Au-Ag-Pd nanoparticles is comparable (∼0.93) to the ECSAsAu of bimetallic Au-Ag nanocages (Table I).22 This indicates that the incorporation of Pd in bimetallic Au-Ag nanocages does not result in blocking the Au active sites for electrochemical NRR and confirms the preservation of the hollow structure in trimetallic nanoparticles where Au, Ag, and Pd can act as catalytically active centers for the reaction.

Figure 4. (a) Cyclic voltammograms (CV) of Au-Ag-Pd-750 and Au-Ag-Pd-850 in Ar-saturated 0.1M LiOH (aq.) at a scan rate of 50 mV s−1. The CV measurements were conducted in the rotating disk electrode (RDE) setup at the stagnant electrode condition at room temperature. (b) Linear sweep voltammograms (LSV) of various catalysts in N2-saturated 0.5 liClO4 (aq.). (c) LSV tests of Au-Ag-Pd-750 and Au-Ag-Pd-850 in an Ar− and N2−saturated 0.5 M LiClO4 (aq.) under ambient conditions with the scan rate of 10 mV s−1.
Download figure:
Standard image High-resolution imageLinear sweep voltammetry (LSV) tests are performed in N2-saturated 0.5 M LiClO4 (aq.) electrolyte in an H-type cell, where a proton exchange membrane separates anodic and cathodic compartments. A neutral pH electrolyte was selected in this study based on our optimization of electrolytes' pH to obtain the highest electrocatalytic NRR activity.22 A remarkably higher current density is achieved using Au-Ag-Pd-750 and Au-Ag-Pd-850 nanoparticles compared to the bimetallic Au-Ag-715 nanocages (the best bimetallic Au-Ag nanocatalyst obtained in our previous study22) (Fig. 4b). For instance, at an applied potential of −0.3 V vs RHE, the current density increases ∼4.8 and ∼3.7 times for Au-Ag-Pd-850 and Au-Ag-Pd-750 compared to the Au-Ag-715. This observation is consistent with significantly higher ECSAPd compared to the ECSAAu (Table I) in trimetallic Au-Ag-Pd nanoparticles, which provides more active sites for nitrogen adsorption and reduction. Although achieving high current density at low overpotentials does not necessarily indicate the high selectivity and activity of an electrocatalyst toward NRR, it is the primary step toward the high production rate that is mandatory for reaching the overarching goal of commercializing electrochemical NRR for sustainable ammonia production.
The selectivity performance ( ) of trimetallic Au-Ag-Pd nanoparticles is evaluated toward NRR. For both electrocatalysts (i.e., Au-Ag-Pd-750 and Au-Ag-Pd-850), the higher current density was achieved in N2-saturated electrolyte compared, to the Ar-saturated electrolyte, within the wide potential window (Fig. 4c). Unlike the bimetallic Au-Ag nanocages demonstrated in our previous study,22 the selectivity performance of electrocatalysts improves at low overpotentials (0 V to −0.3 V vs RHE) toward NRR after the incorporation of Pd into the bimetallic Au-Ag nanocages (Fig. 4c). In addition, both electrocatalysts are selective toward NRR until the high negative potential of ∼−0.75 V vs RHE, even with an enhanced current density that is achieved using trimetallic nanostructures. This expands the selectivity of an electrocatalyst toward NRR in negative potentials by 0.15 V over that of Au-Ag nanocages. Moving toward more negative potentials than −0.75 V, a hydrogen evolution reaction (HER) becomes dominant. Here, we focus on the potential window of −0.3 to −0.5 V vs RHE, which is a compromise of obtaining high current density and selectivity. It is important to note that achieving a high current density for NRR is crucial to decrease the capital cost, leading to the commercialization of electrochemical NRR. At all three applied potentials, the selectivity is higher for Au-Ag-Pd-850 than for the Au-Ag-Pd-750; this is attributed to the higher Pd content and lower Ag content of Au-Ag-Pd-850 nanoparticles (Table II). Even though the selectivity is not substantially higher in trimetallic Au-Ag-Pd nanostructures than in the bimetallic Au-Ag nanocages, due to the enhanced current density obtained (
 ) using Au-Ag-Pd nanoparticles, the corresponding current density toward NRR (
 ) is much more pronounced after incorporation of Pd into Au-Ag nanocages.
Table II. Selectivity performance of trimetallic Au-Ag-Pd nanoparticles with LSPR peak positions at 750 nm and 850 nm toward NRR.
| Potential (V vs RHE) | |||
|---|---|---|---|
| Electrocatalyst | −0.3 | −0.4 | −0.5 |
| Au-Ag-Pd-750 | 56.8 | 58.8 | 34.1 |
| Au-Ag-Pd-850 | 76.3 | 67.8 | 44.8 |
Chronoamperometry (CA) tests are performed at a series of applied potentials using Au-Ag-Pd-750 and Au-Ag-Pd-850 nanoparticles to determine the ammonia yield rate and FE (Figs. 5a and 5b). The highest ammonia yield rate (13.74 μg cm−2 h−1) is obtained at −0.4 V corresponding to an FE of 44.11% while the highest FE (48.94%) is achieved at −0.3 V (ammonia yield rate = 5.80 μg cm−2 h−1) using Au-Ag-Pd-850. The higher ammonia yield rate but lower FE at −0.4 V, compared with −0.3 V, is attributed to the compromise between increasing current density and competitive selectivity toward HER rather than NRR. For all potentials tested, both the NH3 yield rate and the FE are higher when Au-Ag-Pd-850 is used than when Au-Ag-Pd-750 is used. This result suggests that Pd content and ECSAPd of nanoparticles have a role in promoting the electrocatalytic NRR activity (Fig. 5b). In addition, greater Pd content in Au-Ag-Pd-850 compared to that of Au-Ag-Pd-750 results in an upshift of the d-band center (E − Ef) from −4.45 eV to −3.73 eV, which was determined via ultraviolet photoelectron spectroscopy (UPS) measurements (Fig. S4, available online at stacks.iop.org/JES/167/054511/mmedia). This leads to improved binding strength of N-containing adsorbates with the catalyst surface, which is a crucial step for engineering selective and active NRR catalysts in an aqueous solution where selectivity is a major challenge.
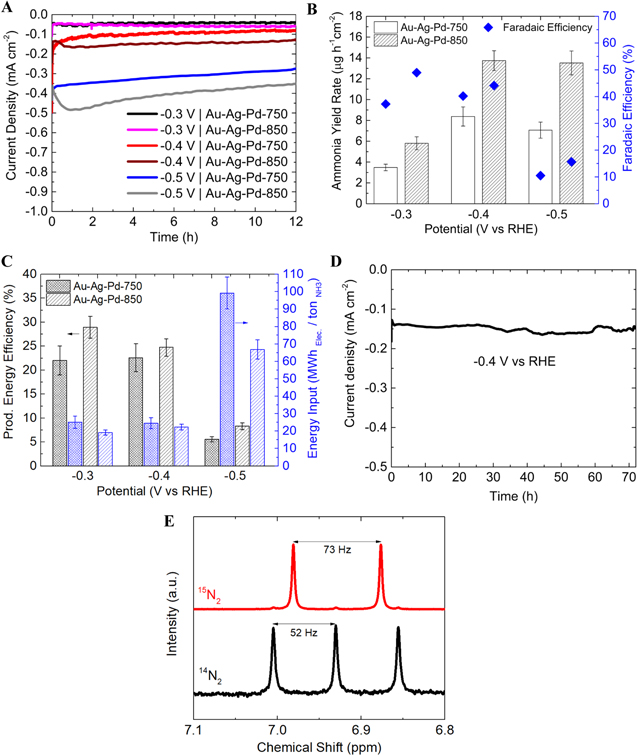
Figure 5. (a) CA results of Au-Ag-Pd-750 and Au-Ag-Pd-850 nanocatalysts at a series of potentials. (b) Ammonia yield rate and Faradaic efficiency at various potentials in 0.5 M LiClO4 (aq.) solution using Au-Ag-Pd-750 and Au-Ag-Pd-850 nanocatalysts. (c) Production energy efficiency and energy input at various applied potentials using Au-Ag-Pd-750 and Au-Ag-Pd-850 nanocatalysts. The intense bars (black bars show production energy efficiency and blue bars show energy input) represent Au-Ag-Pd-750 and the medium bars represent Au-Ag-Pd-850. (d) CA test for the stability of the Au-Ag-Pd-850 at −0.4V vs RHE in 0.5 M LiClO4 (aq.) solution. (e) 1H-NMR spectra of samples after electrochemical 15N2 (14N2) reduction reaction at −0.4V vs RHE for 4 h in 0.5M LiClO4 (aq.) solution.
Download figure:
Standard image High-resolution imageHere, we also report the two critical parameters (i.e., production energy efficiency (%) and energy input (MWh Elec./ton NH3)) in evaluating the performance of the N2 electrolysis system, which is neglected in most electrochemical NRR studies in the literature. The highest production energy efficiency (28.9%) is achieved using Au-Ag-Pd-850 at −0.3 V, which corresponds to the electrical energy input of 19.1 MWh/ton NH3. Moving toward more negative potentials, the production energy efficiency decreases to 24.8% at −0.4 V and 8.3% at −0.5 V, mainly due to the significant increase in current density at more negative potentials, which increases the electrical energy input (Fig. 5c). It is noted that the increase in the production energy efficiency is in line with the decrease in the electrical energy input for various applied bias. Similar to the electrocatalytic NRR activity results (Fig. 5b), both production energy efficiency and energy input deteriorate for Au-Ag-Pd-750 compared to Au-Ag-Pd-850 in various applied potentials (Fig. 5c). Currently, a significant portion of the input electrical energy ( 75%) for all conditions is consumed at the anode side, where oxygen evolution reaction (OER) takes place. Alternative use of organic-based electrolytes (e.g., glycerol) in the anodic half-reaction could remarkably lower the electricity consumption.37 It is worth mentioning that the-state-of-the-art thermochemical process (Haber-Bosch) for ammonia synthesis consumes the energy of 7.8 MWh/ton NH3 (based on natural gas), and the target production energy efficiency of ARPA-E program (REFUEL) for electrochemical fuel production is greater than 60%.5
A CA test is performed at −0.4 V for 72 h to evaluate the stability of Au-Ag-Pd-850 (Fig. 5d). The electrocatalyst could maintain the NH3 yield rate (13.62 μg cm−2 h−1) and FE (43.5%) over 72 h, which is very close to the NRR activity of the catalyst in the initial 12 h test (Fig. S3a). This performance corresponds to the turnover frequency (TOF) of 59 h−1 as per active Pd, Au, and Ag sites (see supporting information for the detailed calculation). The SEM images before and after the stability test, reveal that the nanoparticles are firmly attached to the substrate, and they are not washed away in long-term testing under stirring and applied bias (Fig. S1, Table SI). In addition, the TEM images after the stability test show the minor morphology change of nanoparticles after 72 h of the CA test (Fig. S2). Extensive control experiments are carried out following the instructions in the literature and our prior studies.21,24,38–40 Control experiments (i.e., Ar, N2 at OCV, N2 with no catalyst) with conditions similar to those in Fig. 5b, yield remarkably smaller amounts of NH3 (Ar: ∼7.3% of N2, N2 at OCV: ∼6.1% of N2, N2 with no catalyst: ∼2.5% of N2) (Fig. S3b). The amount of ammonia produced in an isotopic labeling experiment using 15N2 gas after a 4 h electrolysis test is close to that of 14N2 (73.6  M, ∼91% of 14N2) (Fig. S3c). Furthermore, the doublet and triplet couplings of 15N2 and 14N2 obtained from 1H NMR measurement confirms that the supplied N2 is the major source of ammonia formation in the system (Fig. 5e). The amounts of ammonia measured using 1H NMR are similar to the indophenol method (71.9
  M for 15N2 and 78.4
  M for 14N2). Calibration curves of the 1H NMR signal and indophenol blue method for standard solutions of 15NH4+ and 14NH4+ were provided in our prior studies.21,24
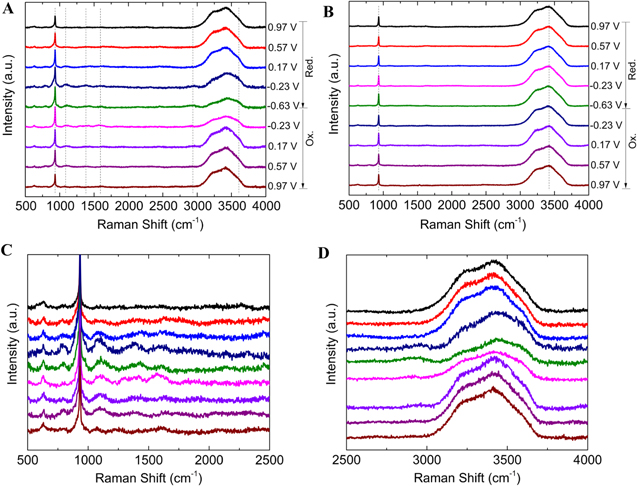
To probe the possible reaction mechanisms and track the intermediate species in electrocatalytic NRR, operando SERS spectra are collected during the CV tests on the SERS active substrate, which is comprised of Au-Ag-Pd nanoparticles deposited on the Au thin film working electrode. Detailed information regarding the spectro-electrochemical setup and CV curves is provided in the supporting information (Figs. S5 and S6). The SERS spectra in N2− and Ar-saturated LiClO4 (aq.) solution contain the vibrational band located at 932 cm−1, which is attributed to the stretching mode of the ClO4− anion (Figs. 6a and 6b). In addition, the wide vibrational band centered at 3415 cm−1 corresponds to O–H stretching. As the potential is swept to negative values in the reductive pathway (0.97 V to −0.23 V vs RHE), the faint evolution of three vibrational modes at 1094, 1393, 1601 cm−1 is observed, reaching their highest intensity at −0.23 V; these can be classified as N–N stretching, H–N–H bending, and N–H wagging, and these suggest the formation of N2H4 as an intermediate species (Figs. 6a, 6c, 6d).29 Two more peaks centered at 2937 cm−1 and 3605 cm−1 are evolved at −0.23 V, corresponding to the N–H asymmetric and symmetric stretching modes, respectively. The evolution of these two peaks strongly supports the formation of NH4+ during the reductive potential sweep.29,41,42 By moving toward more negative potentials during the reductive CV scan (−0.23 v to −0.63 V), the intensity of peaks at 1094, 1393, 1601 cm−1 (intermediates) decreases while the peak at 2937 cm−1 and the shoulder at 3605 cm−1 (NH4+) reach their highest intensities. This strongly suggests the formation of NH3 from the intermediate species (N2  N2H4
N2H4  NH3) (Figs. 6a, 6c, 6d). Since the literature values used to assign these peaks were obtained using infrared (IR) spectroscopy, the wavenumbers are not expected to align precisely, as the excitation mechanisms are different in each type of spectroscopy. The intensity of the peaks ascribed to intermediates and ammonium decreases during the oxidative pathway due to the oxidation of the N-containing species (Figs. 6a, 6c, 6d). The SERS spectra of the standard ammonia and hydrazine solutions in 0.5 M LiClO4 (aq.) confirm the band assignment of various vibrational modes in NRR operando SERS measurements (Figs. S7 and S8). Furthermore, operando SERS measurements in Ar-saturated electrolyte with the electrocatalyst and N2-saturated electrolyte without the electrocatalyst reveal no pronounced peaks, implying the peaks observed in N2-saturated electrolyte with the electrocatalyst are solely related to the formation of N-containing species at the presence of the electrocatalyst (Fig. 6b, Fig. S9).
Figure 6. (a) Operando SERS using Au-Ag-Pd-850 nanoparticles in N2-saturated 0.5 M LiClO4 (aq.) solution at the scan rate of 2.5 mV s−1 with 532 nm laser. (b) Operando SERS using Au-Ag-Pd-850 nanoparticles in Ar-saturated 0.5 M LiClO4 (aq.) solution at the scan rate of 2.5 mV s−1 with 532 nm laser. (c) and (d) Low and high Raman shift of SERS spectra in N2-saturated electrolyte (Fig. 6a).
Download figure:
Standard image High-resolution image
Conclusions
The role of incorporating Pd in bimetallic Au-Ag nanocages on the electrocatalytic NRR selectivity and activity was investigated. TEM, EDX, ICPES measurements, and stoichiometric balance revealed that the reduction of Pd2+ to Pd0 is accomplished through both an island-growth mode on Au as well as the galvanic replacement of Ag. The increase in the Pd content is controlled by monitoring the localized surface plasmon resonance (LSPR) peak position of the resulting trimetallic nanoparticles. The ECSAPd achieved with our synthesized Au-Ag-Pd-850 nanoparticles is approximately 5 times higher than that of commercial Pd/C catalyst, which is mainly attributed to the formation of a rough and porous layer of Pd in trimetallic nanostructures. The correlation between the position of the d-band center of trimetallic nanoparticles and the Pd content was explored. Furthermore, the effect of Pd content on NRR current density, selectivity, and activity was discussed. The highest electrocatalytic NRR activity (FE = 48.94% and NH3 yield rate= 5.80 μg cm−2 h−1) was achieved at −0.3 V vs RHE. This corresponds to the production energy efficiency of 28.9% and the electrical energy input of 19.1 MWh/ton NH3. Operando SERS revealed that electrochemical NRR takes place on the catalyst surface through an associative mechanism with N2H4 as an intermediate species.
This work highlights the importance of engineering the morphology and composition of nanocatalysts to improve the electrocatalytic NRR activity. In particular, it informs the crucial role of Pd with enhanced ECSA for increasing the rate of ammonia electrosynthesis. It also demonstrates the use of operando SERS as a powerful technique for unraveling reaction mechanisms for the electrocatalytic phenomenon.
Experimental
Nanoparticle synthesis
Bimetallic porous Au-Ag nanocages with an LSPR peak position at 650 nm are synthesized by adding HAuCl4 (aq.) solution to a solid silver nanocubes (AgNCs) solution through the galvanic replacement method.21–24 The Au-Ag nanocages are cleaned by centrifugation two times at 10,000 rpm for 10 min. Then, K2PdCl4 (0.006 M (aq.)) is gradually injected to the 100 ml Au-Ag solution (0.5 ml per 5 min) at room temperature (20 oC) under constant shaking in a 150 ml round-bottomed flask until the LSPR peak positions redshifts to 750 nm and 850 nm (approximately 1.5 ml of K2PdCl4 (aq.) for Au-Ag-Pd-750 and 2.5 ml of K2PdCl4 for Au-Ag-Pd-850). Unlike the galvanic replacement of Au3+ ions and Ag that takes place at the water boiling temperature, the galvanic replacement of Ag with Pd2+ takes place at room temperature, as the reaction of Pd ions with Ag is more active compared to that of the Au ions. The resulting trimetallic Au-Ag-Pd nanoparticles are washed two times by centrifugation at 12,000 rpm for 10 min. The precipitated nanoparticles are dispersed in DI water for future use.
Production energy efficiency calculation
The production energy efficiency ( )of the electrolysis system is calculated according to the following equation:

The free energy for NH3 generation ( ) is 339 kJ mol–1 and
  is the electricity consumed in the process (energy input). Here,
  (V) is the full cell potential and is calculated according to the following equation:

The cathode potentials (NRR) were measured in the three-electrode set up for each condition (Fig. 5c). The anode potential is estimated as the sum of the thermodynamic potential for water oxidation (1.23 V vs RHE) and OER overpotential (∼0.45 V on the Pt mesh).43
The resistance (R) between anode and cathode in our setup is measured to be 75 Ω. This indicates that even for the case with the highest average current density (∼0.4 mA cm−2 at −0.5 V vs RHE using Au-Ag-Pd-850), the resistive losses (IR) will be ∼30 mV.
Determination of the electrochemical surface area (ECSA) of the nanoparticle
The ECSA of the catalyst is determined from the charge associated with the reduction peak of Pd oxide (PdO) after double-layer correction and is normalized to the Pd loading on the working electrode and the charge density of 424 μC cm−2 according to the following equation35:
where  (μC cm−2) is the charge associated with the reduction peak of Pd oxide after double-layer correction and is calculated according to the following equation:

where  is the current density (μA cm−2),
  is the potential (V), and
  (V s−1) is the scan rate.
Acknowledgments
The authors gratefully acknowledge Amazon Catalyst at ECS grant for supporting this work. This work was performed in part at the Georgia Tech Institute for Electronics and Nanotechnology, a member of the National Nanotechnology Coordinated Infrastructure (NNCI), which is supported by the National Science Foundation (Grant ECCS-1542174). Additional financial support is acknowledged from the National Science Foundation under Grant No. 1904351.