

Abstract
Redox targeting reactions between lithium-ion battery materials and redox shuttles have been proposed to design high energy density redox flow batteries. Designing these batteries would require a deeper understanding of the kinetics of redox targeting reactions and the phase transformation of the materials involved. In this study, the oxidation and reduction of lithium iron phosphate, LiFePO4, via chemical and electrochemical routes will be compared. Ultraviolet-visible spectroscopy was used as a technique to characterize the extent of chemical lithiation/delithiation during chemical redox of LiFePO4, while the electrochemical redox was characterized using battery coin cells. The kinetic parameters extracted using the Johnson–Mehl–Avrami–Erofeyev–Kolomogorov model suggested that chemical redox was slower than electrochemical redox within the experimental regimes. Calculated apparent activation energies suggested the limitations in the chemical redox rate were due to different processes than the electrochemical redox. In addition, asymmetry observed for oxidation and reduction of LiFePO4 materials will be discussed. As pairs of solid battery electroactive particles and soluble redox shuttles are designed, tools and analysis such as those in this study will be needed for interrogating and comparing electrochemical and chemical oxidation and reduction of the solid particles to understand and design these systems.
Export citation and abstract BibTeX RIS
Soluble redox active compounds (e.g., redox shuttles), and their use to promote chemical reduction and oxidation of solid electroactive lithium-ion (Li-ion) materials, have been under investigation for a number of years.1–5 The most common target application for these materials has been providing overcharge protection via "redox shuttling", where for example the soluble redox shuttle will oxidize at a potential above the cathode material but below an undesirable value for the electrode and electrolyte to be exposed.5 Redox shuttles have also been reported for photo-assisted rechargeable Li-ion batteries where the redox shuttles facilitate lowering the potential required to delithiate the cathode and charge the battery when exposed to light.6,7 Due to the relatively high potentials needed to protect Li-ion cathode materials and low potentials to protect Li-ion anode materials, redox shuttles themselves have been suggested and explored for organic flow battery applications.8 Pairing a Li-ion anode and cathode redox shuttle has resulted in cell voltages which exceeds that for conventional flow batteries.9,10 However, the energy density of an organic flow battery (e.g., <40 Wh l−1)11 will still be limited by the concentration of the redox shuttles, which can be limited by solubility and/or stability to values that result in volumetric energy densities much lower than conventional Li-ion batteries (600–650 Wh l−1).12 Recently, Huang et al. reported the use of redox shuttles as mediators to chemically charge/discharge Li-ion solid electroactive materials in a flow battery design, where the redox shuttles were still used in an electrochemical cell to provide power, but the energy was stored in solid electrochemically active particles.13 This configuration took advantage of the high volumetric energy density of solid Li-ion active materials and the high power density provided by electrochemical oxidation/reduction of soluble species in a high surface area flow battery electrochemical cell.14 One tradeoff for this type of flow battery was that for both the anode and cathode there must be a combination of redox shuttles (or a multielectron shuttle) that has a potential high enough to drive chemical oxidation of the solid active material and low enough to drive chemical reduction of the active material.15 These requirements thus result in a voltage efficiency penalty for charge and discharge in the cell due to the need to accommodate the chemical redox driving forces. However, very few studies have investigated the kinetics of the chemical redox between redox shuttles and Li-ion active materials, which will be needed to understand and potentially optimize these materials.16,17
Compared to electrochemical redox, there have been fewer reports quantifying the chemical redox of Li-ion battery materials. Among them, reports by Schougaard group18–20 focused on the delithiation/lithiation of LiFePO4 (LFP) by strong oxidizing/reducing agents in excess accompanied by experimental conditions (e.g., vigorous stirring) which remove the transport limitations arising from the oxidizing/reducing agents in the bulk reaching the surface of the active material particles. The kinetic data thus collected using in-situ XRD,18 atomic emission spectroscopy,19 or ultraviolet-visible (UV-vis) photometry20 was primarily attributed to the intrinsic transport limitations of Li+/e− through LFP particles. In another study done by Jennings et al.,21 films made of nanoparticulate LFP particles were reacted with ferrocene-based shuttles and modeled with a 1-D diffusion reaction model under excess LFP concentration conditions. Another work by Yan et al.22 used feedback mode of scanning electrochemical microscopy to determine the rate constant for blended pellets comprised of both LFP and FePO4 (FP). None of these studies, however, included a detailed characterization of both chemical and electrochemical redox of the electrode material under investigation.
In this study, we have investigated the chemical lithiation/delithiation reaction of LFP (and FP formed from delithiation of LFP) using a pair of ferrocene derivatives and juxtaposed these results against electrochemical potentiostatic lithiation/delithiation of the same electroactive particles. LFP has been targeted as a commercial cathode material for its high specific energy density (theoretical ∼170 mAh g−1), excellent rate capability, safety, and stability as an electrode material for mediated flow battery applications.23 The success of LFP as a commercial electrode material has been accompanied by extensive research about its phase transformation and redox kinetics characterized electrochemically, providing a literature for results comparison. A particular additional desirable attribute of LFP for this study was the two-phase behavior of LFP-rich to LFP-poor transformation, which provided charge/discharge plateaus at relatively constant potentials.23 This attribute allowed for the assumption of an approximately constant potential for the LFP when reacting with the redox shuttles during chemical redox. This present study is the first to quantify both oxidation and reduction of the electroactive material by redox shuttles and to compare to electrochemical processes for the same materials. UV-vis spectroscopy will be shown to be a simple and robust tool to estimate chemical redox kinetics for systems with appropriate redox shuttles. However, experimental limitations of concentration regimes due to the use of UV-vis spectroscopy limited the ability of this study explore higher concentrations of the redox shuttles.
Experimental
Materials preparation and redox shuttle characterization
LFP (Xiamen TOB New Energy Technology, China) was purchased from a commercial supplier and used as received. The LFP used did not undergo a carbon coating process in its production. In chemical redox experiments with a redox shuttle and FePO4 (FP), the LFP was first oxidized to FP by stirring vigorously in a solution of 2.4 mol% hydrogen peroxide and 0.1 mol% acetic acid in distilled water for 30 min following a previously reported procedure.19 The delithiated product was characterized using inductively coupled plasma- optical emission spectrometry (ICP-OES, Perkin-Elmer Optima 8000) and was found to be 96.5% delithiated (see supplementary material, Table S1). Conversion from LFP to delithiated FP was also confirmed using powder X-ray diffraction (XRD, Panalytical X' pert diffractometer) and the patterns can be found in supplementary material, Fig. SI (available online at stacks.iop.org/JES/167/020537/mmedia). The XRD patterns for LFP and FP were consistent with previous literature reports for these two materials.20
Ferrocene (Fc, Sigma Aldrich) and 1, 1'-dibromoferrocene (FcBr2, (Fischer Scientific) redox shuttles were dissolved into an electrolyte solution of 1.2 M LiPF6 in 3:7 vol% ethylene carbonate: ethyl methyl carbonate (Gotion Inc.). All experiments with the redox shuttles were conducted in an argon-filled glove box (H2O < 1 ppm, O2 < 1 ppm). The half-wave potentials of the redox shuttles were measured to be 3.6 V vs Li/ Li+ and 3.25 V vs Li/ Li+ for FcBr2 and Fc, respectively, using cyclic voltammetry at a scan rate of 10 mV s−1 in a custom-built glass electrochemical cell (for description of the custom cell and cyclic voltammograms see supplementary material, Fig. S2).
Chemical redox of LFP/FP with redox shuttles
Chemical reduction of FP with Fc was conducted by preparing an 8 mM solution of Fc dissolved in the carbonate solvent electrolyte solution. Separately, FP powder, which had been thoroughly dried and stored in the glove box, was carefully weighed outside the glove box after addition to a cuvette (Spectrocell) which had also been dried in a vacuum oven at 80 °C. The range in the mass of FP used in experiments was 1.2–1.5 mg. A small stir bar was added, and then the cuvette was sealed with a cap containing a septum. The cuvette was placed into an UV-Vis spectrometer (Perkin-Elmer) within a cuvette holder that included a Peltier heater and the holder was set to the desired reaction temperature and allowed to equilibrate. The Fc-containing electrolyte solution was heated to the desired reaction temperature and then injected all at once into the cuvette through the septum. The cuvette holder also had stirring capability and a stir rate of 60 rpm was initiated with the addition of the Fc-containing solution. UV-vis scans were performed from 400–700 nm at a scan rate of 10 nm s−1 at a time resolution of 5 min throughout the Fc/FP chemical redox process.
Oxidation of LFP with FcBr2+ was conducted in the same manner as the Fc/FP experiment described above except that (1) the initial concentration of FcBr2+ was 2 mM, and (2) FcBr2 had to first be oxidized to FcBr2+. Oxidation of FcBr2 was conducted electrochemically using a custom electrolysis cell (see supplementary material, Fig. S2) by applying a constant potential of 4 V (vs Li/Li+ via a Li foil counter/reference electrode) to a Pt wire working electrode in a stirred solution until the coulombs of charge that were recorded were equal to the theoretical value based on 1 mol of e− per mol of FcBr2 in the solution. The ion exchange membrane in the electrochemical cell was a blend of polyvinylidene difluoride and Nafion and was prepared using a procedure from the literature.24 UV-vis scans during FcBr2+/LFP chemical redox were performed from 500–800 nm at a scan rate of 10 nm s−1 at a time resolution of 2 min. Three replicates were performed for chemical redox experiments at each temperature.
Electrochemical redox of LFP/FP
Electrochemical oxidation of LFP and reduction of FP was conducted in 2032-type coin cells. Cathodes were fabricated by casting a slurry of 80:10:10 wt% of LFP:carbon black: polyvinylidene difluoride in N-methyl-2-pyrrolidene onto an aluminum current collector using a doctor blade with a 125-μm gap. The cathodes were dried overnight at 80 °C in an ambient oven, and further dried for additional two hours at 80 °C in a vacuum oven. The electrodes were measured with a digital micrometer to be ∼70 μm thick and had a loading of 10–14 mg LFP within each 1.6 cm2 punched electrode. LFP cathodes were paired with a metallic Li foil anode separated by a Celgard 2325 separator, and the electrolyte was 1.2 M LiPF6 in 3:7 vol% ethylene carbonate:ethyl methyl carbonate. The cells were cycled at room temperature for 13 charge/discharge cycles with cutoff voltages of 4.0 V and 2.5 V at rates ranging from C/20 to 1 C (where 1C was defined as 160 mA g−1 LFP) on a MACCOR cycler. The cells were charged/discharged at C/20 (three times), C/10 (two times), C/5 (two times), C/2 (two times), 1 C (two times), and C/20 (two times). A minimum of 150 mAh g−1 LFP at C/20, 80 mAh g−1 LFP at 1 C, and more than 98% capacity retention in the last 2 cycles relative to the 2nd cycle was considered an acceptance criteria for a cell to be used for lithiation/delithiation kinetics characterization testing. Representative rate capability data can be found in supplementary material, Fig. S3. For evaluation of kinetic parameters of the LFP/FP, electrochemical testing was conducted in a temperature-controlled incubator (VWR). The temperature-controlled experiments were conducted with a Biologic SP-150 potentiostat. Cells were equilibrated for 4 h at a given set temperature before conducting electrochemical evaluation. For electrochemical oxidation of LFP, a constant potential of 3.6 V was applied until the current dropped to below C/20 (8 mA g−1 LFP). The cell was then allowed to rest for 1 h, after which it was charged at C/10 until reaching a cutoff voltage of 4.0 V. After reaching this completely charged stage (>99% FP based on mAh of charge measured), a cell was allowed to rest for 1 h. The potential was then set at 3.25 V to discharge the cell until the current dropped below C/20 (8 mA g−1 LFP/FP), the cell was allowed to rest for 1 h, and then the cell was discharged at C/10 to a cutoff discharge voltage of 2.5 V to convert the active material back to the LFP form. Cells were charged and discharged three times at each temperature. Three independent cells were evaluated using this procedure.
Results
Chemical oxidation/reduction using redox shuttles
Among the molecular moieties available for chemical oxidation and reduction of Li-ion cathode material, metallocenes (e.g. ferrocene (Fc), nickelocene) are readily commercially available in a variety of redox potentials. These compounds consist of transition metals sandwiched between aromatic cyclopentadienyl rings (C5H5-), and the rings may be functionalized to shift the redox potential of the transition metal.25 Many of these compounds have highly reversible electrochemical redox, stability in commonly used Li-ion battery electrolytes, and molecular tunability, thus there are shuttles available both to oxidize and reduce Li-ion cathode materials.26 For the LFP material used in this study the redox potential was 3.45 V vs Li/ Li+, thus the metallocene redox shuttles chosen were 1,1'-dibromoferrocenium (FcBr2+) for LFP oxidation (half-wave redox potential of 3.6 V vs Li/ Li+). Similarly, Fc was used for reduction of FP (half-wave redox potential of 3.25 V vs Li/ Li+). The relevant chemical oxidation/reduction reactions for LFP/ FP are:


To quantify the progression of chemical redox reactions between the redox shuttles and solid particles, the extinction peaks from UV-vis spectra were used. The intensity of UV-vis peaks have been widely used for determination of the concentration of dissolved species in general.27 For example, in this study when tracking the reaction progression of FcBr2+ with LFP, the UV-vis spectra for FcBr2+ was used. FcBr2+ has a uniquely distinguishable peak at 705 nm (Fig. 1a), and for a known initial concentration of FcBr2+ this peak can be used to quantitatively track the extent of reduction of FcBr2+ in solution back to FcBr2. Reduction of FcBr2+ was assumed to only be due to the oxidation of LFP via the reaction in Eq. 1. Thus, through tracking the UV-vis peak for FcBr2+ the extent of chemical oxidation and delithiation of LFP by FcBr2+ was monitored. An example of the progression of the FcBr2+ oxidation peak at 705 nm after contacting LFP can be found in Fig. 1a. Each extinction spectra required nearly 30 s to collect within the wavelength range investigated, and were continuously collected for 90 min at an interval of 2 min For these experiments, LFP was used as received; however, as mentioned in the Experimental section the FcBr2 was electrochemically oxidized before use (to >98% FcBr2+ as determined by coulometry). Before conducting chemical redox experiments such as those found in Fig. 1, first the range of redox shuttle concentrations that were accessible with the technique were determined. For UV-vis peaks, at too low of a concentration a species will not be detectable and at too high of a concentration the linear assumption between the peak magnitude and concentration no longer holds. A dilution series was conducted with FcBr2+ (see supplementary material, Fig. S4), and it was determined that to stay within the linear regime for the UV-vis measurements that the FcBr2+ should not exceed ∼2.5 mM. It was also noted that the particles contribute to measured extinction through scattering of the UV-vis incident light without selectivity for particular wavelengths. To avoid the scattering from the particles saturating the extinction that could be measured, the LFP particle concentration was limited to ∼0.5 mg ml−1. The particle concentration was typically at the upper limit of ∼0.5 mg ml−1 because very low particle concentrations were difficult to accurately weigh.

Figure 1. UV-vis spectra taken at different times during (a) the oxidation of LFP with FcBr2+ and (b) the reduction of FP with Fc. Curves in (a) and (b) correspond to 0 min (blue), 30 min (black), 60 min (green) and, 90 min (red). The temperature for both experiments was 35 °C.
Download figure:
Standard image High-resolution imageThe other chemical redox conducted in this study was the reduction of FP with Fc, depicted in the reaction in Eq. 2. Chemical reduction of FP was described in the Experimental section, and the FP powder had ∼96.5% removal of lithium relative to the initial LFP powder. Fc+ has a unique peak at 615 nm (Fig. 1b), and thus similar to the analysis described above for the chemical redox of FcBr2+ and LFP, it was assumed that the oxidation of Fc was only due to reduction of FP. This meant the reduction and lithiation of FP could be monitored by tracking the magnitude of the Fc+ peak. A dilution series was conducted for Fc+, and the results can be found in the supplementary material, Fig. S5. For Fc+, the maximum concentration that could be used with the UV-vis technique was determined to be ∼8 mM. Similar to the LFP particles, due to the scattering from the FP particles the targeted particle concentration was ∼0.5 mg ml−1.
Chemical redox at varying temperatures
The sections above described how the concentration of FcBr2+ and Fc+ were monitored using UV-vis in order to track the relative extent of delithiation and lithiation of LFP and FP, respectively. For quantitative analysis and comparison between both these redox processes and the electrochemical oxidation of LFP and reduction of FP, the chemical redox reactions were monitored at different temperatures. Three representative experiments of the oxidation LFP with FcBr2+ at temperatures of 25 °C, 35 °C, and 45 °C are shown in Fig. 2. Both the FcBr2+ concentration which was determined from the magnitude of the 705 nm UV-vis peak (Fig. 2a) and the corresponding extent of delithiation (and oxidation) of LFP (Fig. 2b) are shown. The control experiment without LFP added to the solution at the most aggressive reaction condition of 45 °C resulted in reduction of 2% of the FcBr2+ after 90 min, indicating the redox shuttle was stable in the solution during the time course of the experiments and that nearly all of the reduction of the redox shuttle was due to the presence of LFP added to the solution (see supplementary material, Fig. S6). The chemical redox between FcBr2+ and LFP proceeds at an increased rate for increasing temperature, with the FcBr2+ being nearly completely reduced at 45 °C. This suggested that the reaction has an activation barrier that has sensitivity to an increase in temperature, which led to additional analysis of the apparent activation energy of this process as will be described in the Discussion section. For the highest temperature, the extent of delithiation of LFP at 90 min was 70%.

Figure 2. (a) FcBr2+ concentration and (b) extent of delithiation of LFP as a function of time during the first 90 min of the chemical redox reaction between the two species at 25 °C (gray circles), 35 °C (orange triangles), and 45 °C (blue squares).
Download figure:
Standard image High-resolution imageComplementary experiments were also conducted for the reduction of FP with Fc, at 25 °C, 35 °C, and 45 °C. Representative results can be found in Fig. 3. The Fc+ concentration was determined from the UV-vis peak magnitude at 615 nm (Fig. 1b), and the lithiation and reduction of FP was determined by assuming every electron lost to form Fc+ went to an FP particle (Fig. 3b). It is noted control experiments of Fc without FP added indicated the Fc was very stable to oxidation in the electrolyte in general (See supplementary material, Fig. S7). Inspection of Fig. 3 revealed that as the temperature was increased that both the rate of the chemical redox reaction and the extent of the lithiation of the solid particles after 90 min were greater. However, the chemical redox reaction was slower for the Fc/FP system relative to the FcBr2+/LFP system. For example, after 40 min at the highest temperature (45 °C), the LFP particles had reached 55% oxidation while the FP particles had reached 45% reduction. The total volume of the reaction solution and the target mass loading for the solid particles was the same as for the FcBr2+/LFP redox reaction (and the FP and LFP were from the same source particles, thus the surface area of the solid electroactive material was the same in both experiments), however, the reduction of FcBr2+ proceeded much faster than the oxidation of Fc at all conditions. Due to the greater absorption coefficient for FcBr2 relative to Fc, a smaller initial concentration of FcBr2+ had to be used (2 mM as opposed to 8 mM). This resulted in FcBr2+ being the limiting reagent in the chemical redox process, with a molar ratio of 0.75:1 FcBr2+:LFP as opposed to 3:1 Fc:FP. All experiments were conducted using the same cells and mixing conditions. Both redox shuttles would be expected to have similar diffusion coefficients, although FcBr2 would be expected to be slightly lower due to the higher molecular weight.25 Given that FcBr2+ had lower concentration and lower expected diffusion coefficient than Fc, the observed higher reaction rate would suggest the kinetics of the FcBr2+/LFP reaction were intrinsically faster than those of the Fc/FP reaction. The root cause of the intrinsic kinetic difference is still under investigation; however, as will be discussed in more detail later it was suspected that both of the chemical redox processes were impacted by mass transport limitations.

Figure 3. (a) Fc+ concentration from UV-vis measurements and (b) corresponding extent of lithiation of FP as a function of time during the first 90 min of the chemical redox reaction between the two species at 25 °C (gray circles), 35 °C (orange triangles), and 45 °C (blue squares).
Download figure:
Standard image High-resolution imageElectrochemical delithiation/lithiation of LFP/ FP-
To compare chemical lithiation/delithiation with electrochemical lithiation/delithiation, 2032-type coin cells with LFP as cathode and Li foil as anode were constructed. When the electrode active material was in the lithiated state (LFP), the delithiation and oxidation of LFP was conducted by applying a constant potential of 3.6V (vs Li/Li+). When the electrode active material was in the delithiated state (FP), reduction and lithiation was conducted by applying a constant potential of 3.25 V (vs Li/Li+). The constant potential electrochemical oxidation and reduction experiments were conducted at three temperatures: 25 °C, 35 °C, and 45 °C. Assuming that the measured current was only due to the oxidation of LFP during charge and reduction of FP during discharge, the extent of lithiation as a function of time was calculated for each electrochemical reaction (oxidation of LFP and reduction of FP in Figs. 4a and 4b, respectively). Electrochemical oxidation and reduction of the electrode materials at all temperatures reached more than 90%, and as the temperature was increased the cell achieved conversion faster. This temperature dependence also suggested an activation barrier that could be overcome with elevation of temperature for the electrochemical redox processes. The lithiation of FP (Fig. 4a) proceeded slower than delithiation of LFP (Fig. 4b) at all temperatures. Note that the same electrodes were used for all electrochemical cycling experiments, thus differences in the rate of electrochemical redox reflect asymmetry in the reversible redox of the LFP active material loaded into the electrode and do not reflect variation in cell or electrode fabrication or impacts from processing the LFP to FP 28 (because there was not a chemical oxidation step applied to the LFP for the coin cell electrodes—FP was electrochemically produced).

Figure 4. (a) Extent of electrochemical delithiation and oxidation of LFP within a composite electrode, starting from the fully lithiated state, during a chronoamperometry experiment held at 3.6 V (vs Li/ Li+). (b) Extent of electrochemical lithiation and reduction of FP within a composite electrode, starting from the fully delithiated state, during a chronoamperometry experiment held at a potential of 3.25 V (vs Li/ Li+). The composite LFP cathode was paired with a lithium metal foil anode. Both a) and b) were completed using the same coin cell. The chronoamperometry was conducted at different temperatures of 25 °C (blue dashed), 35 °C (solid orange), and 45 °C (black dots).
Download figure:
Standard image High-resolution imageJohnson–Mehl–Avrami–Erofeyev–Kolmogorov (JMAEK) analysis
Both chemical and electrochemical redox of LFP and FP were analyzed using the Johnson–Mehl–Avrami–Erofeyev–Kolmogorov (JMAEK) equation.29–31 JMAEK is a solid-state model developed for phase transformations that assumes single step nucleation, infinite system volume, and homogeneous distribution of nucleation sites within the system volume. This model has previously been applied to lithiation and delithiation of FP/LFP materials, with the assumption of the limiting step being nucleation and propagation of the conversion of FP to/from LFP (or correspondingly lithiation or delithiation of the active material phase which includes the transport of Li+ and e−).20,28,32–34 The first step was to use the experimentally obtained fractional conversion of FP/LFP (e.g., Figs. 2b, 3b, and 4) and to apply these outcomes using Eq. 3:

where f is the volume fraction of the material that has been delithiated/lithiated during the reaction, k is a first order rate constant, t is time, and n indicates Avrami exponent, which is related to the dimensionality of growth. n can be written as

where a is the nucleation index defined as  N is the number of nuclei per unit volume and t is time. b is the dimensionality of the growth and b = 1, 2, 3 for 1-D, 2-D, and 3-D growth, respectively. c is the growth index of the transformation and can take the value 1 for phase boundary control or 0.5 for diffusion-controlled growth. Figure 5 shows the dependence of rate constant on temperature during chemical oxidation of LFP (Fig. 5a), chemical reduction of FP (Fig. 5b), electrochemical oxidation of LFP (Fig. 5c), and electrochemical reduction of FP (Fig. 5d).
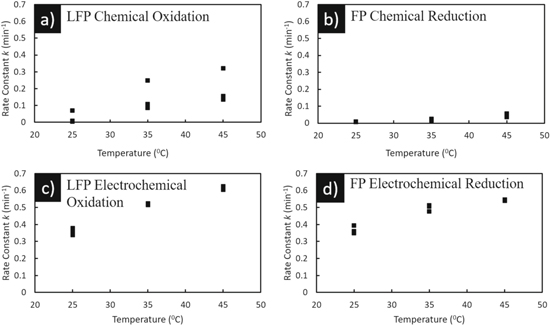
Figure 5. Rate constant as a function of temperature determined for each experiment using either chemical (a), (b) or electrochemical (c), (d) redox. (a) and (c) are for delithiation and oxidation of LFP and (b) and (d) are for lithiation and reduction of FP. Note that there are three independent measurements and the corresponding data points at each temperature.
Download figure:
Standard image High-resolution imagePlots of log (log (-(1-f))) against log t (see supplementary material, Fig. S8 for representative plots for chemical redox at three temperatures) give n and k for reactions 1 and 2 (Table I). For chemical redox, n was determined to range from 0.23–0.77. For LFP chemical oxidation, n varied from 0.2–0.4 and FP chemical reduction, n varied from 0.7–0.8. n did not follow any clear trend for increasing temperature. For electrochemical redox n was in the range of 0.57–0.65, with the coefficient of determination >95%, and decreased with temperature. The rate constant k as expected increased with temperature for both chemical and electrochemical redox. k lied between 0.01–0.32 min−1 for chemical redox and 0.34–0.63 min-1 for electrochemical redox. In the Avrami analysis done by Schougaard group, n for chemical oxidation was reported to be 0.6 and k in the range of 0.1–6.5 min−1 (in temperature range 7 °C–58 °C)20 and the model was not found to capture chemical reduction of LFP.19 For electrochemical reduction, Allen et al.32,33 estimated n ∼1 and k between 0.014–0.036 min−1 for the temperature range of 0 °C–22 °C. Other studies conducted on electrochemical redox of LFP that include Avrami analysis demonstrated that n decreases with applied overpotential.28,34
Table I. Avrami exponent (n), nucleation index (a), and first order rate constant (k) for LFP oxidation and FP reduction, each done using chemical and electrochemical methods.
| LFP Oxidation | Chemical | Electrochemical | ||||
|---|---|---|---|---|---|---|
| Temperature | n | a | k | n | a | k |
| 25 | 0.23 | -0.27 | 0.01 | 0.64 | 0.14 | 0.36 |
| 35 | 0.36 | -0.14 | 0.10 | 0.60 | 0.10 | 0.52 |
| 45 | 0.38 | -0.12 | 0.15 | 0.57 | 0.07 | 0.61 |
| FP Reduction | Chemical | Electrochemical | ||||
| Temperature | n | a | k | n | a | k |
| 25 | 0.84 | 0.34 | 0.01 | 0.61 | 0.11 | 0.37 |
| 35 | 0.72 | 0.22 | 0.02 | 0.60 | 0.10 | 0.50 |
| 45 | 0.77 | 0.27 | 0.04 | 0.60 | 0.10 | 0.54 |
Chemical redox
Using the experimental conditions and the Nernst equation,35 it was found that just from changes in bulk concentration during the chemical redox reaction that the potential difference between the redox shuttles and electroactive LFP/FP powder decreased up to 8 mV and 30 mV for oxidation of LFP with FcBr2+ and reduction of FP with Fc, respectively. This calculation of potential difference assumed the potential of the LFP or FP was constant and that changes were due to changes in the concentration of the oxidized or reduced state of the redox shuttle in bulk solution. The decrease in the thermodynamic driving force was in part responsible for the more gradual chemical conversion of FP/LFP by redox shuttles as shown in Figs. 2a and 3a, and the decrease in the local concentration of the redox shuttle in the reactant form near the particle interface would further reduce this driving force. Changes in the concentration of redox shuttles will affect the rate of the chemical redox reaction through impacts in thermodynamic, transport, and kinetic driving forces. The limited concentration of redox shuttles was in contrast with previous studies of chemical redox of LFP, where excess concentration of oxidant/reductant ensured negligible change in thermodynamic driving force around LFP particles.19,20 As a result, the calculated kchem values in those reports were about two orders of magnitude higher than values estimated in this study. Jennings et al. reported kchem in the range of ∼0.02–0.1 min−1, which was comparable to the values in this study.21 However, that study employed static LFP films at varying states of charge; the LFP film (excess reactant) was treated with low concentration redox shuttles diffusing from a constant distance. Another study that used low concentration redox shuttle was the chemical redox kinetics determined using scanning electrochemical microscopy by Yan et al.22 where the lithiation/delithiation of dense LFP/FP pellets by redox shuttles was diffusion controlled, and the rate constant was interpreted in the context of interfacial charge transfer (reported in the range of 3.70–6.57 × 10⁻³ cm s−1) between redox shuttle and LFP/FP pellets. The calculated rate constant had a quasi-linear dependence on the LFP:FP ratio in the pellet and depended strongly upon pretreatment. Our work differs from these studies as the continuous lithiation/delithiation of LFP particles was monitored while introducing mild mixing. Another reason for chemical reduction of FP being slower than chemical oxidation of LFP in addition to the potential difference between the particles and redox shuttles may have been the intrinsic material performance. Coin cells made using FP obtained from oxidation of LFP using H2O2 showed a sloping discharge potential on the first discharge rather than a flat plateau (supplementary material, Fig. S9). Interestingly, the material recovered the flat charge/discharge behavior for all subsequent cycles; however, for the chemical redox experiment the first cycle would reflect the potential difference with the redox shuttle. The sloping profile suggested that the driving force for reduction of FP with Fc was even lower than expected. It is noted that similar degradation of electrochemical performance of LFP in vigorously stirred aqueous suspensions has been reported previously.36
Discussion
When the averages of chemical rate constants were compared against electrochemical rate constants (Table I), kechem > kchem. This was because electrochemical redox offered constant potentiostatic conditions, whereas in chemical redox both the mass transfer limitations increased and the thermodynamic driving force for reaction decreased with time as the redox shuttles were reacted, where both effects would result in a lower rate of redox reaction near the FP/LFP particle interface. In comparing electrochemical and chemical oxidation and reduction, it is important to take into context the differing reaction processes for these two types of redox. As an example, chemical reduction of FP with Fc (Eq. 2) was proposed to progress through the main following subset of steps (for cartoon schematic of the steps refer to Fig. 6a):
- 1.Fc molecules diffuse from the bulk electrolyte solution to the surface of FP particles.
- 2.Fc molecule adsorbs on the surface of FP particles.
- 3.Fc reacts with FP (Fc → Fc+ and Fe(3)+PO4 → Fe(2)+PO4) creating a local negative potential on FePO4 particles.
- 4.Li+ in the surrounding liquid diffuses in FePO4 lattice, resulting in LixFePO4 and Li+ progressing through the solid to appropriate positions within the structure.
- 5.Fc+ desorbs from the surface of LixFePO4 to the bulk electrolyte solution.

Figure 6. Schematic of the steps for (a) chemical reduction of FP using Fc as redox shuttle and (b) electrochemical reduction of FP in a half cell containing a lithium metal anode. Note that cartoons are not drawn to scale.
Download figure:
Standard image High-resolution image
In contrast, electrochemical reduction of FP in a Li anode half-cell was proposed to involve the following main steps (for a cartoon schematic refer to Fig. 6b):
- 1.At approximately constant potential (∼0 V vs Li/ Li+), Li anode undergoes electrochemical oxidation and Li+ ions were stripped off (Li → Li+ + e−).
- 2.There was a net flux of Li+ which transported from the Li metal foil surface to bulk electrolyte solution. Simultaneously, electrons transport through the Li foil to the current collector and external circuit.
- 3.Li+ undergoes a net flux towards the cathode.
- 4.Li+ undergoes a net flux through the tortuous paths within the electrolyte phase of the porous LixFePO4 electrode.
- 5.Li+ intercalates in the lattice of Fe(3)+PO4 particle along with electrons which arrive from the external circuit (Li+ + Fe(3)+PO4 + e− -> LixFe(2)+PO4) The electron would also need to conduct through the current collector and the matrix of the electrode to the particles undergoing reaction.
- 6.Li+ and e− undergo ambipolar co-diffusion through LixFePO4 lattice to appropriate sites.
The limiting step for electrochemical intercalation/deintercalation is generally dependent on the materials used and cell configuration, however, for LFP/FP in thin porous electrodes often Step 6 has been assumed as the rate-limiting step for electrochemical redox.37,38 With the electrode thickness of ∼70–80 μm used in this study, Li+ diffusion through Li-rich or Li-poor LFP lattice was assumed to be the limiting step in electrochemical redox. However, the reaction pathway of chemical redox has not been extensively studied and can be strongly dependent on experimental conditions. For example, in the study done by Weichert et al.,39 on single large crystals of LFP phase transformation during chemical delithiation suggested transport controlled phase growth. They also found an induction period ranging several hours before the first layer of FP started forming on the surface. The results shown in Figs. 2a and 2b suggest no such induction period for LFP to FP transition in this study, which likely reflected that for the much smaller particles used in this study (∼150 nm as opposed to ∼2 mm used in39) that the limitations in chemical lithiation/delithiation of LFP were not purely solid-state transport limited—though this step would still be expected to impact the overall magnitude of the rate and apparent activation barrier. It is also noted that for materials like LFP which have one dimensional diffusion channels, diffusion of Li+ is dependent on particle size as has been noted in the literature.40 Li+ diffusion through mesoscale agglomerates that dynamically form and dissociate in the chemical redox solution was expected to be different and have greater variation relative to a fabricated electrode in a coin cell. It is suspected that the variation and dynamic process of agglomerate formation was in part responsible for the greater variance in the parameters determined for chemical redox relative to electrochemical redox.
Avrami analysis
Analysis with the JMAEK equation assumed conditions such as single step nucleation, infinite availability for phase growth, and homogeneous distribution of nucleation sites. The validity of JMAEK analysis may not be necessarily true in the case of chemical redox as it was not known whether it followed a single step nucleation, and the experimental conditions in the UV-vis experiment offer a finite volume for the system undergoing transformation. Stirring may help in the distribution of nucleation sites i.e. solid Li-rich or Li-poor LFP particles, however, for the relatively mild stirring used in these experiments the particles were not expected to be perfectly homogeneously distributed. However, as noted in previous studies29,30,41, JMAEK analysis might fit the physical conditions of electrochemical redox if the LFP electrode can be approximated as an infinite system with nucleation sites considered homogeneous at a secondary particle level. At a potential difference of greater than or equal to 150 mV, electrochemical chronoamperometry of LFP (supplementary material, Fig. S10) was consistent with previous reports of a two-phase reaction,28,42 which is the case when reaction proceeds by nucleation and growth hence being a suitable scenario for JMAEK model. Additional mechanistic studies of chemical redox of battery active materials will be needed to understand the nucleation mechanism and validate the model for phase growth.
For the same n values, a, b and, c have been interpreted with regards to providing insights into phase transformations. n for electrochemical redox has been consistently found to be close to 1 for LFP under various experimental conditions.32–34 Allen et al. interpreted n values obtained during electrochemical delithiation as two-dimensional growth (b = 2) with a diffusion controlled mechanism (c = 1/2), concluding instantaneous nucleation (a = 0). However, in-situ synchrotron X-ray diffraction of LFP cathode has suggested phase transformations in nanoscale LFP have lithiation/delithiation which proceeded at a steady rate accompanied by two-phase coexistence of Li-rich and Li-poor domains.41 Therefore, in this study the results for electrochemical redox were interpreted similar to Xiang et al.,34 with a one-dimensional (b = 1), diffusion limited growth (c = 0.5), and thus the variation 0.07 < a < 0.14 was a result of various parameters (temperature, secondary particle size) impacting the nucleation kinetics. In chemical reduction of FP where values were calculated of a <0.3, our speculation was that dispersed particles would undergo faster lithiation than porous electrodes and would approach instantaneous nucleation. The observed values of a <0 during chemical oxidation of LFP indicated that the number of nuclei decreased with time, and it was hypothesized that this outcome may have been a result of reaction conditions causing near instantaneous nucleation of the dispersed LFP particles.
Apparent activation energy
Using the Arrhenius equation, the apparent activation energy, Ea, for the redox processes were determined using plots of ln k vs 1/T (see supplementary material, Fig. S11 for Arrhenius plots of oxidation of LFP and reduction of FP via chemical and electrochemical redox using the k values from Table I). Linear regression was used to get the apparent activation energy from the slope of the regression line ( with R the ideal gas constant). The results obtained from this analysis can be found in Table II.
Table II. Apparent activation energy for chemical and electrochemical redox of LFP.
| LFP Oxidation (kJ mol−1) | FP Reduction (kJ mol−1) | |
|---|---|---|
| Chemical | 125 ± 21 | 72 ± 15 |
| Electrochemical | 21 ± 2 | 16 ± 3 |
The apparent activation energy determined for chemical oxidation and reduction was significantly higher than electrochemical oxidation and reduction for LFP/FP materials. This indicated that the reaction pathway for chemical redox has a stronger dependence upon temperature which may be due to a host of factors including mass transport limitations in redox shuttle lean chemical oxidation vs particle lean chemical reduction, molecular structure of redox shuttles used which may affect the shuttle-particle interaction, and/or the intrinsic material performance of LFP/FP
The apparent activation energy for chemical oxidation and reduction of LFP/FP were higher than the values reported by Lepage et al. of 18.4 kJ mol−1 19 and Kuss et al. of 50 kJ mol−1.20 However, these works employed more than tenfold excess of oxidizing agent accompanied by vigorous stirring, thereby minimizing mass transport limitations in their reaction system and providing a more constant thermodynamic driving force. Hence, values of apparent activation energies are specific to the conditions/environment of oxidation/reduction of LFP/FP. The factors affecting the apparent activation energy include concentration of solid electroactive species relative to redox shuttles, total concentration of redox shuttles (affecting the heterogeneity of the system and the thermodynamic driving force for redox), stirring rate (note in this study stirring was sufficient to prevent localization of the reaction, but higher stirring which would have improved mass transfer resulted in excessive agglomeration of LFP/FP), effective particle size, and the temperature range.
In comparison, electrochemical redox had a much lower apparent activation energy than chemical redox and the values observed in this report were in a similar range to the values reported by Allen et al.,33 Maxisch et al.,43 and Takahashi et al.44 Electrochemical oxidation and reduction also had similar activation energy. This was in agreement with the values reported by Oyama et al.,28 confirming that in bulk electrode phase boundary movement was symmetric for oxidation and reduction of LFP.
Conclusions
In this work, ultraviolet-visible spectroscopy was used to monitor the chemical oxidation and reduction of a Li-ion battery electrode material facilitated by redox shuttles. Due to limitations in the ranges of detection using the technique, relatively low concentrations of both the active material particles and redox shuttles were used in the suspensions. To better understand the processes involved, the chemical redox experiments were compared in the context of electrochemical oxidation and reduction of the same electrode material. Relative to the electrochemical redox, the chemical redox was a much slower process. Analysis of the conversion of the redox processes as a function of time revealed that the first order rate constants were consistently higher for electrochemical redox, and that the apparent activation energy for the chemical redox was much larger. JMAEK analysis indicated that the phase transformations and reaction pathways were also different for electrochemical and chemical redox for the same materials. This study reported a robust method for tracking the progress of chemical redox reactions between Li-ion battery active materials and redox shuttles, requiring only a unique signature in the extinction spectra for the redox shuttle. In addition, this report demonstrates both the importance and challenges in evaluating both oxidation and reduction via both chemical and electrochemical means for Li-ion active materials. Understanding the chemical redox between redox shuttles and Li-ion active materials is important for a number of applications, including redox shuttle overcharge protection in Li-ion batteries and shuttle mediated flow batteries.1,3,45
Acknowledgments
The authors acknowledge Patrick McCormack for fabricating and providing Nafion/PVDF membranes. Funding in part for this research was provided by the National Science Foundation (Grant No. IIP-1700031) and the Center for Innovative Technology Commonwealth Research Commercialization Fund (Grant No. MF17–001-En).