
Abstract
Most cathode materials for lithium-ion batteries exhibit a low electronic conductivity. Hence, a significant amount of conductive graphitic additives are introduced during electrode production. The mechanical stability and electronic connection of the electrode is enhanced by a mixed phase formed by the carbon and binder materials. However, this mixed phase, the carbon binder domain (CBD), hinders the transport of lithium ions through the electrolyte pore network. Thus, reducing the performance at higher currents. In this work we combine microstructure resolved simulations with impedance measurements on symmetrical cells to identify the influence of the CBD distribution. Microstructures of NMC622 electrodes are obtained through synchrotron X-ray tomography. Resolving the CBD using tomography techniques is challenging. Therefore, three different CBD distributions are incorporated via a structure generator. We present results of microstructure resolved impedance spectroscopy and lithiation simulations, which reproduce the experimental results of impedance spectroscopy and galvanostatic lithiation measurements, thus, providing a link between the spatial CBD distribution, electrode impedance, and half-cell performance. The results demonstrate the significance of the CBD distribution and enable predictive simulations for battery design. The accumulation of CBD at contact points between particles is identified as the most likely configuration in the electrodes under consideration.
Export citation and abstract BibTeX RIS

This is an open access article distributed under the terms of the Creative Commons Attribution 4.0 License (CC BY, http://creativecommons.org/licenses/by/4.0/), which permits unrestricted reuse of the work in any medium, provided the original work is properly cited.
Lithium-ion batteries are the most important energy source for portable electronic devices due to their outstanding energy and power density. State-of-the-art Li-ion batteries typically consist of a graphite anode, a polymer-based separator, and a transition-metal oxide cathode. The most common type of cathode materials are Nickel-Manganese-Cobalt-Oxides (NMC) in varying compositions. High Nickel contents promise a higher nominal capacity and reduced material costs which make them very attractive for the next-generation of Li-ion batteries.1 However, these compounds have a very low electronic conductivity which even decreases with increasing lithium content.2
During electrode preparation conductive additives and binder materials are added to the electrode suspension. The binder improves the mechanical stability of the coating, namely the adhesion to the current collector3–5 and the mechanical interconnection between adjoining active particles.6 The conductive additives are typically carbon based and form a percolating network for electron transport in the electrode layer which largely improves the electrode conductivity.7 Due to the low density of these materials only a few wt-% of carbon black or similar conductive additives are needed to ensure an electric conductivity of the electrode exceeding the Li ion conductivity of the carbonate based liquid electrolytes. During suspension preparation, electrode coating and drying, the conductive additive and binder form a mixed phase (carbon binder domain, CBD) in which the individual components are hard to resolve using optical methods. The binder ensures the mechanical stability of this mixed phase. Generally, it is assumed that the conductive additive and binder are in intimate contact which is supported by SEM images and EDX spectra. The morphology of the CBD depends on the preparation conditions and can have a significant effect on the transport inside the pore space and the active surfaces of the electrode.8–10
Most importantly, it was reported that the CBD phase increases the tortuosity of the electrode layer for Li ion transport, which amplifies transport limitations in the electrolyte.11,12 Recently, several research groups demonstrated the use of impedance spectroscopy in a symmetrical cell setup to study the tortuosity of Li-Ion battery electrodes.13–16 A symmetrical cell consists of two identical electrodes separated by an electronically insulating material soaked with an electrolyte solution. The quality of measurement results can be improved by using a tailored non-intercalating electrolyte solution.15 Previous studies reported similar characteristic behavior if the electrode material is close to or fully lithiated.13 In both cases Faradaic contributions to the impedance spectra are negligible and the electrodes show capacitive behavior at low frequencies. Typically, the resulting impedance spectra are evaluated with the help of transmission line models.16 In the case of negligible electronic resistance of the electrode layers, this method gives a reliable prediction of the electrode tortuosity. Landesfeind et al. performed measurements on a model system consisting of stainless steel beads and found good agreement with the Bruggeman correlation.17 Additionally, they compared their results on NMC positive electrodes to predictions of diffusion simulations on tomography data of the same set of electrodes and conclude that deviations between the two techniques are due to the CBD.
The main problem is the spatial resolution of the CBD which consists of carbon particles of only a few nanometers in size. This is below the resolution of X-ray based techniques and other more involved approaches like FIB-SEM have to be applied.18–24 Only recently correlative techniques have been demonstrated for battery materials which address this issue.22,25,26 Although the impedance measurements on symmetrical cells provide a better estimate of the actual tortuosity of the electrodes, the technique does not provide information about the morphology or distribution of the CBD.27 The importance of the CBD for the performance of lithium-ion batteries recently triggered a number of publications which try to resolve the CBD morphology and distribution,9,25,28 as well as the effect on electrode performance.10,19,29–33 Xu et al.6 also resolve the electronic conduction inside the porous CBD phase, but do not resolve the spatial distribution inside the porous electrode. Several researchers studied the effect of the CBD on the electrode tortuosity and included this information in homogenized battery models of the Newman type in order to deduce the consequences on the electrochemical performance.32,34 It is important to note, that in these volume-averaged models local microstructural fluctuations affecting reaction and transport are not resolved. As a consequence local fluctuations in potential, concentration, or temperature are intrinsically not captured35. However, these fluctuations might trigger side reactions such as lithium plating which lead to battery degradation or failure. In our simulations we explicitly take into account the distribution of the CBD which causes local fluctuations of transport processes in the pore space and electrochemical reactions on the electrode surface. Moreover, by doing simulations on very realistic microstructures we take into account the true shape and size distribution of the particles which are often not resolved in Newman-type approaches36,37. The higher computational cost microstructure-resolved simulations is counterbalanced by additional information on the influence of local inhomogeneities and fluctuations which will become especially important for a proper prediction of degradation phenomena.
The correlation of structural data with the resulting impedance response can provide useful additional information for the design and failure analysis of battery electrodes. In our work we use microstructure-resolved simulations in order to connect structural information of the electrode and CBD with electrochemical performance. The simulations are performed on tomographic image data and on virtual electrode microstructures, which have been generated using stochastic microstructure models.38–41 Such models are first calibrated to image data of the electrodes under consideration, and can subsequently be used to generate virtual electrode morphologies, which can then be analyzed regarding their functional properties. Therefore, this work closes a gap in the analysis of Li-Ion battery electrodes and will provide a useful new tool for the design of new electrode structures.
In this article we present a study investigating the influence of CBD distribution on electrode impedance and performance by a combination of experimental techniques and microstructure-resolved simulations. The main focus of this publication is on the correlation of results from microstructure-resolved impedance simulations on symmetrical cells with the corresponding experiments. This allows us on the one hand to draw conclusions on the CBD morphology and on the other hand enables the prediction of electrode performance under galvanostatic conditions. The article is structured as follows: In the "Experimental" section we provide details of the electrode preparation procedure and present results of the structural characterization of the samples. In the next paragraph we give a short description of our model, parameterization, and simulation methodology before, finally, presenting results of electrochemical measurements and simulations.
Experimental
Electrode preparation
The composite positive electrodes were prepared with the active material LiNi0.6Co0.2Mn0.2O2 (NCM 622 BASF), conductive additives and polyvinylidene fluoride binder (PVDF, Solvay Solexis) in the weight ratio 93:3:4. The portion of passive materials was kept low to address conditions in industrial production and simultaneously maximize the energy density. The ratio of the conductive additives carbon black (Super P) and graphite (SFG6L) from Imerys (formerly Timcal) of 2:1 was chosen, to reach optimum properties deducted from different effects of the two types of carbon.42,43 Conductive carbon black leads to a lower percolation threshold enabling higher specific charge, whereas graphite additives help to improve the reversible charge density and the electrode adhesion and therefore to an improved processability. By adding both types of conducting carbons, we expect the combination of their positive properties. N-methylpyrrolidone (NMP, Sigma Aldrich) was used as solvent. All materials and substrates were used as delivered. All solid components were added to a planetary mixer at once and dry-mixed for 10 min before the first portion of solvent was added. The mixture was kneaded for 190 min at a temperature between 40 °C and 68 °C and at a maximum stirring rate of 700 rpm. The subsequent addition of small amounts of NMP reduces the total solid content from 89% to 86%. After this phase of homogenization, the suspension was diluted stepwise at a lower stirring rate of 200 rpm to yield a final total solid content of 73.53%. The suspensions was left overnight under reduced pressure and agitated the next day. Immediately after agitation, the suspension was cast on an aluminum foil (Korff AG, Switzerland) with a thickness of 20 μm as a current collector to yield an electrode with an areal mass loading of 20 mg cm−2. The electrode was coated and dried using an electrode coating pilot line (LACOM GmbH, Germany) with a comma bar system and four different drying zones (total length: 8 m). The speed of the coating was set at a belt speed of 1 m min−1. After coating, the electrode was calendered to yield a density of the composite of 3.0 g cm−3 with a thickness of the electrode composite of 67 μm, which corresponds to a porosity of 31%. Before calendering the electrode thickness was 75 μm, which corresponds to a porosity of 39%.
Cell assembly
The electrodes were punched into disks with a diameter of 1.2 cm and 1.6 cm respectively (area of 1.131 and 2.011 cm2) and thoroughly dried for 16 h at 130 °C under vacuum. Half-cells were assembled by using 2032 coin cells, in which lithium foil was used as a counter electrode and the electrode with an area of 1.131 cm2 as a working electrode. Two layers of a GF/A (Whatman glass fiber) were employed as a separator. The electrolyte used was 1.0 M LiPF6 in a mixture of ethylene carbonate and ethylmethyl carbonate (ratio 3:7 by weight) with an additional 2 wt-% of vinylene carbonate (BASF). The symmetrical coin cells were prepared analogously to the half-cells, except for the fact, that instead of a lithium foil, a larger disc (2.011 cm2) of the same electrode was used to face the electrode under investigation. Electrodes with different diameters were used in order to ensure complete overlap of the electrode under investigation.
Electrochemical characterization
All galvanostatic tests were carried out using a cell test system from BaSyTech GmbH (Germany). After assembling, the cells were allowed to rest for 24 hours, before they were formed by three consecutive, galvanostatic symmetric cycles at C/10 between 3 and 4.3 V. Thereafter, a rate capability test commenced to examine the capacity utilized as a function of discharge rate. The rate capability test involved 3 consecutive cycles at one current density before changing to the next current density: 1 mA cm−2, 3 mA cm−2, 6 mA cm−2, 8 mA cm−2, 10 mA cm−2 and 12 mA cm−2 in the voltage range between 3 and 4.3 V. After cycling at 6, 8 and 10 mA cm−2 one additional cycle was performed at 1 mA cm−2 respectively to check the capacity retention. The charge rate was constantly 1 mA cm−2 with a consecutive constant voltage step at 4.3 V, to ensure complete delithiation of the cathode.
Cross-section and SEM-EDX investigation
Cross sections of electrodes were generated by broad-beam argon ion milling (Hitachi IM4000Plus). Milling time was at least 2 h at an ion beam voltage of 5 kV. Scanning Electron Microscopy (SEM) and energy dispersive X-ray spectroscopy mapping (EDX) was carried out using a LEO 1530 VP microscope equipped with a Gemini thermal field emission column to investigate the morphology and the elemental distribution of the electrodes. SEM images were obtained with a secondary electron detector at accelerating voltages between 4 and 5 kV. Fluorine was used as tracing element for the presence of the PVDF binder. Due to the sample heterogeneity, EDX is not perfectly suited to determine absolute concentrations of certain elements, however, observation of relative changes of the count rate under constant conditions has turned out to be a feasible method for gathering reliable information.8 Nevertheless, the absolute values strongly depend on the measuring parameters and therefore this technique only allows a qualitative interpretation.
Microstructural image analysis
The microstructure-resolved simulations for the calculation of electrochemical impedance spectra will be performed on tomographic image data of those electrodes described in Section "Electrode preparation". Tomographic imaging has been performed at the synchrotron X-ray facility BAMline (BESSYII, Berlin, Germany).44 A monochromatic X-ray beam was produced by an Si-W multilayer monochromator. The energy was 25 keV and an energy resolution of ΔE/E = 10−2 was applied. The X-rays were converted into visible light using a cadmium tungstate scintillator screen. The field of view covered by the optical lens system in combination with a CCD-camera (PCO camera, 4008 × 2672 pixel) was 1.8 × 1.2 mm2. With an exposure time of 2.5 seconds, 2200 projections were measured over an angular range of 180°. The side length of a voxel in the reconstructed image is 438 nm. After reconstruction, a 16-bit grayscale image of the electrode has been created. In order to perform the electrochemical simulations, a binarization of the image data is necessary, i.e. the grayscale image has to be transformed into a binary image, where one phase shows the active material particles, and the other phase the union of pores, binder and additives. Note that, due to the low contrast, it is not possible to differentiate between the CBD and pores, therefore, it will be added on a model basis later. The binarization was done by global thresholding, i.e. every voxel with a value larger than the threshold is assigned to the active material particles, and every other voxel to the remaining part. The threshold is chosen such that the correct volume fraction of the active material particles is matched, where the correct volume fraction can be calculated from the weight ratio of the materials and their densities. Doing so, we get a volume fraction of 57.4 vol-%. An image of the resulting binarization for a cutout of the dataset is shown in Fig. 1c.
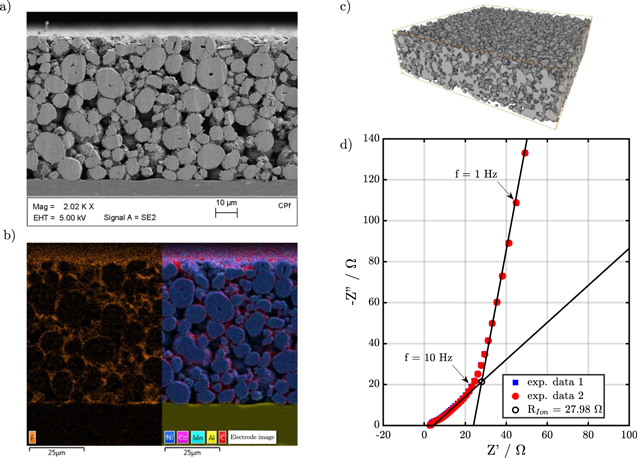
Figure 1. (a) Cross section of electrode, (b) EDX, (c) reconstruction from tomography data and (d) Symmetrical Impedance.
Download figure:
Standard image High-resolution imageSimulation
In this section we provide a detailed description of our simulation methodology. We will pay specific attention to the preparation of virtual structures with different CBD model distributions, the description of transport equations, the derivation of interface models, and the parameterization strategy. The simulation procedure for the calculation of impedance spectra is finally presented in Section "Methodology".
Conductive additive and binder models
Figures 1a and 1b show a SEM cross-cut of the NMC positive electrode and a corresponding EDX mapping. The fluorine and carbon signals of the EDX spectra indicating the position of binder (orange) and conductive additive (red) are displayed on the left and right side of Fig. 1b, respectively. The images demonstrate a relatively homogeneous distribution of the active material, conductive additive, and binder across the electrode thickness. However, the data is only qualitative in nature due to the method-inherent spacial resolution limit, and reliable conclusions regarding the morphology and distribution of the CBD are difficult. A reconstruction of the CBD based on the image data is work in progress and first results are reported in Ref. 10. Different approaches are presented in the literature which are mostly purely geometric in nature.29 In Ref. 32 the authors take into account adhesive forces with the active material and within the CBD to provide a physically motivated algorithm for the CBD distribution. In this work we propose three simple geometrical algorithms for the distribution of the CBD resulting in different configurations previously reported in the literature. The different algorithms are based on custom implementations in the software GeoDict45 and a detailed description of it is provided in the paragraphs below. The amount of CBD to be distributed is mainly a result of the electrode composition which is adjusted in the preparation process (cf. Section "Electrode preparation"). The final volume fraction depends on the densities of the components and we calculate a value of 11 vol-%. The calculation can be found in the supporting information (available online at stacks.iop.org/JES/167/013546/mmedia). Moreover, we assume that the CBD after uptake of the electrolyte solution and swelling has an an intrinsic porosity of 50%.19,25 As a result the volume fraction of CBD which is distributed in the pore space of the active material superstructure is 22 vol-%. The effective conductivity inside the porous CBD phase is determined through conductivity simulations, that are presented in first part of the results. In combination with the data obtained by the impedance measurements on symmetrical cells this approach allows to deduce the effective transport of the electrodes.
Random
In Refs. 19, 25 the authors describe the CBD phase as a cloud-like structure in the void space between active material particles. In order to reproduce this morphology, carbon-binder particles are distributed randomly inside the pore space of the electrodes.19 The diameter of these particles is set to 1 μm. The random distribution of the CBD particles creates a porous CBD network which is illustrated in Fig. 2b.
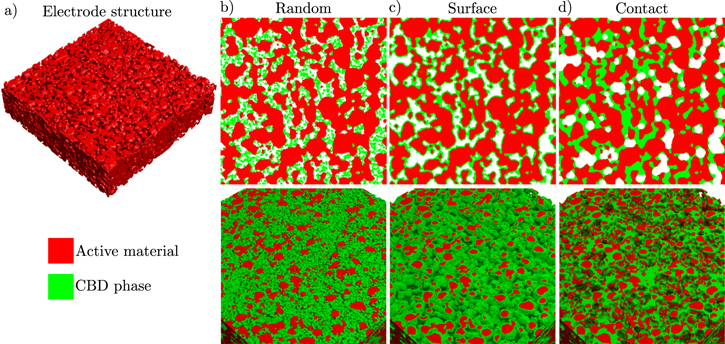
Figure 2. (left) Microstructure of real electrode. (right) The spatial distribution of the CBD phase (green) within the NMC structure for the random generator, the surface generator and the contact generator. (upper) 2D cut (lower) 3D.
Download figure:
Standard image High-resolution imageSurface
In this algorithm, the CBD is distributed as a smooth film on the surface of the active material. This corresponds to a "coating" of the active material as it is reported e.g. in Refs. 46, 47 after intensive dry mixing. The CBD forms sort of an interlayer on the electrode surface and the resulting distribution is shown in Fig. 2c.
Contact
In this approach, the CBD phase is only added close to contact points of active material particles. This effect is achieved by a morphological closing algorithm.48 Based on the image data presented in Fig. 1b we identify this alghorithm as the most likely one for the electrodes at hand. Similar morphologies are also reported in46,47 using conventional mixing conditions. The resulting virtual CBD distribution is illustrated in Fig. 2d.
Transport equations
BEST49 developed in a collaboration between Fraunhofer ITWM Kaiserslautern and the DLR Institute of Engineering Thermodynamics. The simulations are able to provide the temporal and spatial distribution of Li concentration, potential, and temperature. A summary of the governing equations for isothermal simulations presented in this work is given in Table I and a detailed derivation of the model is provided in Refs. 35, 50. In this work we provide a short summary of the physical processes which are taken into account and describe extensions of the model which are needed in order to simulate electrochemical impedance spectra. The conservation equation of lithium mass is used to determine the concentration ck (k = El, So) of Li in the electrolyte (Eq. 12) and active material (Eq. 14). In the active material we assume that the transport of lithium atoms is a diffusion process which can be described by Fick's law and a constant diffusion coefficient DSo (Eq. 18). In the electrolyte the transport of lithium ions is more complex. In addition to the diffusion process described by the first term in Eq. 16, migration of the lithium ions in the electric field, as well as interactions between different ions are taken into account. The constitutive equation for the determination of the electrostatic and the resulting electrochemical potential of lithium ions in the electrolyte  is the conservation of charge given by Eq. 13. Note, that we assume electro-neutrality of the electrolyte solution at a sufficient distance from the electrode surface. This will be discussed in more detail in the next section. The transport of electrons in the solid phase is described by Ohm's law (Eq. 19) and we use a corresponding charge balance Eq. 15 to determine the potential ΦSo. The electric conductivity of the solid phase within the electrodes is typically orders of magnitude larger than the ionic conductivity of the electrolyte. Therefore, we do not resolve the contribution of the CBD to the electronic transport. Instead we assign an effective solid phase conductivity of the conduction network to the active material phase. Details of this approach are provided in Section "Parameters and operation". In order to describe the effect of the CBD on electrolyte transport, we use reduced transport properties of the lithium ions in the electrolyte, namely the diffusion coefficient DEl and the conductivity κEl. The effect of the CBD on charge transfer kinetics is modeled through a reduced surface area in the CBD region in contact with the active material. This approach takes into account the tortuosity of the microporous CBD network as well as blocked surface by the binder and carbon black particles.
![$\displaystyle \frac{\partial {c}_{\mathrm{El}}}{\partial t}=-\vec{{\rm{\nabla }}}\cdot {\vec{N}}_{\mathrm{El}}\quad [12]$](https://content.cld.iop.org/journals/1945-7111/167/1/013546/revision1/jesab6b1dieqn2.gif)
![$0=-\vec{{\rm{\nabla }}}\cdot {\vec{j}}_{\mathrm{El}}\quad [13]$](https://content.cld.iop.org/journals/1945-7111/167/1/013546/revision1/jesab6b1dieqn3.gif)
![$\displaystyle \frac{\partial {c}_{\mathrm{So}}}{\partial t}=-\vec{{\rm{\nabla }}}\cdot {\vec{N}}_{\mathrm{So}}\quad [14]$](https://content.cld.iop.org/journals/1945-7111/167/1/013546/revision1/jesab6b1dieqn4.gif)
![$0=-\vec{{\rm{\nabla }}}\cdot {\vec{j}}_{\mathrm{So}}\quad [15]$](https://content.cld.iop.org/journals/1945-7111/167/1/013546/revision1/jesab6b1dieqn5.gif)
![${\vec{N}}_{\mathrm{El}}=-{D}_{\mathrm{El}}\vec{{\rm{\nabla }}}{c}_{\mathrm{El}}+\displaystyle \frac{{t}_{\pm }}{F}{\vec{j}}_{\mathrm{El}}\quad [16]$](https://content.cld.iop.org/journals/1945-7111/167/1/013546/revision1/jesab6b1dieqn6.gif)
![${\vec{j}}_{\mathrm{El}}=-{\kappa }_{\mathrm{El}}\vec{{\rm{\nabla }}}{\varphi }_{\mathrm{El}}+{\kappa }_{\mathrm{El}}\displaystyle \frac{1-{t}_{\pm }}{F}\left(\displaystyle \frac{\partial {\mu }_{\mathrm{El}}}{\partial {c}_{\mathrm{El}}}\right)\vec{{\rm{\nabla }}}{c}_{\mathrm{El}}\quad [17]$](https://content.cld.iop.org/journals/1945-7111/167/1/013546/revision1/jesab6b1dieqn7.gif)
![${\vec{N}}_{\mathrm{So}}=-{D}_{\mathrm{So}}\vec{{\rm{\nabla }}}{c}_{\mathrm{So}}\quad [18]$](https://content.cld.iop.org/journals/1945-7111/167/1/013546/revision1/jesab6b1dieqn8.gif)
![${\vec{j}}_{\mathrm{So}}=-{\sigma }_{\mathrm{So}}\vec{{\rm{\nabla }}}{{\rm{\Phi }}}_{\mathrm{So}}\quad [19]$](https://content.cld.iop.org/journals/1945-7111/167/1/013546/revision1/jesab6b1dieqn9.gif)
Interface model
In the previous section we described our model for the transport of lithium atoms and ions in the bulk materials of a Li-Ion battery. Up to this point we omitted a discussion of the processes at the electrode surface. As soon as two materials with different electrochemical potential are in contact, the formation of a thin interfacial layer is observed. For liquid electrolytes this interface layer is often referred to as the electric double layer (EDL). For conventional liquid electrolytes the thickness of this layer is in the order of only a few nanometers. The finite thickness of the EDL induces large electric fields which in turn cause a layering of cations and anions close to the electrode surface. This image is well reflected in the classical descriptions of the EDL provided by Helmholtz,51 Gouy52 and Chapman.53 Despite the intensive research on the EDL only few researchers addressed the influence of the EDL on charge transfer kinetics. Typically, the de-/intercalation in the active host material and plating and stripping of lithium in Li-Ion batteries is described by Butler-Volmer type kinetic expressions which provide a simple and efficient description of the charge transfer process. However, it does not provide a description of the processes in the electrochemical double layer. In previous work we derived a model which provides a self-consistent continuum description of the electric double layer and allows to study the effect of desolvation and adsorption barriers of Li ions on electrode kinetics.54,55 In this work we use a simple model of a parallel plate capacitor with constant areal capacity to describe the effect of the double layer in order to reduce computational complexity, but integration of the model presented in Ref. 55 in our simulation framework is straight forward. The current response iDL to a change in the electrostatic potential across the double layer is described by

where CDL is the double layer capacity, ΔΦ the difference between the electrical potential in the active material and electrolyte across the double layer

Note, that in our simulations we solve for the electrochemical potential of lithium ions in the electrolyte  which is defined by50
Here,  is the chemical potential of lithium ions in an arbitrary reference state and aEl the activity of lithium ions in the electrolyte. We assume that response of the double layer to changes in the electric field is orders of magnitude faster than the transport in the electrolyte. Thus, changes in the activity of lithium ions in the bulk electrolyte close to the surface are negligible on this time scale and the time derivative of the electrostatic potential difference (Eq. 2) can be approximated by

In our extended description of the interface, we assume that this double layer current iDL is in parallel to the Faradaic contributions. At the cathode, the lithium de-/intercalation is described by a classical Butler-Volmer expression
The parameters of the Butler-Volmer equation are the exchange current density i00, the maximum Li concentration in the host material  , the symmetry factor α, and the overpotential driving the reaction defined by
At the metallic Li metal anode the kinetic expression reduces to
We emphasize that our approach is generic and different expressions for Faradaic processes and double layer currents can also be used to improve the level of detail of our modeling approach. The governing equations in the active material and the electrolyte are coupled through so called interface conditions which provide a description of the mass and charge which is exchanged between the two phases


NBV and NDL are the corresponding molar interface fluxes of lithium given by iBV/F and iDL/F, respectively. Note, that the expressions describing the exchange of lithium are not symmetrical. We assume that lithium ions which are adsorbed at the electrode surface do not contribute to bulk electrolyte transport. On the other hand, adsorbed ions are not counted as intercalated ions and do not contribute to cSo on the electrode surface. This introduces a small mass defect in our simulations and underlines the need for improved continuum descriptions of double layer processes. This defect is negligible compared to the overall lithium inventory of the battery cell and, thus, does not affect the simulation of impedance spectra and discharge curves. However, adsorbed lithium species might be important for degradation processes such as lithium plating56 and refinements of our description of the interface are planned for future work.
Parameters and operation
In this section we will briefly discuss the parametrization of our electrochemical model described in the previous paragraphs. In order to improve qualitative predictions of the simulations, an independent parametrization of anode, cathode, and electrolyte properties is essential. In analogy to the experimental setup, symmetrical cells consist of two virtual NMC622 cathodes facing each other. The electrode structures were reconstructed from the tomography data as described above. A schematic image of the cell setup is shown in Fig. 3a. The two electrodes are separated by a porous Whatman flass fiber separator. In our simulations we do not resolve the microstructure of the separator. Moreover, we assume that the material is compressed during cell assembly and, hence, also the exact thickness of the separator is unknown. In our simulations we use a thickness of 100 μm and extract an reduced conductivity from the high frequency intersection of the symmetrical impedance spectra. Based on this analysis an effective conductivity which is 50% of the bulk electrolyte conductivity provides good agreement with the experimental data. For half-cell simulations one of the NMC622 electrodes is replaced by a lithium metal anode as depicted by in Fig. 3b. Geometrical properties of the electrode reconstructions are discussed in the first part of the results.
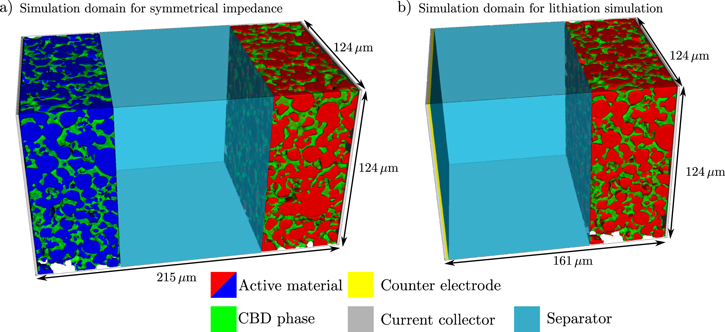
Figure 3. The simulation domain for (a) symmetrical impedance and for (b) lithiation simulations is presented. The separator is not spatially resolved, but represented through effective transport parameters.
Download figure:
Standard image High-resolution imageThe capacity and the concentration dependent open circuit voltage U0 of the NMC622 active material is given in our previous work.10 The lithium diffusion coefficient was deduced from concentration dependent data provided in the literature.1 At this stage we use an average diffusion coefficient in our simulations neglecting the effect of lithium concentration on the mobility of lithium in the host structure. The parameters of the NMC de-/intercalation kinetics were adjusted in previous work10 to experimental data at different currents. The effect of a reduced surface area at the interface between the active material and the CBD is taken into account by correcting the exchange current density with the volume fraction of the pore space in the CBD phase which is a measure for the accessible surface. Therefore, the active surface area at the contact between solid and CBD is reduced by 50%. The effective conductivity of the electrode is dominated by the conductivity of the CBD phase which provides a percolating conduction network. By using transport simulations we determine an effective electrode conductivity of ≈0.1 S m−1.10 The effective electrode conductivity for the different CBD configurations can be calculated using transport simulations on the electrode structure, which includes the active material and the CBD phase. We found in all cases, that the conductive network is not limiting the battery performance. Additionally, the linear increase in the symmetrical impedance indicates, that all parts of the electrodes are connected to the conduction network and the electronic transport in the solid part of the electrode is not a limiting factor. In our simulations we do not explicitly solve for the transport of electrons in the CBD phase. Instead, the electronic conduction is limited to the solid region, which is defined by the active material. Therefore, we assign an average conductivity to the solid part of the electrode. This average conductivity is determined by transport simulations on the electrode structure given by the active material. An average conductivity of 2.8 S m−1 results in the same effective electrode conductivity of 0.1 S m−1, which was determined on the electrode structures including the CBD phase. The Li metal anode is modeled as a flat electrode. The parameters of the plating/stripping kinetics are taken from measurements on symmetric cells with organic solvent reported in the literature.57 Similar values are reported for other carbonate based electrolyte systems.58,59 Correlations of the most important electrolyte transport parameters were fitted to the data measured by Nyman et al.60 Finally, the impedance measurements on symmetric cells provide the pore transport resistance of the electrode which we use to determine the effective conductivity of the electrolyte. This is explained in detail in Section "Structural characterization" below. In the case of the Contact configuration the effective conductivity of the CBD phase is determined to 1.78% of the bulk electrolyte conductivity. As can be seen in the following sections, the Contact configuration is the only morphology to reproduce the experimental data. Therefore, the transport of the CBD phase is reduced by the factor of 1.78% for all cases. Note, that in this respect the different CBD configurations are essentially the only degree of freedom to reproduce the experimental data in this work. A summary of all parameters and corresponding correlations can be found in Table SI-1 in the supporting information.
Methodology
Electrochemical impedance spectroscopy
Electrochemical impedance spectroscopy provides important insights on the time scale and resistance of electrochemical processes in electrochemical devices. Therefore, theoretical predictions of the electrode impedance based on a mathematical description of relevant processes are extremely valuable. Typical impedance models are based on analytical solutions of the governing equations in the frequency domain.61–63 These simple models are extremely helpful to extract physical or kinetic parameters, e.g. by interpreting experimental data with a resulting equivalent circuit model.64,65 However, these models usually provide an integral description of the electrode, and local variations in the electrode structure due to e.g. processing conditions are typically neglected. Moreover, because these models rely on analytical solutions of the governing equations, the physical complexity is often limited to the most important processes. In order to overcome these limitations, different strategies based on a numerical solution of the full system of partial differential equations were suggested in the literature. In analogy to the experimental procedure, the virtual cell is subject to sinusoidal excitations with different frequencies and the impedance magnitude and phase shift at each frequency can be calculated from the corresponding current or voltage signal, respectively.66 It is well known from linear response theory that the impedance spectra can also be obtained from relaxation experiments.67 This technique is frequently used in dielectric spectroscopy or dynamic mechanical analysis e.g. to obtain frequency dependent loss moduli from relaxation experiments (see e.g. the reprint of the classical book of Findley et al.68 and used by Bessler et al.69 for EIS. The impedance spectrum in the frequency domain is obtained from discrete Fourier transforms of the voltage and current signals using a discrete Fourier transform.70 This approach has the significant advantage that the whole impedance spectrum can be simulated in a single simulation run which is very efficient. Adopting this classical approach allows us to calculate for the first time impedance spectra based on microstructure-resolved electrochemical simulations. Starting at equilibrium conditions, the cell potential is increased linearly by 2 mV in 10−5 s approximating the aforementioned step excitation. Afterwards the relaxation of the battery toward equilibrium is monitored in the simulations for 105 s. The simulation time for one impedance spectra of a symmetrical cell on the compute cluster JUSTUS using 16 cores is around 4 days.
Galvanostatic lithiation
In order to asses the performance of the electrodes and the correlation to the corresponding symmetrical impedance spectra, galvanostatic lithiation simulations following the measurement procedure described in Section "Electrochemical characterization" were performed. We assume that after the constant current—constant voltage charge protocol the electrodes are lithiated homogeneously. Starting from the same initial conditions, a galvanostatic lithiation of the NMC622 electrodes was simulated with different current densities between 1 and 12 mA cm−2. Results of the simulations are evaluated in Section "Galvanostatic lithiation simulations" below.
Results and Discussion
In this section, we will present results of the different experimental and theoretical techniques described above. The goal of our discussion is to establish the link between structural properties and electrochemical performance. This link is provided through 3D microstructure-resolved simulations of symmetrical impedance spectra and galvanostatic lithiation simulations on the same set of electrodes. Therefore, this section is divided in three parts focusing on structural characterization of the electrodes and CBD distribution, the simulation of impedance spectra, and, finally, the simulation of the galvanostatic lithiation process at different currents.
Structural characterization
SEM and EDX cross-cuts
Fig. 1a presents a SEM image of a cross-cut of the NMC622 electrode. The corresponding EDX mapping of the cross-cut shown in Fig. 1b provides visual information on the distribution of different characteristic elements. The left-hand side of the figure shows the distribution of fluorine which is characteristic for the PVDF binder. The image indicates a relatively homogeneous distribution of the binder across the electrode thickness. The right-hand side of the image shows the active material particles in blue color reflecting the high Ni content of the NMC622 material, the Al current collector in yellow at the bottom, and traces of carbon on the NMC622 surface and in between the active material particles corresponding to the conductive additive in red. The EDX data indicates that binder and carbon indeed form a joint network in the porous structure of the active material particles, however, quantitative analysis of the CBD distribution is challenging. The SEM cross-cut shown in Fig. 1a suggests that the CBD has a quite dense morphology and is mainly located at the contact points of the NMC particles. In the paragraphs below we will use the virtual electrodes with different CBD distributions to further investigate this issue.
Impedance spectra of symmetric cells
Impedance spectra of NMC622 electrodes measured in two symmetrical cells are shown in Fig. 1d. The spectra show the typical features of blocking electrodes in symmetrical configuration reported in the literature.15 At very high frequencies we see the onset of a small semi-circle, which is probably related to a imperfect electrical contact between electrode layer and current collector. With decreasing frequency we observe a linear increase of the imaginary part, which finally diverges at low frequencies. As discussed in Ref. 15 the resistance at the deflection point can be used to determine the pore transport resistance. We fit two straight lines to the impedance at low and high frequencies. The intersection of the lines is at approximately RIon = 27.98Ω. After subtracting the electrolyte resistance in the separator RSep, the pore transport resistance  13 was found to be 35.06Ω. Based on this result we are able to calculate the relative conductivity
  of the electrode, including contributions of the CBD. This value is rather low confirming the observation of the SEM images that the CBD has a dense morphology which significantly increases the overall tortuosity of our electrode sample.
Tomography data and virtual electrodes
In order to correlate the relative conductivity measured by impedance spectroscopy to the structural properties of the electrode, we use synchrotron tomography to obtain 3D reconstructions of the electrode samples. As discussed under "Microstructural image analysis" a reconstruction of the CBD phase was not possible, due to the low contrast with the remaining pore network. The tomography data is combined with the CBD generators presented above to provide a qualitative analysis of the effect of CBD morphology. The distribution of active material, CBD, and pore space for the different structural scenarios is presented in Fig. 4. The distribution of active material volume fraction across the electrode thickness as reconstructed from the tomography data is represented by the solid lines in Fig. 4a. The dashed lines indicate the volume fraction of the remaining pore space which also includes CBD volume fraction not resolved in the synchrotron measurements. We evaluate three different regions of the electrode sample in order to assess inhomogeneities in the electrode sheet on the length scale of a few millimeters which can be imaged in the experimental setup. The different cut-outs show a very similar distribution of active material. Close to the current collector and separator the volume faction gently falls to around 20 vol-% which we use as a lower limit in order to ensure electrical contact. At around 10 μm from these edges, corresponding to the average diameter of the active material, the volume fraction reaches an average value of ≈55 vol-%. Figure 4a shows a minor gradient in active material volume fraction which could be probably due to the calendering process or due to an existing gradient of CBD similar to.10 The thickness of the electrode samples characterized by synchrotron tomography is around 59 μm, except for cut-out A which is slightly thinner (56 μm). This is about 10% less than the thickness measured on the electrode sheets after the calendering step and also determined from SEM cross-cuts. This indicates that the areal capacity of the imaged sample is slightly smaller than the average areal capacity determined by the electrochemical measurements presented below. In order to assess the influence of the fluctuations in electrode thickness we perform additional simulations on virtual electrode realizations generated based on a stochastic microstructure model.41 The model is calibrated to the image data under consideration, and realizations are then drawn in a larger sampling window, such that the thickness of the virtual electrodes corresponds to the thickness measured in the SEM images. More information on the stochastic microstructure model, the comparison of morphological properties between the virtual and imaged electrodes as well as a comparison of lithiation simulations of the virtual and imaged electrodes is presented in the electronic supporting information. In summary, lithiation simulations on the virtual electrodes with the same thickness like the imaged electrode are in good agreement. This indicates that electrochemical properties of the virtual samples are very much in line with the electrochemical properties of the imaged sample. Finally, lithiation simulations of the virtual electrodes with the same thickness as observed in the SEM cross-cut show good agreement with the electrochemical measurements. Closing our argument that the microstructure resolved simulations indeed provide a realistic description of CBD morphology and corresponding electrochemical performance. Figures 4b–4d present the CBD distributions across the electrode resulting from the different CBD generators. The three generators provide qualitatively different CBD morphology and distributions. In the random distribution approach (Fig. 4b the generator places the CBD with the same probability in the pore space of the electrode. Since the porosity of the electrode is higher close to the current collector and separator we get higher CBD contents in this regions. The Surface generator (Fig. 4c equally distributes the CBD on the surface of the active material particles resulting in a more homogeneous distribution across the electrode thickness. Finally, the Contact configuration (Fig. 4d preferentially places CBD phase at contact points of active material particles. Due to the lower volume fraction of active material close to the edges, meaning less particles and a lower coordination number, we observe a drop in CBD volume fraction close to the separator and current collector. Note, that the formation of the CBD network is, of course, much more complex than the simple geometrical models presented in this work and deviations from the distributions discussed above can be expected due to e.g. binder migration or swelling.

Figure 4. (a) Volume fraction of the active material and pore space along the through direction for the three electrode cutouts. The distribution of the CBD along the through direction in (b) for the Random generator, in (c) for the Surface generator, and in (d) for the Contact generator.
Download figure:
Standard image High-resolution imageFinally, we are interested in the effect of CBD morphology and distribution on the effective transport in the electrolyte. Figure 5a shows the relative conductivity  of the different configurations. Filled circles, squares, and triangles indicate varying values of the relative CBD conductivity corresponding to 35.36%, 1.78%, and 0%, respectively. The first value corresponds to the standard Bruggeman correction for our assumed CBD porosity of 50%. The relative conductivities of all configurations are close to the relative conductivity of the tomography data without CBD and by one order of magnitude larger than the value determined by impedance spectroscopy (black dashed line). This indicates that the CBD contribution is significantly larger. Note, that the simulations on the tomography data without CBD represent the limiting corresponding to negligible influence of the CBD on electrolyte transport properties.
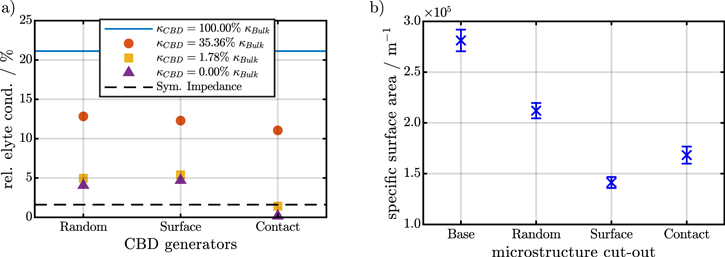
Figure 5. Relative electrolyte conductivity (left) and specific surface area (right) of virtual electrodes prepared with different CBD generators. (a) Red circles, yellow squares, and purple triangles represent relative electrode conductivities determined for relative CBD conductivities of 35.36%, 1.78%, and 0%, respectively. (b) Active surface area between electrolyte and active material. At the interface between CBD and active material the active surface area is reduced by 50% corresponding to the CBD porosity. Error bars indicate standard deviations determined on three different electrode cutouts.
Download figure:
Standard image High-resolution imageNext, we would like to discuss the case of a totally blocking CBD phase (0% relative CBD conductivity). The relative conductivity simulations show that the agreement to the experimental data is significantly improved. However, even in this extreme case the Random and Surface configuration provide a higher relative conductivity than the EIS measurements. Only the Contact generator provides a lower conductivity. This confirms our observations of the SEM and EDX cross-cut images that the contact configuration is closest to the experimental reality for the electrodes investigated in this work. Finally, we iteratively adjusted the CBD conductivity to match the electrode conductivity obtained from the EIS data. The resulting conductivity in the CBD phase is only 1.78% of the bulk electrolyte conductivity.
At last, we investigate the effect of the CBD distributions on the specific active surface area. The different CBD generators assume a CBD porosity of 50%. Following this assumptions we reduce the active surface between regions with CBD and active material by 50% with respect to the geometric surface area. The resulting surface areas71 for the different CBD morphologies are shown in Fig. 5b. The Surface generator creates a CBD distribution which covers almost the whole electrode surface. Therefore, the specific surface areas of the Surface generator are the smallest of all configurations. The Contact generator provides an intermediate surface area and for the Random configuration the specific surface area is closest to the uncovered active material surface. In the next section we will evaluate the influence of the structural parameters on the impedance spectra by microstructure-resolved simulations.
Impedance simulations
In this work microstructure-resolved impedance simulations are applied to link the symmetric impedance spectroscopy measurements with the structural information deduced from the synchrotron tomography. Therefore, we provide a direct link of the impedance simulations with experimental data. First, we will discuss impedance simulations on symmetric cells before we move on to half-cell data of the same NMC cathodes against a lithium metal counter electrode.
Symmetric cells
Figure 6a presents symmetrical impedance spectra of the NMC622 electrodes investigated in this work. Lines represent the simulation results and experimental data is displayed by solid symbols. In all impedance simulations we use the same initial conditions and the same set of parameters with a relative conductivity of the CBD of 1.78%. Thus, all differences between the different simulations are due to structural variations originating from the different cut-outs and CBD generators. Moreover, we investigate the effect of electrode thickness on the impedance spectra. Virtual electrodes are generated based on a stochastic microstructure generator (cf. electronic supporting information) with similar morphological properties but with the same thickness observed in the SEM cross-cuts. Moreover, an additional control sample with the same thickness as the reconstructed electrodes is generated. The two virtual electrodes are labeled according to their thickness as Virtual (58 μm) and Virtual (67 μm), respectively. In all cases the Contact generator was used to distribute the CBD phase. The virtual structure with the thickness as extracted from the SEM images shows a very good agreement with the experimental measurements and follows the ideal behavior predicted for homogeneous electrodes with negligible electronic resistance. At high frequencies we see a linear increase of the imaginary part followed by a diverging imaginary part at low frequencies. The impedance spectra of the thinner virtual electrodes (Virtual (58 μm)) have as expected a slightly smaller pore transport resistance. The small deviation between the thin virtual electrodes and the electrodes reconstructed from synchrotron tomography is probably due to the slight drift in electrode porosity identified in Fig. 4a or the differences in geodesic tortuosity shown in Fig. SI-3. Moreover, we attribute the slight deviation from a linear increase of the imaginary part at high frequencies to the same origin. Still, the deviation between the virtual and reconstructed electrodes is within the standard deviation of the different sample cutouts. This indicates that the virtual structures provide a solid basis to extrapolate simulation results to a different electrode thickness. In the remainder of this article we will use the electrode microstructures, which are reconstructed from synchrotron tomography, in order to provide a qualitative discussion on the influence of the CBD distribution on cell impedance and performance. Additional simulation results for the virtual structures are presented in the electronic supplementary information.

Figure 6. (a) The symmetrical impedance spectra for the three different microstructure sources. The impedance spectra for the pore space and the three CBD generators in a (b) symmetrical setup and (c) half-cell setup.
Download figure:
Standard image High-resolution imageFigure 6b shows simulated electrochemical impedance spectra of reconstructed electrode realizations with different CBD configurations in a symmetric cell setup. The color coding, referring to three different cut-outs of the electrode sample introduced above, corresponds to the data presented in Fig. 4. As expected, the smallest impedance is observed for the simulations using the tomography data without CBD phase (solid lines). Differences between the three cut-outs are negligible, however, the deviation from the experimental data is quite remarkable. This result already indicates that large deviations between simulated lithiation curves and experimental data can be expected (cf. Figure 7). Similarly, the simulations of the Random and Surface CBD configurations given by the dashed and dashed-dotted lines, respectively, underestimate the symmetric cell impedance. Only the electrodes prepared with the Contact CBD generator provide a similar impedance like the experiments. This indicates that the deduced conductivity of the CBD phase provides a realistic estimate for the electrode transport properties. The Contact configuration amplifies the fluctuations in electrode thickness between the different cut-outs. The thinner cut-out A has a slightly lower impedance compared to cutouts B and C. Note, that both, the measurements and the simulations, deviate from the expected 45° angle of the ideally blocking electrodes reported in.15 We attribute this to a deviation from ideally blocking conditions both in the simulations and experiments. Another possible source of this deviation could be the complex pore morphology as shown by Cooper et al.72

Figure 7. The cell voltage during discharge with six different currents for (a) the experimental data, (b) the simulation of the microstructures without influence of the CBD on the electrolyte transport (κeff = κBulk) and (c) the simulations with the Contact generator. (d) A direct comparison of the cell voltage for the three generators and the experimental data for four selected currents.
Download figure:
Standard image High-resolution imageHalf-cell impedance
Figure 6c shows the corresponding impedance spectra of the different CBD generators in half-cell configuration at a depth of discharge of 50%. With the help of our simulations we can assign the first semi-circle to the lithium metal anode and the second semi-circle represents charge transfer at the cathode/electrolyte interface. At low frequencies we observe a Warburg-type contribution to the impedance spectra originating from the diffusion of lithium in NMC622. In previous section we discussed the effect of the CBD on relative conductivity and the active surface area. The tomography data without CBD shows the best transport properties as well as the highest active surface area. Consequently, the resulting impedance is smaller compared to the electrode realizations including CBD phase. The Random configuration given by the dashed lines results in a similar relative conductivity like the Surface configuration displayed by dash-dotted lines. At high frequencies the deviations between the two generators are marginal until the local minima between the two semi circles. From this point on, the cathode charge transfer resistance differs for the Surface and Random configuration. This is a result of the reduced active surface area of the Surface configuration (cf. Figure 5b). Still, the Contact configuration shows the highest impedance of all cases. Interestingly, the reduced transport in the electrolyte also affects the semi-circles of the anode and cathode charge transfer resistance reducing the pronounced minimum between the two. The simulations indicate, that, although Contact has a higher active surface area compared to Surface, a higher initial potential drop in the lithiation simulations can be expected, which is indeed seen in Fig. 7d. A discussion on the influence of CBD distribution on the lithiation of NMC622 electrodes will be presented in the next section.
Galvanostatic lithiation simulations
In the last section we identified the Contact configuration as most probable CBD morphology in the electrodes investigated in this work. Furthermore, we confirmed that a relative conductivity of 1.78% in the CBD, which was deduced by a combination of transport simulations on the tomography data and impedance measurements on symmetrical cells, allows to reproduce the spectra with microstructure-resolved impedance simulations. In a next step we will analyze if the predicted transport properties of the NMC622 electrode are able to provide an improved description of the electrode performance during galvanostatic lithiation experiments at various currents. Figure 7 a) shows lithiation curves of the NMC622 electrodes measured in half-cell configuration. Even at moderate current of 6 mA cm−2, corresponding to a 2C rate, the capacity drops to less than half of its initial value. This is another indication for the rather poor lithium transport in the model electrodes. In contrast, the graph b) on the upper right hand side of Fig. 7 shows simulated lithiation curves under the same conditions using the tomography data without CBD. Even at 12 mA cm−2 the electrode shows almost no capacity loss. This underlines the importance of taking into account the CBD morphology in electrochemical simulations in order to provide realistic predictions of electrode and cell performance. Figure 7c shows the lithiation curves for the Contact configuration. The impact of the Contact distribution is quite remarkable. Compared to the simulation results without CBD, the areal capacity reduces significantly at high currents. In the Contact configuration we see a significant drop in electrode capacity at high current densities which was predicted by the conductivity simulations and impedance data. At 10 and 12 mA cm−2 we see an additional plateau appearing at around 3.4 V. This was not observed in the experimental data and indicates that the transport properties of the NMC622 active material are probably overestimated in our simulations. In our model we neglect the SOC dependence of the chemical diffusion coefficient and electrical conductivity, which are known to drop drastically close to full lithiation of NMC.1,2 However, this aspect is not in the focus of this work. Figure 7d compares the simulation results using the different CBD generators with the experimental data. As pointed out in Section "Structural characterization" the thickness of the electrode sample which was reconstructed using the synchrotron data is about 10% thinner than the average thickness measured directly on a number of electrode samples and SEM images. Therefore, a discrepancy in capacity between our simulations and the experimental data is expected. In order to provide comparable results we normalize areal capacities to the capacity at 1 mA cm−2. Additional results of simulations on virtual electrode realizations drawn from a stochastic microstructure model41 are provided as supplementary information. Lithiation curves for all generators and cut-outs can be found in Fig. SI-1. The currents were chosen to present results where the performance of the electrode in the Contact configuration is dominated by the transport of lithium in the electrolyte and active material, respectively. Additionally, we present results at 1 mA cm−2 and 3 mA cm−2 which is an intermediate current in the transition region. The Random and Surface CBD configurations predict an electrode capacity which is at 12 mA cm−2 still close to 80% of the nominal capacity. Compared to the simulations on the tomography data without CBD, the capacity loss at high currents is already much more pronounced for the Random and Surface configuration. Still, the deviation from the experimental data is substantial. This result is in qualitative agreement with the relative conductivity calculated in Section "Structural characterization" and symmetrical impedance simulations in Section "Impedance simulations" using the different CBD distributions. The Contact configuration in turn is able to reproduce the capacity loss of the experiments with increasing currents. We have to strengthen that all simulations were performed with the same set of parameters. The significant differences between the different configurations is only due to the different CBD morphology. At 12 mA cm−2 the simulations are able to reproduce the experimental data down to 3.4 V. Then we see in our simulations a shoulder in the voltage signal discussed above. Additional electrochemical characterization of the active material properties, especially the chemical diffusion coefficient of lithium, will be required for future studies to address this deviation from the experimental data. Still, the prominent transports effects in the electrolyte can be seen at currents up to 6 mA cm−2 where our simulations using the contact configuration are able to favorably reproduce the experimental data. Figures SI-1b and SI-1c show simulation results using the Random and Surface CBD distribution for all three cut-outs, respectively. It is interesting to notice that in both cases cut-out B which provides the highest capacity at low currents shows the worst performance at high currents. This is consistent with the generally highest half-cell impedance of this virtual sample shown in Fig. 6. In the structural data and the impedance of the symmetrical cell this significant standard deviation between the different samples was not apparent. Based on this result, we conclude, that for a complete electrochemical characterization the information from both symmetrical cells and half-cells have to be combined to provide a comprehensive picture of the electrode performance.
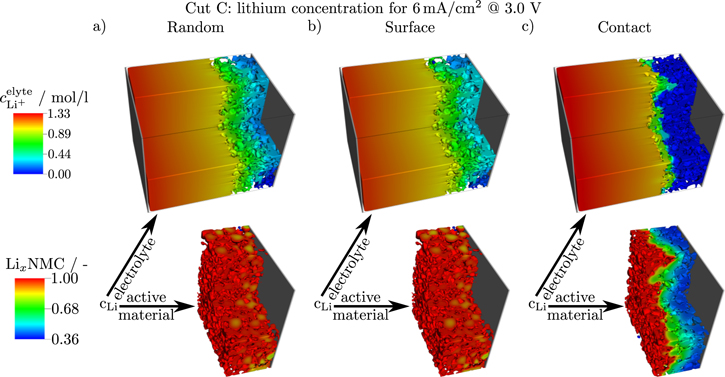
In order to demonstrate the significant effect of the different CBD morphologies on the transport of lithium in the electrode, we show concentration distributions of lithium in the electrolyte and active material in Fig. 8. For each configuration we provide a snapshot at 3.0 V and a lithiation current density of 6 mA cm−2. The Random and Surface configurations result in very similar distributions. This is not surprising, since all the electrochemical data of the two electrodes is also comparable. In the electrolyte we see a pronounced gradient of lithium ions with high concentrations up to 1.33 mol/l close to the lithium foil and lithium depletion in the cathode close to the current collector. Still, the average Li concentration is around 0.3 mol/l. Thus, we see an almost complete utilization of the active material across the whole cathode thickness. Only the interior of large particles is not fully lithiated. This is in stark contrast to the simulated distributions of the Contact configuration. The region with non-vanishing lithium concentration in the electrolyte shrinks to only few μm close to the separator/cathode interface. The distribution shows that transport is restricted to a small number of larger pores which are directly connected to the lithium reservoir in the separator. The rest of the electrode suffers from complete depletion of the lithium salt in the electrolyte. Consequently, the lithiation of active material is restricted to the electrode surface causing a drop in electrode capacity. However, in this region we see almost complete utilization of the active particles. This indicates fast diffusion kinetics causing the shoulder in the cell voltage. As discussed above, slower diffusion in the active material close to full lithiation is expected which will reduce this additional contribution in electrode capacity. The lithium distribution presented in Fig. 8 highlights the significant effect of the CBD morphology on electrode performance. Our studies show that a combination of experimental and simulation techniques is able to provide a comprehensive picture of the limiting processes in Li-Ion batteries which provides on the other hand advanced tools for electrode development.
Figure 8. The spatial distribution of the lithium concentration inside the (upper row) electrolyte and (lower row) active material for cut C at the end of lithiation with 6 mA cm−2 for the three different CBD generators.
Download figure:
Standard image High-resolution image
Conclusions
Our studies demonstrate that the distribution of passive materials is very important for the operation of the battery. The conductive additive and binder domain (CBD) provides a conductive network for the transport of electrons and ensures mechanical integrity of the electrodes. However, the CBD has also a negative effect on the transport in the electrolyte and, additionally, blocks active surfaces. Despite its importance, the CBD and its spatial distribution is often not specifically taken into account in simulation studies.
In this contribution we combine microstructure resolved electrochemical simulations with electrochemical measurements in order to provide a quantitative link between CBD morphology and distribution with electrode performance. Realizations of the electrode structures are prepared by synchrotron tomography in combination with different CBD generators. Additionally, the electrodes are characterized by impedance spectroscopy in a symmetrical setup which provides a measure for the tortuosity of the electrodes. In our measurements we found somehow unexpected high tortuosity values which are indicative for inferior electrochemical performance. In order to correlate these results with structural properties of the electrodes we present results of microstructure resolved impedance simulations. This tool provides a direct link between the electrode structure obtained by synchrotron tomography, CBD morphology, and electrochemical measurements. Our analysis indicates that only a very dense CBD which resides at the contact points of active material particles is able to reproduce the data of the impedance measurements. For other configurations we see quantitative deviations from the experimental data.
With the same electrode parameters we additionally performed galvanostatic lithiation simulations which allow reproducing the drop in capacity seen in the corresponding experiments. This provides evidence that indeed the CBD is responsible for the relatively poor performance of the electrodes. Moreover, this result enables a direct correlation of the structural features and transport properties of the CBD to the electrochemical performance of the electrode. The extension of the structural model by a CBD phase is able to improve the predictive power of the simulation approach and provides a sophisticated tool for the design and analysis of new electrode concepts.
Acknowledgments
The presented work was financially supported by the BMBF within the project HighEnergy under the grant numbers 03XP0073C/D/E. We thank C. Pfeiffer (ZSW) for the preparation of cross-sections and SEM measurements. The authors acknowledge support by the state of Baden-Württemberg through bwHPC and the German Research Foundation (DFG) through grant no INST 40/467-1 FUGG (JUSTUS cluster). This work contributes to the research performed at CELEST (Center for Electrochemical Energy Storage Ulm-Karlsruhe.