

Abstract
We carried out thorough cyclic voltammetric (CV) studies to evaluate the intermolecular interactions between the electrochemical label and the liquor compounds. In the cyclic voltammograms, both the anodic and cathodic peak potential of FcCH2OH were positively shifted, resulting from the formation of hydrogen bonding between FcCH2OH and C2H5OH. Only the anodic peak potential of FcCH2OH was positively shifted, resulting from the formation of ion-pair between the oxidized form (Fc+CH2OH) and the negatively charged carboxylate (RCOO−). Combining cyclic voltammetry and gas chromatography, the result shows an evident correlation between peak potential and the content of the negatively charged ions present in the liquor (e.g., 1 mM sodium acetate with the potential shift of +40 ± 5 mV; 1 mM sodium citrate with the potential shift of +38 ± 4 mV). Further, a fast approach (total scanning time: 56 s), which is complementary to the conventional chromatographic and mass spectrographic characterizations, has been developed for differentiating aging times (1, 2, 3, 4, 5 and 10 years) of typical Chinese liquors.
Export citation and abstract BibTeX RIS
Chinese liquor, an indigenous alcoholic beverage, plays a highly important role in social and practical life in China.1 The diverse aroma profiles of Chinese liquors result from their complexity in starting material, manufacturing technology and aging time, et al.2 During the production, the starting material (e.g. sorghum and rice) is firstly cooked and then mixed with Daqu powder,3 which is rich in microorganisms and serves as the fermentation starter. The fermentation process is typically performed at 28 °C–32 °C under anaerobic conditions.4 After fermentation, the liquor is obtained by distilling the fermented mixtures. Then, liquor is aged for desired time (usually more than 3 years) at 15 °C–25 °C.5 It should be noted that the aging process in liquor production is essential and crucial to its quality and aroma.6 The aroma of the liquor without aging process (newly obtained liquor, called Xinjiu) is pungent and acrid. It is generally accepted that the aging process improves liquor quality and taste for two reasons.7 Firstly, Xinjiu contains some pungent and volatile components, such as hydrogen sulfide, allyl alcohol and acraldehyde. These components can be spontaneously removed in the aging process thus transforming the taste from pungent to soft. Secondly, slow chemical reactions including esterification, aldol condensation take place in the aging process and thus producing various aroma substances. In recent years, amid wide publicity, Chinese consumer demand for aged liquor increases greatly.8 And even there is insufficient evidence to overturn the result, it is believed that the longer the liquor aging time, the better the quality.9 However, because the consumer demand is proportional to the aging time, the liquors labeled with dishonest aging times have appeared in the consumer market.10 The fraud in aging time of liquor has not only harmed the consumer rights but has also brought negative impact to the liquor market.11 Therefore, there is an urgent need to establish effective ways for identifying the authenticity of aged liquor.
Generally, the identification and quantification of liquor compounds are performed using analytical techniques such as gas chromatography and mass spectrometry.12,13 For example, the technique combined with high-performance liquid chromatography and principal component analysis (PCA) was employed to differentiate samples from various aging times.10 A technique combined with colorimetric sensor array, PCA, and linear discriminant analysis (LDA) was developed for the classification of liquor with different marked ages.14 These studies show that the combined techniques have a powerful potential in the classification of Chinese liquors from various aging times. However, these method used for differentiating liquor age is based on statistical analysis (e.g., PCA), usually large number of samples are needed, and the compound difference within the samples of various aging times is often not clear, which remains the aged liquor of a "mystery".
Recent years, the electrochemical methods, in particular cyclic voltammetry (CV) and differential pulse voltammetry (DPV) using either carbon or metal electrodes, have been developed to the analysis of liquor fermentation process.15–17 Herein, we selected an electrochemical label (ferrocenylmethanol, abbreviated as FcCH2OH) and designed an electrochemistry-based method for identifying the authenticity of aged liquor. In this design, the electrochemical label benefits the formation of hydrogen bonding18 or electrostatic attraction19 with the liquor compounds due to the evident distinction of electric charge between the reduced form (FcCH2OH) and the oxidized form (Fc+CH2OH). In the cyclic voltammograms, both the anodic and cathodic peak potential (or expressed as the formal redox potential) of FcCH2OH were positively shifted, resulting from the formation of hydrogen bonding between FcCH2OH and C2H5OH. While only the anodic peak potential of FcCH2OH was positively shifted, resulting from the formation of ion-pair between the oxidized form (Fc+CH2OH) and the negatively charged carboxylate (RCOO−). Based on these observations, the application was performed to identify the aging time of typical Chinese liquor and showed an evident correlation between peak potential and the aging time of the liquors. On the one hand, from an analytical viewpoint, the main advantage of the proposed method is the possibility of direct analysis of the liquid foods without the need for pretreatment or separation. On the other hand, the study reveals the certain compound differences within the aged liquors, which is meaningful for the food tech community to unveil the chemistry behind liquor.
Experimental
Chemicals
Ferrocenylmethanol, ethanol, acetic acid, propionic acid, n-butyric acid, n-hexylic acid, n-octanoic acid, glyoxal, ethyl acetate, and potassium chloride were purchased from Aladdin (Shanghai, China). All chemicals were used as received. All solutions were freshly prepared by ultrapure water, with a resistivity of 18.2 MΩ cm−1.
cm−1.
Methods
The polycrystalline gold electrode (1 mm in radius) was polished with 1.0, 0.3 and 0.05 μm alumina in particle size successively to achieve a mirror-like surface, rinsed with ethanol and ultrapure water. Then the polished electrode was electrochemically cleaned by cycling the potential from −0.2 to +1.6 V with a scan rate of 50 mV · s−1 in 0.1 M H2SO4. Cyclic voltammetry (CV) was carried out in a conventional three-electrode cell at room temperature near 298 K, with a commercial electrochemical workstation (CHI660C). All the electrodes were purchased from CH Instruments, Inc. (Shanghai, China). Before recording of CV, FcCH2OH and KCl were added to the liquor samples to achieve a final concentration of 0.5 mM and 0.1 M respectively. The oxygen was removed from the sample solutions by passing of N2 gas not less than 10 min before the recording of the cyclic voltammogram. Three samples are taken for each CV test (three parallel measurements). An Abbe refractometer (HT512ATC, Hengan Electronic Technology CO. LTD, Shandong, China) was used to determine the alcohol content of the liquors. The conformation of FcCH2OH and C2H5OH was optimized by calculations using density functional theory (DFT). Details about the DFT calculation can be found in our previous work.20
Liquor samples
The typical Chinese liquor samples were collected from the manufacturer Xiangjiao Group Ltd, Shaoyang, China. Six samples with different biological aging times (1, 2, 3, 4, 5, 10 years) were collected. All liquor samples used in this study were directly collected from storage containers without any additive. The constituent analysis of liquor samples above mentioned was primarily performed by gas chromatography (Agilent Technologies Co. Ltd), as shown in Table SI in supporting information (available online at stacks.iop.org/JES/167/027517/mmedia). GC chromatograms of the liquor samples with different aging times are shown in supporting information (Figs. S1-S6).
Results and Discussion
Classification of the liquor samples by the electronic tongue
Classification of the aging time of the liquor samples is first performed by the electronic tongue system, which is the traditional technology for food analysis. The scheme of the electronic tongue is shown in Fig. 1a. As seen, the sensor array of the electronic tongue is composed of a working electrode (six inert electrodes: platinum, gold, tungsten, titanium, nickel and silver electrode), an Ag/AgCl electrode reference electrode, and a platinum counter electrode for standard three-electrode systems. The electronic tongue system is based on the multi-frequency pulse voltammetric scanning method (shown in Fig. 1b) and uses the multiple working electrodes to optimize the combination of sensor arrays. The data analysis methods of the system include principal component analysis (PCA), discriminant function analysis (DFA), linear discriminant analysis (LDA) and partial least squares regression analysis (PLS).

Figure 1. (a) The scheme of the electronic tongue. (b) The applied potential plotted vs scanning time of the multi-frequency pulse voltammetric method. (c) PCA score plots of PC1 and PC2 of liquors from six aging times. (d) LDA score plots of LD1 and LD2 of liquors from six aging times.
Download figure:
Standard image High-resolution imageAs shown in Fig. 1c, the score plot of PC1 and PC2 derived from PCA analysis did not bring interest in the sample separation (other combinations of PCs were also examined and showed similar results). The LDA method was further performed, shown in Fig. 1d, and a general separation between samples with different aging times was observed. As can be seen, the electronic tongue system was effective to differentiate samples from six aging times, however, the compound difference within the samples is not clear. Electrochemistry-based methods emerge as an alternative strategy for a quick and economic analysis of food constituent when we consider some of the characteristics of conventional methods, like large number of samples, use of expensive reagents unfriendly to the environment and expensive equipment.21–23 Therefore, an electrochemistry-based method was designed to reveal the certain compound differences within the samples of various aging time, shown in the following experiments.
CV of liquors from six aging times with FcCH2OH/Fc+CH2OH redox species
The typical Chinese liquors were characterized using the electrochemical label (FcCH2OH) with clean and simple design: A gold disk electrode (1 mm in radius) was used as the working electrode, a platinum wire as the counter electrode and an Ag/AgCl (sat. KCl) electrode as the reference electrode for standard triple electrode system. CV of liquors in the absence of FcCH2OH, and CV of liquors (from six aging times, 1, 2, 3, 4, 5 and 10 year) containing 0.5 mM FcCH2OH and 0.1 M KCl are shown in Fig. 2a. As seen, a pair of well-shaped redox peaks are observed for both the CVs in the aqueous solution which contains 0.5 mM FcCH2OH. However, in the absence of FcCH2OH, no redox peaks are presented in the same potential window of the CV (dotted line in Fig. 2a). Therefore, it illustrates that the well-shaped redox peaks observed in the CV are attributed to the redox process of the electrochemical label, FcCH2OH. Moreover, the evident changes for the CVs are found, as shown in Fig. 2b, the anodic peak potential (Epa) is decreasing along with the increase of the aging time while the cathodic peak potential (Epc) keeps a constant. Generally, the peak potential of FcCH2OH, which is a stable redox species, will not change in a certain solution environment. However, the obvious potential shifts indicate that the redox process of the electrochemical label FcCH2OH,19 is closely related to the intermolecular interactions between FcCH2OH and the diverse compounds in the liquors. The shifts in redox potential, of course, is not particularly novel or surprising observation. Certainly, the effect of the intermolecular interactions (e.g., hydrogen bonding) on redox potentials has been recognized, particularly in the case of DNA24 and proteins.25 In other words, the liquors from various aging times provide a diverse solution environment for FcCH2OH, thus the redox potential of FcCH2OH may become an indicator of the aging time of the liquors. In order to check the memory effect26 of this system, the first, second and tenth cycle of the CV curves are shown in Fig. S7. As seen, the CV curves for the first, second and tenth cycle are almost the same (except the curve of first cycle is slightly different due to the double-layer charging current). Thus, it can be suggested that the potential shifts for the liquor samples are due to the intermolecular interactions between FcCH2OH and the diverse compounds in the liquors rather than memory effect of this system. Thus, the CV curves were collected with three cycles every time, and the CV curve of second cycle was used for the subsequent measurements.

Figure 2. (a) CV of liquors in the absence of FcCH2OH (in black, dotted line). CV of liquors (from six aging times, 1, 2, 3, 4, 5 and 10 years) containing 0.5 mM FcCH2OH and 0.1 M KCl, scan rate: 50 mV s−1. (b) Epa (in black) and Epc (in red) plotted vs the aging time. The peak potentials are the mean value of three parallel measurements, and the error bars represent the standard deviation from the mean (n=3). The dashed lines (in red or black) are only to guide the eyes.
Download figure:
Standard image High-resolution imageModulated interactions between the redox species and liquor compounds
As the major constituent in liquors is alcohol (C2H5OH), the influence of alcohol content on the redox potential of FcCH2OH was firstly investigated. Six artificial model liquors are obtained by mixing water and alcohol, the content of alcohol is 0%, 12%, 24%, 48%, 64%, and 72% respectively. CV of model liquors containing 0.5 mM FcCH2OH and 0.1 M KCl are shown in Fig. 3a. As seen, all the CVs show one couple of quasi-reversible redox peaks, however, along with the increase of alcohol content, the redox peaks are shifting to the considerably positive potential. The extent of potential shift, described by Diane K. Smith et al.,27 who observed a selective recognition of urea and amide derivatives, has been evaluated by electrochemical means: It is realized that the extent of potential shift is related with the strength of the intermolecular interactions. As shown in Fig. 3b, the Epa and Epc were plotted vs volume ratio of C2H5OH, the obvious increase in Epa and Epc were observed. Moreover, the extent of potential shift for Epa and Epc was nearly uniform, which suggests that the strength of the intermolecular interactions between C2H5OH and the reduced form (FcCH2OH) is nearly equal to that between C2H5OH and the oxidized form (Fc+CH2OH). The matrix effect in case of using the electrochemical label was further examined with freshly prepared liquor samples. As shown in Fig. S8, along with the increase of alcohol content, Epa and Epc are shifting to the positive potential. This phenomenon is similar to that observed for the artificial model liquors, suggesting that the CV peak potentials are correlated to the alcohol content in the liquors. In consideration of the intermolecular interactions, we further optimized the conformation of FcCH2OH and C2H5OH by computational methods20 (Calculations using density functional theory). As seen in Fig. 3c, an H-bonding interaction between the O atom of C2H5OH and the H atom of FcCH2OH was observed, which was similar to the previous reports.20 Julian Vrbancich et al. have demonstrated that the positive charge of the oxidized form (Fc+CH2OH) locates at the iron atom of the ferrocene ring,28 thus it can be suggested that the net positive charge on iron atom will not affect the H-bonding between the H atom of Fc+CH2OH and the O atom of C2H5OH, due to the large distance between the H-bond and the positively charged iron. Therefore, it is reasonable to suggest that the H-bonding interaction between C2H5OH and the reduced form (FcCH2OH) is nearly equal to that between C2H5OH and the oxidized form (Fc+CH2OH). The redox process of FcCH2OH in the model liquor is summarized in Fig. 3d: The presence of hydrogen bonding leads to the formation of the complex (FcCH2OH·C2H5OH or Fc+CH2OH·C2H5OH ), a more stable redox state than FcCH2OH/Fc+CH2OH, resulting in large positive shifts in the redox potential.29,30 The formal potential, E1/2 = 1/2(Epa+Epc), which is a good indicator of the energy barrier of redox reaction,31 are plotted vs volume ratio of C2H5OH. As shown in the inset of Fig. 3b, a positive correlation between E1/2 and volume ratio of C2H5OH is observed, which is consistent with the proposed redox process shown in Fig. 3d.

Figure 3. (a) CV of model liquors (C2H5OH/water solution in different concentration: 0%, 12%, 24%, 48%, 64% and 72%) containing 0.5 mM FcCH2OH and 0.1 M KCl, scan rate: 50 mV s−1. (b) Epa (in black) and Epc (in red) plotted vs volume ratio of C2H5OH. Insert: The formal potential (E1/2) plotted vs volume ratio of C2H5OH. (c) The optimized conformation of the complex of C2H5OH and FcCH2OH via the H-bonding interaction. Hydrogen bonds are drawn by red dotted lines. Carbon, hydrogen, oxygen and iron atoms are marked in gray, white, red and yellow, respectively. (d) Schematic representation of the redox process of FcCH2OH in the model liquor.
Download figure:
Standard image High-resolution imageNow we are aware that alcohol content difference in the liquors affects both Epa and Epc of the CV with FcCH2OH redox species. In addition, we have measured the alcohol content of the liquors from different aging times by an Abbe refractometer and the result shows that the alcohol content of the liquors is within the range from 63.0% to 64.5%, in volume ratio. No obvious alcohol content difference is observed for the liquors. Thus we confirm that the negative shift in Epa, along with the increase of the aging times of the liquors (as shown in Fig. 2b), is not due to the effect caused by alcohol content difference.
As we previously reported, the redox species FcCH2OH/Fc+CH2OH benefits the formation of hydrogen bonding18,32,33 or electrostatic attraction34 because of the evident distinction of electric charge between the reduced form (FcCH2OH) and the oxidized form (Fc+CH2OH). We next investigated the influence of the common liquor compounds on the redox potential of FcCH2OH. The model liquor is obtained by mixing water and alcohol, and the final alcohol content is 64% in order to keep the same alcohol content with the real liquor samples. CV of model liquors containing 0.5 mM FcCH2OH and different liquor compounds are shown in Fig. 4a. As seen, addition of 50 mM (100 equiv) n-butyric acid, 50 mM propionic acid and 50 mM acetic acid in model liquors leads to the positive potential shift of Epa in 10 ± 3 mV, 38 ± 4 mV and 43 ± 6 mV respectively, while Epc almost remains a constant. To understand this phenomenon, we have compared the potential shifts caused by addition of other liquor compounds, the effect of these compounds on the redox potential of FcCH2OH is outlined in Table I. As seen, addition of 50 mM of the carboxylic acids, including C2, C3, C4, C5, and C6, leads to the potential shift of Epa, and the shift extent is positively related to the ionization degree of these acids. The results suggest that the intermolecular interactions between the carboxylic acid and FcCH2OH have a significant impact on the redox potential of FcCH2OH. Further, we compared the potential shifts by addition of carboxylate and carboxylic acid. As seen, addition of 2 equiv of acetic acid do not cause potential shift while addition of 2 equiv of sodium acetate leads to obvious potential shift (+40 ± 5 mV). This allows us to understand the mechanisms that lead to potential shift of Epa, as represented in Fig. 4b: The negatively charged carboxylate in the liquors, selectively interacts with the positively charged Fc+CH2OH (formation ion-pairs), resulting in large positive shifts of Epa. It should be noted that, as the negatively charged carboxylate does not interact with the uncharged FcCH2OH, addition of carboxylate does not cause the shift of Epc. As a control group, CV of model liquors containing 0.5 mM FcCH2OH and uncharged compounds (glyoxal and ethyl acetate) were also performed. As shown in Table I, addition of uncharged compounds does not cause obvious shift in Epc or Epc which verified the proposed ion-pair mechanism. As some other negatively charged ions may be present in liquor as additives, the interactions between the electrochemical label and these additives were taken into account. Sodium citrate and sodium malate are commonly known as sour salts and are mainly used as food additives, usually for flavors or as preservatives.35 As seen, the potential shifts for sodium citrate (2 equiv) and sodium malate (2 equiv) are +38 ± 4 mV, +42 ± 5 mV respectively (shown in Table I). The shifts are nearly equal to that for sodium acetate. Besides, addition of the mixture of sodium acetate (1 equiv) and sodium citrate (1 equiv) leads to obvious potential shift (+40 ± 4 mV). The results suggest that the potential shift of the electrochemical label is correlated with the total content of the negatively charged ions present in the liquor.
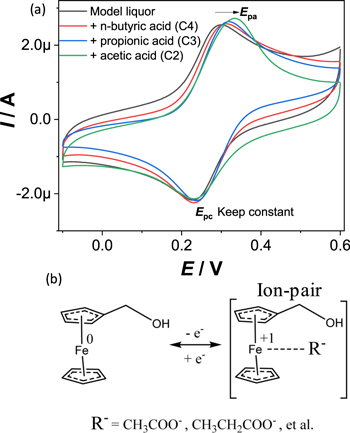
Figure 4. (a) CV of model liquor containing 0.5 mM FcCH2OH and 0.1 M KCl (in black). 50 mM n-butyric acid was added (in red), 50 mM propionic acid was added (in blue), 50 mM acetic acid was added (in green) respectively. Scan rate: 50 mV s−1. (b) Schematic representation of the redox process of FcCH2OH in the model liquor: ion-pair formation.
Download figure:
Standard image High-resolution imageTable I. Shifts in potentials of FcCH2OH/model liquor in the presence of various substrates.
| Substrate | ΔEpa mV−1 | ΔEpc mV−1 |
|---|---|---|
| acetic acid (C2) (50 mM) | +43 ± 6 | +1 |
| propionic acid (C3) (50 mM) | +38 ± 4 | +1 |
| n-butyric acid (C4) (50 mM) | +10 ± 3 | +2 |
| n-hexylic acid (C5) (50 mM) | +5 ± 1 | −1 |
| n-octanoic acid (C6) (50 mM) | +5 ± 1 | +2 |
| acetic acid (1 mM) | +1 | +1 |
| sodium acetate (1 mM) | +40 ± 5 | +1 |
| glyoxal (50 mM) | 0 | +1 |
| ethyl acetate (50 mM) | +1 | +1 |
| sodium citrate (1 mM) | +38 ± 4 | +1 |
| sodium malate (1 mM) | +42 ± 5 | −1 |
| sodium acetate (0.5 mM) + sodium citrate (0.5 mM) | 40 ± 4 | −1 |
Correlation between redox potentials and the carboxylic acid contents in the liquors
Liquor is an alcoholic beverage consisting of hundreds of components that can have an impact on its quality and flavor. As far as the chemistry of liquor is concerned, there is a close link between liquor aging time and liquor flavor,36 it is important to understand how liquor aging time affect liquor chemistry. The constituent analysis of liquor samples with different aging times (1, 2, 3, 4, 5, 10 years) was performed by gas chromatography, as shown in Table SI in supporting information. As seen, the main constituents of the liquor samples are similar: saturated ethanols, short chain carboxylic acids and esters. The chromatography characterization enables us to confirm the main constituents in the liquors; however, it is not likely to provide further details in regard to the discrimination of aged liquor.
As mentioned above, the negatively charged carboxylate in the liquors, selectively interacts with the positively charged Fc+CH2OH (formation ion-pairs), resulting in large potential shifts of Epa. Thus, we further investigated the correlation between redox potentials and the carboxylic acid contents in the liquors. The total content of C2, C3, and C4 was plotted vs the Epa in the CV of liquors from different aging times, as shown in Fig. 5 (in black dotted line). As seen, a positive correlation between Epa and the total carboxylic acid contents (C2 + C3 + C4) is observed. Other combinations of the carboxylic acid contents were also examined, but they did not bring additional interest in the correlation between Epa and the total carboxylic acid contents. For instance, the total content of C2, C3, C4, C5, and C6 was plotted vs Epa, as shown in Fig. 5 (in red dotted line), the total content towards a random variation.

Figure 5. The total content of n-butyric acid (C4), propionic acid (C3) and acetic acid (C2) plotted vs the Epa in the CV of liquors from different aging times (in black). The total content of n-octanoic acid (C6), n-hexylic acid (C5), C4, C3, and C2 plotted vs the Epa in the CV of liquors from different aging times (in red). The constituent analysis of liquor samples was performed by gas chromatography, as shown in Table SI in supporting information.
Download figure:
Standard image High-resolution image
However, the result is reasonable as the short chain compounds tend to become long chain compounds in the liquor fermentation process: As shown in Table SI, the content of short chain carboxylic acids (e.g., acetic acid) in 1 year samples (135.7 mg/100 ml) is significantly higher than that in 10 year samples (50.2 mg/100 ml). On the contrary, the content of the relatively long chain carboxylic acids (e.g., n-hexylic acid) in 1 year samples (58.5 mg/100 ml) is significantly lower than that in 10 year samples (120.6 mg/100 ml). In other words, the result illuminates the certain compound differences within the samples from various aging time and unveils the electrochemistry behind the aged liquor: the potential shift in Epa, that observed in the cyclic voltammograms (shown in Fig. 2b), can be attributed to the decrease in the total content of the relatively short chain carboxylic acids (e.g., C2 + C3 + C4) in the liquor fermentation process. And, clearly, an alternative approach for differentiating the aging time of typical Chinese liquor with the electrochemical label, FcCH2OH, has been developed in this study.
Conclusions
By determining the potential shift of the electrochemical label, FcCH2OH, before and after addition of various liquor compounds, the intermolecular interactions between FcCH2OH and the liquor compounds are clearly revealed. In the cyclic voltammograms of the liquors, both the anodic and cathodic peak potential of FcCH2OH were positively shifted, resulting from the formation of hydrogen bonding between FcCH2OH and C2H5OH. While only the anodic peak potential of FcCH2OH was positively shifted, resulting from the formation of ion-pair between the oxidized form (Fc+CH2OH) and the negatively charged carboxylate (RCOO−). An evident correlation between redox potentials and the carboxylic acid contents in the liquors is demonstrated. These results are consistent with and complementary to the conventional chromatographic and mass spectrographic characterizations. It was confirmed that by adapting an electrochemical label the liquors from various aging time can be successfully identified. Moreover, the study reveals the certain compound differences within the liquors and is beneficial for the food tech community to unveil the chemistry behind liquor.
Acknowledgments
We gratefully acknowledge the financial support from Shaoyang University.