
Abstract
Transport through vanadium redox-flow-battery membranes strongly influences cell performance. In this work, we use a multicomponent concentrated-solution model of transport and thermodynamics in phase-separated cation-exchange membranes, the most common separator type, to develop structure-performance relationships. The model incorporates species partitioning into the membrane, thermodynamic nonidealities, and Stefan-Maxwell-Onsager frictions between species. Molecular-thermodynamics and -transport theories parameterize the model. We validate the calculations against measured Coulombic and voltage efficiencies of a vanadium flow battery as a function of current density. Our model shows that species transport is the result of collective interactions between all species present in the system. The magnitude of coupling suggests that predictions made using dilute-solution theory for transport in these systems will be misleading in many situations. As a demonstration of the capabilities of the model, we predict cell performance, incorporating these interactions, as a function of electrolyte concentration and composition and membrane equivalent weight and backbone modulus. We find that electrolytes with high sulfuric acid concentrations provide the greatest cell performance (quantified by maximizing power density at a target energy efficiency). In the case of membrane properties, low equivalent-weight polymers perform better; at high equivalent weights, a low membrane modulus is preferred.
Membrane separator properties critically impact the performance of vanadium redox-flow batteries (VRFB).1–9 These separators, which are typically polymer membranes, facilitate ionic current between the positive and negative electrodes while limiting shorting and self-discharge due to crossover of vanadium active species.3,5 To optimize VRFB performance, there is an optimal design window between conductivity and crossover, which are at odds, as they necessitate different membrane morphologies and intrinsic properties.1,3,5 Thus, determining structure-performance relationships for membranes is key to successful deployment of VRFBs. As a result, the electrochemistry community has researched these transport properties using measurements and models for a variety of separator materials and operating conditions, as numerous reviews and articles outline.1–15
Despite these efforts, transport in VRFB separators is still a poorly understood process due to the numerous species and modalities involved, as displayed in Fig. 1.12,13,15–19 Such transport involves both vanadium partitioning into the separator from the external electrolyte solution,10,17,20,21 followed by ion and solvent transport across the separator driven by concentration gradients (i.e. diffusion) and the electric field (i.e. migration).1,10,13,16,19,22–26 The impact of different driving forces on species flux is particularly complicated due to the high concentration of multiple ionic species present.16,27 High concentrations create strongly nonideal thermodynamics (e.g. large excess chemical potentials) and frictional interactions between species couple transport (e.g. concentration gradients of species cause transport of species ).16,23,27–29 As a result of these complex conditions, transport and partitioning coefficients are functions of both the composition of electrolyte in the electrodes and membrane chemistry.6,9,17,20,21,29,30


Figure 1. Schematic of a redox flow battery (top) and pictorial representation various multicomponent thermodynamic and transport phenomena taking place in VRFB membranes (bottom). The membrane, phase , seperates the negative electrode, phase , from the positive electrode, phase .


Download figure:
Standard image High-resolution imageMathematical models for transport in membranes deconvolute these various effects.1,4,10,12,19,25–27,29,31 Previously developed models have been invaluable for understanding cell performance across multiple cycles and how electrolyte transports through the cell.1,4,10,12,19,25–27,29,31 However, many of these efforts are restricted to dilute-solution approximations that do not consider coupled transport and/or account for concentration-dependent transport properties. The validity of these assumptions under flow-battery operating conditions is not known. Unfortunately, approaches that use concentrated-solution theory27,29,31 are often intractable because they require numerous transport parameters, of which the few that are measured have large associated experimental error.31 To overcome these challenges, Part I and II of this series developed and validated molecular models for coupled, multi-ion thermodynamic and transport properties in phase-separated cation-exchange membranes.32,33 This approach completely specifies the concentrated-solution transport properties as a function of concentration and membrane chemistry. Using these models, this paper explores the role of transport coupling and links molecular-scale behavior to macroscale performance of VRFB membranes, providing design criteria and guidelines for both cell developers and membrane chemists.
The outline of this paper is as follows. In the theory section, we summarize the relevant thermodynamic and transport equations. We then examine the extent and nature of transport coupling and the impact on membrane properties. A 1-D, quasi-steady-state model of a VRFB membrane uses the transport parameters to show how vanadium crossover is detrimental. Finally, we examine how the electrolyte composition and the structure and chemistry of the membrane impact the cell performance.
Theory
In focusing our study on the transport driving forces in VRFB membranes (see Fig. 1 bottom), we consider the cell at quasi-steady-state in which the cell state of charge and the composition of the electrode electrolytes does not change significantly during a cycle. This work compliments previous VRFB modeling efforts that have focused on overall cell operation (see Fig. 1 top).10,12,13,25,26,34–40 This section first summarizes the VRFB system, including relevant electrochemical and chemical reactions. We then show how ohmic overpotentials and crossover of active species impact cell operation. The final sections formulate the transport and thermodynamic equations governing species flux and chemical potential drop across the membrane.
Vanadium Flow-Battery System
This study examines an all-vanadium redox-flow battery, pictured in Fig. 1. The system consists of electrolyte-filled porous electrodes that contain aqueous vanadium sulfate salts with sulfuric-acid supporting electrolyte (water, H2O, protons, H+, and sulfate, SO42−, are abbreviated 0, H, and SO4, respectively). The system is at a temperature of 295 K. The negative electrode, , contains and (denoted V(II) and V(III), respectively, based on vanadium oxidation state) and the positive electrode, , contains and (denoted V(IV) and V(V) respectively). Vanadium in any oxidation state is denoted . As the cell discharges, the reactions are at the negative electrode and at the positive electrode. Sulfate species associate with vanadium ions and with protons to form various ion-paired products.41 Table I details the electrochemical reactions and their half-cell potentials, the chemical reactions that occur when vanadium crosses over the membrane separating the electrodes (phase ), and the ion association equilibrium reactions.


Cell Performance
Cell performance is typically characterized by the power density on discharge, , and the round-trip energy efficiency, .42 is the product of the discharge current density and the cell potential on discharge 43


The energy efficiency is the ratio of the integrated cell power density on discharge to charge and is typically treated as the product of the voltage efficiency, , and the Coulombic efficiency, ,6


where is time, the subscript or denotes charge or discharge, and the cell voltage is approximated as constant during charge or discharge. characterizes efficiency losses due to cell overpotentials (e.g. kinetic and ohmic) and decreases with increasing current density.3 quantifies efficiency losses due to vanadium passing through the membrane between electrode solutions, mixing, and reacting chemically rather than electrochemically. tends to increase with rising current density because the total charge extracted from the cell generally grows compared to the amount of charge lost to chemical reactions.3 A typical operating goal is maximizing power density at a target energy efficiency.42 The next two sections present the governing equations for cell potential that are required to calculate power density and voltage efficiency, and the state-of-charge loss during cycling that dictates Coulombic efficiency.


Cell Potential
The cell potential is the difference in the electrochemical potential of the electrons in the metal at the negative electrode and the positive electrode ; these are related to the electrochemical potential of species , , participating in the oxidation/reduction reactions in electrode as outlined in Table I43


where is Faraday's constant and is ionic potential drop between the metal and the electrolyte in electrode due to mass-transport resistances, surface overpotentials, or other non-membrane cell resistances.


To put Eq. 1 in terms of the electrochemical potentials of species in the membrane, chemical equilibrium requires that the electrochemical potential of charged species (and the chemical potential of neutral species) must be equal at the interface of electrode phase and membrane phase 44


where is a function of chemical variables—temperature, pressure, composition—and, for charged species, the ionic potential.

It is convenient to group electrostatic dependences into a single variable with the remaining variables depending only on composition, temperature, and pressure. We reference the electrochemical potential of species to the electrochemical potential of the membrane to define


which is an electroneutral pairing of species and is independent of electrostatic potential.43,45 To track the electrical state through the membrane, we set the ionic potential equal to the electrochemical potential of the membrane, . This assignment is equivalent to measuring the ionic potential using a hypothetical reference electrode selective to the ionic groups on the membrane at the same conditions.43 Using Eq. 4 and , the cell potential is then


where groups non-membrane overpotentials in the cell. is the equilibrium cell potential


where and are the membrane phase at the negative and positive electrode interfaces, respectively. is the potential drop across the membrane due to ohmic and diffusion overpotentials. During discharge (charge), and become more negative (positive) with increasing current density, causing the cell voltage efficiency to decrease.3 We set to the measured open-circuit potential (=1.42 V)3 by neglecting the diffusion potential, which tends to be small.43 η is modeled as an ohmic potential drop with resistance


where is negative for discharge and positive for charge.

State-of-charge loss
Vanadium crossover causes the cell to self-discharge. The cell state of charge, , characterizes the extent the cell is in the charged state; it is the ratio of the sum of the moles of vanadium in the charged state (namely, in the negative electrode and in the positive electrode) to the total moles of vanadium in the system


where is the moles of in electrode


The rate at which the state of charge changes during discharging or charging is a function of the cell current density and the crossover current density 1–3


where is the active area of the membrane and is the total moles of vanadium in the system (i.e. ). characterizes how vanadium crossover decreases the state of charge of the cell and is a function of the flux of vanadium species through the membrane, , according to1–3


The membrane/negative electrode interface is set at and the membrane/positive electrode interface is at so that is positive for species that move towards the positive electrode (e.g. and ) and negative for species that move toward the negative electrode (e.g. and ). With this convention for the direction of flux, the ionic current density through the membrane is positive on discharge and is also the electronic current leaving the positive electrode normalized by (i.e. positive on discharge).1 A subsequent section shows that is constant across the membrane.


The first term on the right side of Eq. 10 is the consumption/production of species due to electrochemical charge/discharge, the second term is due to the loss of and from crossover to the opposing electrode and from reactions with vanadium species that transport from the opposing electrode (Table I specifies the stoichiometry incorporated in Eq. 11). Based on the low concentration of absorbed vanadium in the membrane, the chemical reactions in Table I occur in the electrode solutions and not in the membrane. The supporting electrolyte provides an excess of protons, and the high concentration of vanadium in the electrode solution rapidly reacts with any vanadium that crosses the membrane into the electrode.22 The factor of 1/2 on the left side of Eq. 10 results from considering the combined state of charge of the positive and negative electrodes. is a function of current density and cell state of charge (see Eq. 11).13,36


As a result of vanadium crossover, the amount of charge extracted from the cell during discharge, , is less than the amount put into the cell to recharge it to its original state of charge during charging, .1 Integrating Eq. 10 over a discharge/charge cycle with no net change in for a constant discharge and constant charge current density and crossover current, , and solving for gives1


where is negative and , , are positive. Because is a function cell state of charge, the condition for Eq. 12 of constant is achieved by a small change to over charge/discharge.


Membrane Phenomena
The following two sections discuss how the electrolyte partitions into and how it transports across the membrane. These expressions provide for calculation of , , and Although the following expressions are general for any flow-battery membrane, the specific microscale theories we use to calculate thermodynamic and transport coefficient are specific to phase-separated polymer cation-exchange membrane that Parts I and II present.32,33 The most common class of these materials are perfluorinated sulfonic-acid (PFSA) ionomers, such as Nafion.46 These materials consist of nanoscale, interconnected hydrophilic domains filled with aqueous electrolyte solution and side-chains terminated with anionic moieties that are tethered to the PFSA polymer.46 Surrounding these domains are hydrophobic polytetrafluoroethylene backbone that provides structural support.46


Membrane thermodynamics
Requisite for species to transport across the membrane, they must sorb from the electrode electrolyte into the membrane as Eq. 4 specifies. Chemical thermodynamics quantifies how these potentials are related to measurable quantities. The chemical potential of a neutral species is44

where is the universal gas constant, is temperature, and is the mole fraction of ( where is the moles of species ). The mole fraction of charged polymer groups in the membrane is and the charge for most cation-exchange membranes is . The reference chemical potential of , , is for a hypothetical ideal solution at unit mole fraction and is a function of temperature and pressure.44 The second term on the right side of Eq. 13 is the ideal solution contribution.44 In this paper, the ideal-solution contribution is specified a for fully-dissociated electrolyte (i.e. the Experimental Construct discussed in Part I).32 The excess chemical potential accounts for ion/ion, ion/membrane, solvent/membrane, and solvent/ion interactions including ion-pair formation (see Table I), electrostatic interactions, ion solvation, steric confinement, and membrane swelling. Part I details calculation of the excess chemical potential 32


For a charged species, the electrochemical potential has the same form as Eq. 13 but further depends on the electrical state of the phase and charge number 43 However, expressing the electrochemical chemical potential using only neutral pairings of two charged of species (i.e. ) eliminates the dependence on electrical potential.43 Substitution of these neutral pairings of Eq. 13 into Eq. 4 relates species mole fraction in the membrane and electrode electrolyte47


For neutral species (e.g. water) and, therefore, the th species does not need to be specified in Eq. 14. Electroneutrality inside the membrane adds a constraint that fully specifies ion partitioning,44


If oppositely charged ions are used for and (such as the anion and cation of a salt) and is unity, the oppositely charged pairs and partition into the membrane according to ideal Donnan equilibrium.47 If , and favorably partition into the membrane whereas if partitioning is unfavorable, 47 For context, Part I shows that for a Nafion cation-exchange membrane in an aqueous hydrobromic-acid solution at concentration of 5 mol kg−1-solvent, the term on the right side of Eq. 14 is ∼0.75 for HBr and 0.95 for water.32


Membrane Transport
Upon sorption into the membrane, species transport according to their molar flux across the membrane (-direction in the 1-D model). The molar flux obeys species conservation at steady-state48


Although the concentration of species in the electrodes changes during cell operation, transport in the membrane is assumed to be at steady-state because the concentration and pressure gradients in the membrane develop much faster (i.e. pseudo steady-state approximation).48Absent temperature and hydraulic-pressure gradients, which are typically small, transport is driven by electrochemical potential gradients. Friction between species introduces drag that reduces total flux. Stefan-Maxwell-Onsager theory describes the balance between driving force and drag on not equal to as43,49,50


and for the membrane as

where is the molar concentration of species and is the total molar concentration in the membrane. (For convenience in this section, we do not superscript variables for quantities in the membrane phase ). As discussed in the preceding section, is a function of temperature, pressure, composition, and ionic potential . is the binary diffusion coefficient between species and . is related to the friction coefficient between species and the membrane, , that is described in Part II, according to 33 The membrane is stationary (i.e. is the reference velocity) and the membrane concentration is set as the molar concentration of charged groups on the polymer. Onsager reciprocal relations dictate that the diffusion coefficients are symmetric so that . Consequently, for a VRFB with eight species (water, sulfate ions, protons, the membrane, and four vanadium species), there are 28 transport coefficients. In this paper, Eqs. 17 and 18 consider ionic species as fully dissociated (i.e. uses the Experimental Construct discussed in Part II).33 Transport coefficients include the effect of ion-pair formation to ensure that this model is consistent with the various ion-paired species that exist. Part II outlines calculation of and as a function of membrane water content and ion concentration.33


Equations 17 and 18 are rigorous but inconvenient because they involve gradients in electrochemical potential that are not readily characterized and frame the driving force in terms of species fluxes, whereas experiments measure fluxes under applied forces. Appendix A shows that for constant total molar concentration, eliminating the electrostatic dependence of the driving forces (i.e. making the substituting as shown in Eq. 5),45 and expanding chemical potential gradients in terms of composition variables gives the flux of species as the sum of migration and diffusion terms:


for where is a reference species with charge number different from is the transference number of species and are multicomponent diffusion coefficient between species and based on concentration driving forces. We assign protons as reference species Although and are zero for water, the ratio is definite and equal to the electroosmotic coefficient is the concentration gradient of a (potentially hypothetical) salt consisting of ions and charged polymer groups


where is the number of particles constituting ( for ). For neutral species (e.g. water), so that the concentration gradient of is simply the concentration gradient of (i.e. ). This formalism generalizes the treatment of concentration gradients in binary electrolytes43 to an arbitrary number of species; the concentration gradient of reduces to the concentration gradient of the salt for a binary electrolyte with cations and anions.


Appendix A shows how is related to the binary diffusion coefficients 's and chemical potential gradients. Specifically, 's are components of the by diffusion matrix that is the product of the matrix inverse of an by matrix containing transport coefficients, and an by matrix containing multicomponent thermodynamic factors


where is a diagonal matrix with entries and the entries of for are


and for


is a matrix of thermodynamic diffusion coefficients. The entries of are


where is the Kronecker delta function ( and for ). Equation 21 reduces to a well-established form for the salt diffusion coefficients in the case of a binary electrolyte.43


The vector of charge number-normalized transference numbers is


where is an vector with entries


In this approach, and use a reference velocity of the membrane (i.e. ), unlike other research that uses water velocity as the frame of reference, see Ref. 1. Due to this choice of the laboratory frame of reference, Eq. 19 should not include additional terms for solvent convection. The choice for species does not change the flux but does change the value of Since Eq. 19 is applicable to we specify the flux of using the current density and fluxes of species (i.e. ).


For negligible mass-transport resistance between the electrode electrolyte and membrane, chemical equilibria (i.e. Eqs. 14 and 15) specifies at the interface of the membrane with the two electrodes. Solving Eqs. 16 and 19 using these concentrations as boundary conditions gives the concentration profiles and fluxes of species across the membrane for a set current density.

With specified fluxes, Eq. 18 calculates the ionic potential gradient because it is proportional to the electrochemical potential of the membrane,

Integration of Eq. 27 across the membrane shows that is a function of applied current density (ohmic overpotential) and flux of species at the open-circuit cell potential (diffusion overpotential). In the absence of concentration gradients, substitution of Eq. 19 into Eq. 27 identifies the membrane conductivity, as


As increases for a fixed current density and concentration gradient, the potential drop across the membrane decreases.

Parameters
Parts I and II discuss calculation of and respectively, as functions of concentration and water content as well as membrane equivalent weight and the modulus of the hydrophobic matrix of a dry membrane;32,33 the required system parameters for these calculations are discussed therein. The properties specific to VRFBs are the infinite dilution diffusion coefficients in water and viscous volume of vanadium ions and vanadium-bisulfate ion pairs in solution, and respectively, the vanadium-sulfate binary diffusion coefficient , the vanadium-sulfate and vanadium-membrane interaction parameters and , - and -bisulfate association constants , and solvent/vanadium binding constant


Unfortunately, there are relatively few measurements of vanadium thermodynamic and transport properties in all its oxidation states at well-defined conditions. As described in Supplemental Material (SM), reported experimental values are used when available, and otherwise, parameters of cations of similar charge number approximate those of the vanadium ions. For and we fit to measured vanadium, sulfate, and water uptake in the membrane as a function of sulfuric acid and vanadium sulfate concentration detailed in Part I.32 Similarly, for we fit and to isotherm measurements. These parameters are plausible values for this system; however, they are estimates. Consequently, there is a strong need for fundamental thermodynamic studies of vanadium-ion properties in their different oxidation states (i.e. activity and osmotic coefficients as a function of concentration).


Throughout this paper, we will consider a reference VRFB system containing electrodes at a fixed composition and a membrane with fixed properties, which are provided in Table II. Calculations are made for this system unless stated. The electrolyte concentrations match those in experimental cells as described in Refs. 1, 3, 51 unless otherwise stated. In those studies, an initial solution of 1.5 mol dm−3 vanadium IV sulfate in 2.6 mol dm−3 sulfuric acid was twice charged with the positive electrolyte replaced after each charge. As outlined in SM, after this charging process and at a state of charge of 50%, the negative electrolyte has 0.75 mol dm−3 of both V(II) and V(III) and a total sulfate concentration of 4.66 mol dm−3. The positive electrolyte has the same concentrations of V(IV) and V(V) and a total sulfate concentration of 4.11 mol dm−3. The electrolyte solution mass density was 1.19 g cm−3.51 The separator in the reference system is a Nafion 212 membrane with a dry-membrane thickness, , of 51 μm. The membrane equivalent weight, (mass-polymer per mole-sulfonate group) is 1100.


Table II. Properties of the reference VRFB system.
| Properties | Parameter | Value |
|---|---|---|
| Negative electrode composition | 0.75 mol dm−3 | |
| 0.75 mol dm−3 | ||
| 4.66 mol dm−3 | ||
| Positive electrode composition | 0.75 mol dm−3 | |
| 0.75 mol dm−3 | ||
| 4.11 mol dm−3 | ||
| Polymer backbone modulus | 154 MPa | |
| Membrane equivalent weight | 1100 g-polymer/mol SO3 |


Other membrane properties considered are hydrophobic matrix modulus of the dry membrane, Archie's tortuosity scaling parameter, hydrophilic domain geometric transport factor, and spacing between hydrophilic domain in dry membrane, . sets the intrinsic concentration of ions in the membrane absent co-ions, limits the extent the membrane can swell with water from the surrounding environment, affects friction between the membrane and absorbed water and aqueous ions, and and dictate the hydrophilic domain size and network tortuosity, respectively, at a given water volume fraction. Unless otherwise stated, membrane properties are those of the Nafion PFSA separator and are detailed in Parts I and II.32,33


Numerical Implementation
Figure S1 (available online at stacks.iop.org/JES/167/013549/mmedia) outlines calculation of membrane properties, fluxes, and performance metrics. For a specified electrolyte composition in the negative and positive electrodes, Eqs. 14 and 15 specify at and . Part I outlines calculation of 32 Given the composition of the species in the membrane, Part II outlines calculation of 33 Equation 24 gives where the Python package Numdifftools V.0.9.39 calculates the Jacobian, using a first-order, forward-finite-difference approximation with a step size of for water and for ions. Given and Eq. 21 calculates The total concentration is set to 55.3 mol dm−3. For ideal volumetric mixing and isotropic swelling, the membrane thickness is is the average water content (), is the partial molar volume of water (=18.1 cm3 mol−1), and is the mass density of the dry membrane (=2.1 g cm−3).


To solve Eq. 19 for each species, we extend to electrolyte systems a method outlined by Krishna et al.52,53 for uncharged systems. Using this approach, Appendix B shows that for a specified current density, the species fluxes are specified by iterating over a set of six transcendental algebraic equations and neglecting changes across the membrane of: the thermodynamic factor because the solution composition from the most abundant species (sulfate, the membrane, water, and protons) changes relatively little across the membrane; because the molar density of the membrane change only slightly with composition; because the dominant factors its depends upon--ionic strength and water content inside the membrane--are relatively constant; and because the membrane concentration changes little between the electrodes. We evaluate , , and λ using the mean of the composition of the membrane at the interface with the two electrodes (), calculating the fraction of vanadium and protons that form ion pairs with sulfate at this composition. SM shows that the error introduced by these assumption is small. The derivative of is approximated as In Results and Discussion, we show this assumption is also reasonable.


Upon specifying species fluxes at a given charge and discharge current density, Eq. 11 gives and, using Eq. 12, Integration of Eq. 27 gives is a linear function of for the assumption of constant Upon calculating Eqs. 6, 2, and 1 give , , and To find the maximum discharge cell power density at (our adopted design criteria), we iteratively solve these equations for varying until finding the maximum.54 As previously stated, the electrode composition and are assumed constant during charge or discharge. This condition is achieved for incremental changes in during cycling.


We performed sample-based sensitivity analysis for the impact of membrane properties , and on transport properties and cell performance. SM details the sampling technique and range for these properties. The sensitivity analysis uses a cell current density of 200 mA cm−2 and the electrolyte composition is that of the reference conditions (see Table II).


Results and Discussion
Representative VRFB Membrane Transport
This section discusses transport in the reference system (see Table II) consisting of the quintessential VRFB membrane, Nafion, under typical electrolyte concentrations.
Transport properties
Equation 21 shows that the diffusion matrix captures transport coupling between all species due to thermodynamic interactions that specifies and for and frictional interactions that incorporates. For a thermodynamically ideal solution, and In a dilute solution ( and ), the matrix has the species/membrane diffusion coefficients on the diagonal while off-diagonal elements are equal to zero.


For Nafion in a VRFB, Fig. 2a plots the mean calculated diffusion coefficients on a heat map colored from dark blue (large positive coefficients) through white (coefficient equal to zero) to dark red (large negative coefficient) and the thermodynamic factor is given in parenthesis. The calculations show that transport in this system is far more complex than diffusion in an ideal, dilute solution. Although some off-diagonal terms of the diffusion matrix are small, they are not categorically negligible and in some cases are larger than the on-diagonal terms. For example, a concentration gradient of causes more than twice the flux of compared to an equal concentration gradient in A few of the diffusion coefficients are negative, indicating that the flux of one species will take place up the concentration gradient of another, holding all else constant. In particular, for all vanadium species is negative and large in magnitude.


Figure 2. Heat map colored from blue (positive), to white (zero), to red (negative) of (a) diffusion coefficient matrix with given tabulated values of (and in parenthesis) and (b) charge number-normalized transference numbers with values tabulated for the reference system (see Table II).


Download figure:
Standard image High-resolution imageThermodynamic nonidealities contribute to transport coupling in particular. for vanadium species and are close to ideal because positively charged ions do not significantly change the excess chemical potential of other positively charged species. for vanadium/water and /sulfate are mostly large because of the significant effect interactions between these species have on the excess free energy of the system.


Figure 2b shows a heat map of charge number-normalized transference numbers. Absent concentration gradients, protons will carry most of the current because Sulfate ions are the second largest carrier, and vanadium species each transport about 3% of the current.

Transport at open circuit
The concentration difference between electrodes creates concentration gradients in the membrane. Figure 3 shows the mole-fraction profile of each species in the membrane between the interfaces with the negative electrode () and the positive electrode () calculated using the procedure outlined in Appendix B with the no current density (i.e. ). For transport that is not coupled (i.e. dilute-solution approximation), the mole-fractions of the species will decrease linearly between the two electrodes. This behavior is not present in this system, indicating that transport coupling plays an important role.


Figure 3. Calculated mole fractions as a function of position in the membrane from (interface with negative electrode) to (interface with positive electrode) for current density for the reference system (see Table II). Note the scale change in the mole-fraction axis.


Download figure:
Standard image High-resolution imageThe vanadium species mole fractions in the negative electrode (V(II) and V(III)) goes to zero on approaching the positive electrode-interface, and the vanadium species mole fractions in the positive electrode (V(IV) and V(V)) decrease towards the negative electrode/membrane interface. The mole fractions of protons, sulfate, and membrane fixed-charged groups are relatively constant across the membrane with the latter two showing a slight decrease/increase towards the negative electrode and having a maximum/minimum away from the electrode interfaces. The dotted line in Fig. 3 shows , which generally matches and illustrates that the assumption equating the two is reasonable.


The water mole fraction decreases from the negative electrode to the positive electrode/membrane interface. Although the water mole fraction of the two electrode electrolytes are nearly the same, at the negative electrode is larger than at the positive electrode causing a concentration gradient inside the membrane.

The concentration gradients (see Fig. 3) drive fluxes according to the matrix of diffusion coefficients (see Fig. 2). Using as an example, Fig. 4 plots the contribution to (see Eq. 19) from the concentration gradient of species referenced to the membrane (i.e. where we abbreviate as ) as a function of position across the membrane. Each species plays an important role in driving transport with their contribution varying across the membrane. Where a concentration gradient is large, that species drives more transport. For example, around μm, vanadium gradients are largest and contribute substantially to transport. Approaching the positive electrode interface ( 58 μm), and leading to as this point, transport is then solely caused by the concentration gradient.


Figure 4. Flux of multipled by Faraday's constant, caused by a concentration gradient of calculated from Eq. 19 (i.e. ) as a function of position in the membrane.


Download figure:
Standard image High-resolution imageThe water concentration gradient is a key transport driving force. Although the water-driven diffusion coefficient is not large (see Fig. 2, Row 3, Column 1), the water concentration gradients are (see Fig. 3), thereby causing high water-related fluxes. The term () also contributes significantly to transport. Although is relatively small, as Fig. 3 shows, is large and positive and is negative. As a consequence, the term drives towards the positive electrode. Moreover, at the negative electrode (), is small but and are large and negative. The result is that pulls vanadium towards the negative electrode.


Figure 5 shows the calculated normalized mean flux contribution of each species due to the concentration gradients of each other species referenced to (i.e. ). The left side of Fig. 5 gives the total flux of each species multiplied by The points show species fluxes for an thermodynamically ideal solution (i.e. for and ).


Figure 5. Bar chart of flux of caused by a concentration gradient of normalizing by the sum of absolute values of each contribution and averaged over the membrane (i.e. ) for the reference system (see Table II). The dotted lines group contributions to species and the bars are for each species The circles show the same calculation with a thermodynamically ideal solution (i.e. for and ). The left side gives the total flux of each species multiplied by Faraday's constant and the term in parenthesis is the flux calculated for no interspecies friction (i.e. ).


Download figure:
Standard image High-resolution imageAs the large magnitude off-diagonal elements in Fig. 2 show, concentration gradients of species causes transport of species This finding is further evidence that dilute-solution theories in which a species transport is driven by only its own concentration gradient (i.e. ) is not sufficient to calculate transport accurately. To quantify this error, the term in parenthesis on the left side of Fig. 5 shows that the dilute-solution approximation (i.e. that the only friction on a species is due to the membrane, ) predicts fluxes that, on average (i.e. mean), deviate from the concentrated-solution model by 772%.


For all species, the principle transport driving force is the water concentration gradient. Water drives positively charged species to the positive electrode, resulting in a curvature of the vanadium species concentration gradients towards the positive electrode. To maintain electroneutrality, the water concentration gradient pushes sulfate to the negative electrode.
Mass-transport of ions and water is coupled because both the frictional interactions between species are nonzero and the excess chemical potential of species depends on the concentration of other species. When describing the solution as thermodynamically ideal (circles in Fig. 5), the behavior of the coupling between species is observed, since the thermodynamic nonidealities lead to quantitative differences from the ideal-solution approximation.
In practice, an operating cell will undergo numerous cycles and electrolyte rebalancing such that the composition in the electrodes varies, changing the concentration gradients. Consequently, the specific direction and contributions to fluxes in Fig. 5 do not apply throughout VRFB operation. Incorporating concentrated-solution theory into a fully transient model of VRFB operation would give insight into how these driving forces change during cell operation.
Transport under applied potentials
Under an applied potential, charged species migrate with the current. Figure 6 shows the flux of each vanadium species (multiplied by ) as a function of current density When current is positive, the concentration gradients acting on V(II) and V(III) are aligned and increasing current linearly increases vanadium flux. At negative currents, migration and diffusion are opposed causing the fluxes of V(II) and V(III) to go to zero. V(V) and V(IV) follow opposite scenarios than V(II) and V(III). This description is qualitatively consistent with previous work using a dilute-solution theory framework. For these electrolyte concentrations, the diffusional contributions causes a net flux of vanadium towards the positive electrode when the current is zero as shown in Fig. 5.


Figure 6. Vanadium flux multiplied by charge number and Faraday's constant as a function of current density for the reference system (see Table II).


Download figure:
Standard image High-resolution imageFigure 7 shows the mean contributions outlined in Eq. 19 to the V(II) flux from each diffusion term, (see Fig. 5) and migration, as a function of current density. As the current density increases, the fraction of flux due to migration increases. The contributions to flux from diffusion change slightly as the current density increases because migration alters the concentration gradients across the membrane. Above 250 mA cm−2, the majority of the vanadium V(II) flux is due to migration.


Figure 7. Mean contributions to the flux of V(II), from each diffusion term, (see Fig. 5) and migration, averaged across the membrane as a function of current density for the reference system (see Table II).


Download figure:
Standard image High-resolution imageFigures 4, 5, and 7 show that coupling plays an important role in transport though VRFB membranes. The contributions from water concentration gradients are particularly large.44 The calculations show that in cases that require only semi-quantitative predictions, neglecting the terms for will cause ∼25% error to the calculated fluxes at OCP with the error decreasing with increasing current density. As a result, mathematical models and experimental analysis that rely on extended versions of dilute-solution theories that incorporate the effect of water on vanadium fluxes will be qualitatively correct in many cases.


Cell performance
Figure 8 shows that the calculated (lines) and measured3 (symbols) voltage and Coulombic efficiencies, and respectively, as a function of current density. The calculated and measured efficiencies correspond to slightly different scenarios. The model calculates performance at a constant 50% (i.e. transport coefficients and concentration gradients are constant), whereas in the experiments charge and discharge between two voltage windows corresponding to different s. Despite these slightly different conditions, the model and experiment are in good agreement.


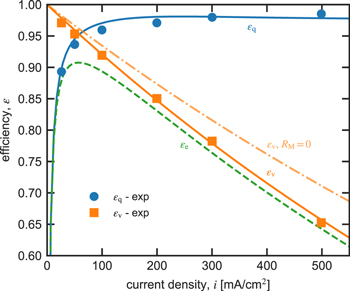
Figure 8. Measured (symbols, data from Ref. 3) and calculated (lines) Coulombic efficiency (circles), voltage efficiency (squares), and energy efficiency as a function of current density for the reference system (see Table II). Dot-dashed line shows for (i.e. without ohmic losses in the membrane).


Download figure:
Standard image High-resolution imageAs the current density increases, the Coulombic efficiency generally increases as the effects of crossover are reduced in comparison to the energy extracted from the cell. However, rising current density decreases voltage efficiency because the membrane and cell incur larger ohmic losses. As a consequence, the energy density increases initially, reaches a maximum, and then decreases with increasing current density. In the absence of resistance from the membrane (i.e. ), is higher, but non-membrane resistances limit the benefits of ultra-high conductive membranes.


Figure S2 shows voltage and Coulombic efficiency calculated using dilute-solution theory that only accounts for friction with the membrane (i.e. ) and an extended dilute-solution theory that also accounts for frictions with water (i.e. ). The dilute-solution theory severely miscalculates cell efficiencies. For Coulombic efficiency, the extended-dilute-solution theory closely agrees with concentrated-solution theory but slightly overestimates voltage efficiency. Based on this analysis, researchers should account for the effect of coupled-transport modes and, in particular, the role of ion-water interactions on cell performance.


Impact of System Properties
The molecular transport and thermodynamic models presented in Parts I and II calculate properties as a function of external electrolyte composition and membrane chemistry.32,33 The following sections use these models to determine how changes away from the reference system (see Table II) to operating conditions and membrane properties affect performance.
Impact of electrolyte concentration
In this section, we calculate the effect of changing the composition of the electrolyte in the electrodes. Specifically, varying the vanadium concentration (i.e. and ) between 0.1–1.8 mol dm−3 and the mean sulfate concentration in the electrodes (i.e. ) between 3.95–4.82 mol dm−3. This analysis neglects vanadium solubility limits in sulfuric acid that may be exceeded under certain conditions at high sulfate concentrations.41 Furthermore, we assume fast mass transfer from the bulk electrolyte to the carbon electrodes of the VRFB; at low vanadium concentrations mass-transport limitations may be important depending on the cell design.35,38,51,55


Transport Properties
Concentration of species in the external electrolyte solution strongly impact membrane transport properties. Figure 9 shows membrane conductivity (a), V(II)0 diffusion coefficient (b), and V(II) transference number (c) calculated at membrane composition as a function of the total vanadium molarity in the electrodes, and the lines are varying arithmetic average sulfate concentration in the electrodes. Figure S3 shows the membrane water content (a), proton molality (b), and V(II) molality (c) at the same conditions. For brevity, we plot the properties of V(II), which are representative of the transport properties of the other vanadium species.


Figure 9. Calculated membrane (a) conductivity (b) V(II)/0 diffusion coefficient and (c) V(II) transference number evaluated at composition as a function of the total vanadium molarity in the electrodes where the of the cell is 50% and the different lines are for different mean sulfate concentration in the electrodes of 4.82 mol dm−3 (solid lines), 4.39 mol dm−3 (dashed line), to 3.95 mol dm−3 (dot-dashed line).


Download figure:
Standard image High-resolution imageAs the concentration of vanadium in the external electrolyte rises, the proton content in the membrane decreases, as Fig. S3b shows. The loss of protons, which have high mobility, decreases membrane conductivity. As Fig. S3c shows, the vanadium content in the membrane also increases with rising vanadium concentration in the electrolyte leading to larger vanadium transport properties and Adding sulfuric acid increases the membrane proton concentration. Higher proton concentrations displace vanadium from the membrane, as Figs. S4b and c show. Consequently, at high vanadium concentrations in the electrode, rising sulfate concentration increases conductivity and decreases vanadium transport properties, as Fig. 9 shows. However, adding sulfuric acid in the external electrolyte also dehydrates the membrane, as Fig. S3a shows and Part I discusses.32 At low vanadium concentration in the electrodes, the dehydrating effects of additional sulfate dominates, causing membrane conductivity to decrease.


Cell Performance
Figure 10 shows the calculated Coulombic and voltage efficiencies, and respectively, (a) and discharge power density (b) at the current density that maximizes at =80% (termed optimal power density) as a function of the vanadium concentration and for different mean sulfate concentrations in the electrodes. To show how sensitive the optimal power density is to the target energy efficiency, shaded regions in Fig. 10b show power density at ±0.2% of the target energy density. As Fig. 9 shows, rising vanadium concentration in the electrode electrolyte increases the vanadium transference numbers and diffusion coefficients, decreasing Coulombic efficiency. To maintain an 80% energy efficiency, the current density decreases to lower ohmic losses and increase voltage efficiency. The cumulative effect lowers the optimal power density with increasing vanadium concentration. Moreover, the lower Coulombic efficiency at high vanadium concentration makes the optimal power density less sensitive to the required energy efficiency (i.e. narrower shaded region in Fig. 9).


Figure 10. Calculated (a) Coulombic and voltage efficiencies and (b) the maximum discharge power density at 80% energy efficiency (shaded region is ±0.2%) at the optimal power density as a function of the total vanadium concentration in each electrode at 50% SOC and for mean sulfate concentration in the electrodes of 4.82 mol dm−3 (solid lines), 4.39 mol dm−3 (dashed line), to 3.95 mol dm−3 (dot-dashed line).


Download figure:
Standard image High-resolution imageIncreasing sulfuric acid concentration in the electrolyte (shown in Fig. 10 as moving from dot-dashed to dashed to solid lines) exchanges vanadium in the membrane for protons, increasing membrane conductivity and decreasing vanadium transport coefficients, as Fig. 9 shows. The larger resulting Coulombic efficiency allows the system to incur more ohmic losses by operating at higher current densities while maintaining the target energy efficiency. As a result, increasing sulfuric-acid concentration in the electrolyte increases the optimal power density. However, at low vanadium concentrations, increasing sulfate concentration lowers membrane conductivity, as Fig. 9 shows. The addition of sulfuric acid will therefore be less effective at low active-species concentrations. Moreover, the improved optimal power density at low vanadium and high sulfuric-acid concentrations may not result in higher return on investment for VRFB systems if balance-of-plant costs increase due to lower energy density or higher pumping costs.42
Impact of membrane properties
The chemistry of the membrane impacts its transport properties. Here we focus on two common changes to the membrane: equivalent weight (EW, mass dry polymer per mole of charged group in the membrane, i.e., inverse of the ion-exchange capacity) and membrane modulus. EW is tuned by changing chemistry.6,7,9 For PFSA membranes, the EW is typically in the range 700 to 1500 g mol−1.46 PFSA membrane pretreatment changes its modulus by varying the number of physical crosslinks in the materials or its crystallinity.2,8,56 Annealing tends to increase and boiling tends to decreases the membrane modulus.56 In practice, EW and modulus are not independent because lower EW membranes tend to have lower moduli because the additional ionic groups on the polymer disrupt crystalization and crosslink formation.46
Transport Properties
Figure 11 shows membrane conductivity (a), V(II)/0 diffusion coefficient (b), and V(II) transference number (c) calculated at membrane composition as a function of EW and different dry-membrane moduli Figure S4 shows the membrane water content (a), proton molality (b), and V(II) molality (c) at the same conditions.


Figure 11. Calculated membrane (a) conductivity (b) V(II)/water diffusion coefficient and (c) V(II) transference number evaluated at composition as a function of equivalent weight, EW, for a dry-membrane modulus of 185 MPa (solid lines), 154 MPa (dashed lines), and 123 MPa (dot-dashed lines).


Download figure:
Standard image High-resolution imageIncreasing EW decreases membrane water content, as Fig. S4a shows, thereby decreasing hydophilic water volume fraction, increasing tortuosity of the hydophilic domains, and decreasing the pore size. As a result, membrane conductivity and V(II)/water diffusion coefficient decrease, as Figs. 11a and 11b show. Furthermore, increasing EW decreases the concentration of vanadium and protons in the membrane because there are fewer oppositely charged sulfonate groups for these ions to interact with. As EW increases, the vanadium concentration decreases more rapidly than proton concentration in the membrane, as Fig. S4b and c show, decreasing the vanadium transference number, as Fig. 11c shows.


Figure 11 shows (moving from dot-dashed to solid lines) that increasing the membrane modulus impacts transport properties similary to increasing EW. Raising the membrane modulus decreases water content, as Fig. S4a shows. The lower water content of the higher modulus membranes results in lower membrane conductivity and vanadium-water diffusion coefficients. As with EW, increasing the membrane modulus decreases the vanadium content in the membrane more rapdily than the proton content, decreasing the vanadium transference number.
Cell Performance
Figure 12 shows the calculated Coulombic and voltage efficiencies (a) and discharge power density (b) at the current density that maximizes at =80% as a function of equivalent weight EW and dry-membrane modulus As Fig. 11 shows, increasing EW decreases the vanadium transference numbers and diffusion coefficients, increasing Coulombic efficiency. However, conductivity also falls with increasing EW, lowering voltage efficiency and cell potential. The benefits of higher Coulombic efficiency do not outweigh the costs to voltage efficiency and cell potential. The net effect of increasing EW is a lower optimal power density.


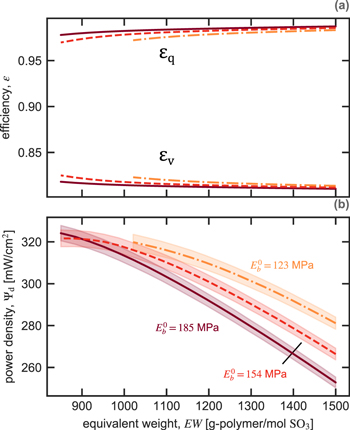
Figure 12. Calculated (a) Coulombic and voltage efficiencies and (b) discharge power density at 80% energy efficiency (shaded region is ±0.2%) as a function of equivalent weight EW for a dry-membrane modulus of 185 MPa (solid lines), 154 MPa (dashed lines), and 123 MPa (dot-dashed lines).


Download figure:
Standard image High-resolution imageDecreasing the membrane modulus (shown in Fig. 12 as moving from dot-dashed, to dashed, to solid lines) increases membrane conductivity, vanadium diffusion coefficients, and vanadium transference numbers, as Fig. 11 indicates. At high EWs, the resulting increase in cell potential and voltage efficiency more than compensates for lower Coulombic efficiency, leading to a higher optimal power density. These findings agree with experimental studies of cell performance with different EW membranes and varying mechanical reinforcement.6,9,30 At low EWs (<900 g-polymer/mole SO4), ameliorating the poor Coulombic efficiency by increasing membrane modulus offsets the voltage-efficiency losses and results in highest optimal power density.
Structure-Property-Performance Relationships
The model results show that transport properties in VRFB membranes (e.g. conductivity, diffusivities, etc) result from a complex interplay of multiple phenomena that are mediated by structural characteristics of the membrane (e.g. membrane modulus and EW). These transport properties, in turn, dictate VRFB performance (e.g. Coulombic efficiency). To provide general structure-property-performance relationships, we perform sample-based sensitivity analysis. This analysis (see Numerical Implementation) calculates properties and the performance of membranes over a range of equivalent weights, moduli, tortuosities, and hydrophilic domain shapes and sizes. This method is analogous to synthesizing a thousand membranes with attributes spanning this parameter space and measuring their properties and in-cell performance.
Figures S5, S6, and S7 show pair plots of structural attributes ( and ), exemplar transport and uptake properties ( and ), and cell performance at a current density of 200 mA cm−2 ( and ) and reference conditions (see Table II). Figure S8 gives the least-squares linear regression coefficients between the natural log of each variable. Based on the sample-based sensitivity analysis, Fig. 13 shows a chord diagram of correlation between (a) structural attributes of the membrane and transport and uptake properties and (b) membrane properties and cell performance metrics scaling the chord size by the Spearman rank correlation coefficient squared (Fig. S9 provides all values of the Spearman coefficients between variables). Spearman coefficient is a measure of correlated monotonicity between variables.


Figure 13. Chord diagrams of parameter sensitivity as measured by the Spearman correlation coefficient, between (a) structural parameters of the membrane and exemplar transport and uptake properties and (b) membrane properties and cell performance metrics at the reference electrolyte conditions with current density of 200 mA cm−2. The arch-length of the chord's intersection with the outer circle scales as the square of the Spearman coefficient (see Figure S9 for values). For clarity, connections with and between variables in the same group are not included.


Download figure:
Standard image High-resolution imageFigure 13a illustrates that dry-membrane domain spacing, and membrane modulus, are highly correlated to the molality of ions in the membrane and water uptake, respectively, because they directly affect the energetics of membrane partitioning (see Part I).32 The shape and tortuosity of the hydrophilic domains, quantified by and respectively, correlate with transport properties. The domain shape affects the transference number of vanadium, whereas the tortuosity influences the conductivity and diffusion coefficients. correlates with all of these membrane properties, but typically to a lesser extent than the other membrane attributes. Figure 13a suggests which membrane design approaches are likely to influence a property of interest. However, the structure-function correlations are not high (i.e. at most 0.8), indicating that varying the structure of the membrane does not guarantee altered properties. Moreover, structural attributes impact multiple transport properties such that properties cannot be tuned independently.


Figure 13b correlates the membrane properties with in-situ VRFB performance. Membrane conductivity directly governs voltage efficiency, and discharge power density, at a current density of 200 mA cm−2 (see Eqs. 1, 6, and 28), giving between these variables. Because conductivity is highly correlated with vanadium diffusivity, vanadium diffusion coefficients are also correlated with and but do not have a causal effect (see Fig. S7). The sensitivity analysis shows that Coulombic efficiency is highly correlated with vanadium transference number () and water-vanadium diffusion coefficient () and only weakly correlated with vanadium-vanadium diffusion coefficient (). These correlations are consistent with Fig. 7 in showing the crucial roles of migration and water-driven transport in cell operation. Water and ion uptake are weakly correlated to cell performance metrics. As such, screening membranes using ex-situ measurements of conductivity and vanadium transference number are most indicative of cell performance in these conditions.


Conclusions
This work develops a multicomponent, concentrated-solution model of transport in VRFB membranes that accounts for Stefan-Maxwell-Onsager transport couplings between species and thermodynamic nonidealities. The molecular-thermodynamics model outlined in Part I calculates ion and water partitioning into the membrane from the electrolyte in the electrodes and provides thermodynamic factors that influence species diffusion. The molecular-transport model outlined in Part II describes binary-diffusion coefficients between ions, water, and the membrane as a function of water content and composition.32,33 The resulting multicomponent diffusion coefficient matrix has large off-diagonal elements that dilute-solution theory neglects and that impact the net transport of the species through the membrane. Transport is highly coupled because of both thermodynamic and frictional interactions between species. In particular, water concentration gradients play a dominant role in vanadium crossover. Under an applied current, contributions to net flux from these diffusional modes and migration are aligned or opposed, depending on the direction of transport. Migration dominates at high current densities (>250 mA cm−2). The magnitude of coupling suggests that predictions made using dilute-solution theories for VRFB will be misleading. Extended-dilute-solution theories that account for the impact of water chemical potential gradients on vanadium transport are more reliable. Furthermore, membrane-permeation experiments that measure flux under ill-defined concentration gradients will not provide diffusion coefficients that are predictive of transport under other conditions. Even in the case of carefully designed experiments, the magnitude of measured diffusion coefficients should be interpreted in the context of the collective interactions between all species present in the system. Sensitivity analysis indicate that membrane conductivity and vanadium transference number are the best predictors of cell performance metrics.
The cell performance in terms of power density and energy efficiency depends on the complex interplay of the thermodynamic and frictional interactions of all species and their gradients. We studied the effect of sulfate and vanadium concentration in the electrode electrolyte and membrane equivalent weight and modulus on membrane properties, species transport, and cell performance. For a metric of maximum power density at 80% energy efficiency, low-vanadium and high-sulfuric acid concentration electrolytes perform best. However, the solubility of vanadium in sulfuric acid limits the success of this strategy. Membranes with low equivalent weights (i.e. high ion-exchange capacity) perform better. Specifically, decreasing EW from 1500 to 900 improves performance by 20% by increasing membrane conductivity. At high equivalent weights, a low modulus is superior, although perhaps not readily synthesizable.
Acknowledgments
The work presented here was funded, in part, by the Advanced Research Projects Agency - Energy (ARPA-E), U.S. Department of Energy (DOE) under Award Numbers DEAR0000149 (UTRC) and DEAC0205CH11231 (LBNL with cost share from UTRC). (The information, data, or work presented herein was funded in part by an agency of the United States Government. Neither the United States Government nor any agency thereof, nor any of their employees, makes any warranty, express or implied, or assumes any legal liability or responsibility for the accuracy, completeness, or usefulness of any information, apparatus, product, or process disclosed, or represents that its use would not infringe privately owned rights. Reference herein to any specific commercial product, process, or service by trade name, trademark, manufacturer, or otherwise does not necessarily constitute or imply its endorsement, recommendation, or favoring by the United States Government or any agency thereof. The views and opinions of authors expressed herein do not necessarily state or reflect those of the United States Government or any agency thereof). Work by Robert Darling was supported as part of the Joint Center for Energy Storage Research, an Energy Innovation Hub funded by the U.S. Department of Energy, Office of Science, Basic Energy Sciences under contract DE-AC02–06CH11357. The authors acknowledge fruitful discussions with Michael Gerhardt, Anamika Chowdhury, Ahmet Kusoglu, and Joseph Arthur.
Appendix A
Adding Eq. 18 to Eq. 17 puts the driving force in terms of ionic potential-independent term


where For an isothermal, isobaric system, the gradient of is a function of species compositions because the Gibbs-Duhem equation and electroneutrality reduces the degrees of freedom by 2. We expand left side of Eq. A1 using the composition variable


Substitution of Eq. A2 into Eq. A1 gives

By choosing species such that it has a charge number different from we can eliminate the mole fraction of species and on the right side by using the dependence of mole fractions and electroneutrality (), specifically giving and Rearranging A3 into a matrix form gives


where and are vectors with entries and respectively; is a by matrix containing entries


and

for and is a vector containing entries


Appendix B
Krishna et al.52,53 showed that with boundary conditions on at and the solution to Eq. A4 for constant and (we approximate as is


where is the identity matrix, the superscript denotes the matrix inverse, and the is the matrix exponential. The concentration gradient vector is then


We calculate the matrix exponential by diagonalizing the matrix argument and computing the exponential element-wise of the matrix eigenvalues. Eqs. B1 and B2 give the species concentration and concentration gradients as a function of species fluxes.
Equation B2 In conjunction with Eq. 19 calculate flux. The equations are an implicit set of algebraic equations that calculate flux. Krishna et al.52,53 showed that the following numerical method specifies flux: (1) calculate for (2) calculate from Eq. B2 at (3) use calculated at to calculate using Eq. 19; (4) recalculate using the calculated (5) repeat steps 2–4 until achieving convergence (here, set to 1 × 10⁻³ relative change in flux over an iterations).


