
Abstract
In this paper, the possibility of using generalized Peukert's equations C =Cm/(1 + (i/i0)n), C = 0.522Cmtanh((i/i0)n/0.522)/(i/i0)n, and C = Cmerfc((i/ik − 1)/(1/n))/erfc(−n) for the calculation of lithium-ion cells' released capacity at different discharge currents is analyzed. It is proven that these equations correspond well to the experimental data over the entire change range of the discharge currents. Furthermore, it is demonstrated that the parameter n depends on neither cell capacity nor its format or manufacturer; however, it grows with an increase of the ratio i0/Сm (or ik/Сm), which depends on an electrode's effective thickness and the electrochemical system of the lithium-ion cells. Additionally, it is possible to consider the dependence of a lithium-ion cell's released capacity on a discharge current value as the statistical phase transition subjected to the normal distribution law. The proposed statistical mechanism explains the changes of the parameters n and i0 (ik) based on the type of battery studied.
Export citation and abstract BibTeX RIS

This is an open access article distributed under the terms of the Creative Commons Attribution 4.0 License (CC BY, http://creativecommons.org/licenses/by/4.0/), which permits unrestricted reuse of the work in any medium, provided the original work is properly cited.
Many modern appliances and devices include batteries in their structure, e.g., smartphones, notebooks, and quadcopters. In the construction of such appliances, small-format lithium-ion batteries are predominantly used.1,2 Large-format lithium-ion batteries are used in electric vehicles (xEVs), aviation, etc.2–5 To design these appliances and improve their work optimization, reliable battery models are needed.
Most often, battery models are built based on the fundamental laws of ion and molecule movement in the frame of the macro-homogeneous model of porous electrodes.6–8 However, not all models built with the aid of this electrochemical modeling method are suitable for practical use.9 Such models are very complicated and cannot be computed by the on-board computers of xEVs or airplanes. Additionally, these models contain many local parameters, the measurement, of which is difficult, or even impossible at times. For example, it is impossible to measure the parameters inside of a porous electrode. It should be noted that many customers often require that model parameters can be measured without battery disassembly.
This is why practical battery models are often built based on a statistical modeling method9–12 or nonlinear structural modeling method.13 Statistical battery models are built based on various empirical equations, and the parameters of these models are found with the aid of statistical methods based on experimental data. Usually, statistical models are used when the use of an electrochemical model is impossible or undesirable9,10 or the modeled processes are poorly studied (e.g., thermal runaway,14–16 hydrogen accumulation in battery electrodes,17,18 and gas generation at the cycling of lithium-ion batteries19–21).
The Peukert's equation was one of the first empirical equations to describe the processes running in batteries.22 Even now, the Peukert's equation is widely used in various statistical models. In such papers,9,10 the Peukert's equation is used as a component of statistical models, by which the lithium-ion cells' residual capacity is calculated.
For the current research, the Peukert's equation is conveniently rewritten in the following form:

where С is the battery's released capacity at discharge current i and A and n are empirical constants.
Additionally, research on the Peukert's equation is of extra interest from the theoretical point of view. In previous papers23,24 based on the electrochemical model of lead-acid batteries, the authors have proposed their explanation of Peukert's equation by relying on the phenomenon of electrode sulfation and connecting it with phenomena such as changes of the active surface area and clogging of the pores. However, it should be noted that sulfation and its accompanying phenomena are absent in alkaline and lithium-ion batteries. Nevertheless, for these batteries, the Peukert's equation remains true.9,10,25,26 This fact alone causes doubts regarding the explanation of the Peukert's equation given in those articles.
As the Peukert's equation is true for the batteries of any electrochemical system, it must be connected only with some general parameters, and processes present in the batteries of such systems. The current investigation aims to establish these general parameters and processes.
Generalized Peukert's Equations
The classic Peukert's Eq. 1 is inapplicable for small discharge currents because when a discharge current falls, a battery's released capacity tends toward infinity, which has no physical sense. Presently, many generalizations of the Peukert's equation have been proposed to avoid this problem.22,27,28


The battery discharge process is a phase transition; however, phase transitions are often described with the complementary error function:28,29

where σ is the standard deviation and ik is the mean value of the statistical variable i.
Other equations exist to describe the dependence between a battery's released capacity at different discharge currents.22,30–32 However, in our previous papers,27,28 we proved (for the batteries of other electrochemical systems) that empirical Eqs. 2–4 correspond best with the experimental data over the entire range of discharge current changes, including those of small discharge currents. This is why in this paper, we study only these empirical equations.
Let us rewrite Eq. 2 in the following form:

where Сm is the maximum battery capacity (observed at small discharge currents because C(0) = Сm) and i0 is the current value, at which a battery's released capacity is equal to half of its maximum capacity because C(i0) = Сm/2. Thus, in Eq. 5, the constants have a clear electrochemical sense unlike in Eq. 2, wherein A and B are just empirical constants.
Let us also rewrite Eqs. 3 and 4 in the following forms:
In Eq. 6, the constants 0.522 are added so that parameters Сm and i0 have the same electrochemical sense as in Eq. 5. For Eq. 7, the conditions C(0) = Cm and C(ik) = Cm/erfc(−n) hold true. Consequently, also for Eq. 7, Сm is the battery's maximum capacity and ik is the current, at which the battery releases the capacity erfc(−n) times less than its maximum capacity. Based on our experiments, it will be shown below that n > 1; in this case, 1.84 ≤ erfc(−n) ≤ 2.
The parameters ik and  in Eq. 4 have a well-known statistical sense. From the comparison between Eqs. 4 and 7, it follows that

Therefore, in the rewritten Eqs. 5–7, the parameters have a clear electrochemical, and statistical sense unlike the empirical parameters in the initial Eqs. 2–4.
The functions C(i) in Eqs. 5–7 fall at the growth of the discharge current (at n > 0), which corresponds well to all known experimental data on the discharge of any battery.22,29,31
At small discharge currents, the battery of any electrochemical system releases its maximum capacity. Then, upon the growth of the discharge current to the current value Ie, the battery's released capacity is changed insignificantly. The discharge current interval (0, Ie) determines the working range of the discharge currents for this particular battery. Consequently, at small discharge currents, one more boundary condition must hold true:

Notably, parameter а must be either very small or equal to 0.
It is more convenient to compare Eqs. 5–7 for different batteries in the standardized coordinates (С/Сm, i/i0 (or i/ik)) rather than the coordinates (C, i). As such, let us write the boundary condition (Eq. 9) for Eqs. 5–7 in the standardized coordinates as well:
Thus, Eq. 5 satisfies the boundary condition (Eq. 9) at n > 1, whereas Eq. 6 does the same at n > 0.5.
Let us consider Eq. 12. At all values of n > 0, the function f1(n) changes in the range from −0.3 to 0 (Fig. 1). Consequently, the slope factor of the curve C(i) for Eq. 7 at i = 0 is negative and always less than 16.7°, i.e., it is very small. Therefore, Eq. 7 satisfies the boundary condition (Eq. 9) at n > 0 as well (Fig. 1).
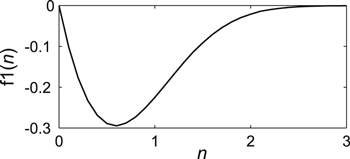
Figure 1. Dependence of curve slope factor С(i) on parameter n in Eq. 7 at i = 0 in the standardized coordinates.
Download figure:
Standard image High-resolution imageFinally, let us consider the electrochemical sense of parameter n in Eqs. 5–7. To do so, we must find the derivative of the function С(i) at the point i = i0 in the standardized coordinates:
The function f2(n) from Eq. 15 is shown in Fig. 2.

Figure 2. Dependence of curve slope factor С(i) on parameter n in Eq. 7 at i = ik in the standardized coordinates and the function f3(n) = 
Download figure:
Standard image High-resolution imageFor all the lithium-ion batteries studied in Eq. 7, n > 1.5. As such, according to Fig. 2, in the interval n > 1.5, the function f2(n) will look like the following:

Thus, in Eqs. 5–7 (within the accuracy of the constant), parameter n determines the decrease speed of the battery's released capacity in the point i = i0 (or i = ik) (Eqs. 13–16). Therefore, in those equations, all parameters (both Cm,i0, ik, and n) have a clear electrochemical sense unlike in the initial Eqs. 2–4, wherein all the parameters are just empirical constants.
Experimental
To verify generalized Peukert's Eqs. 5–7, lithium-ion cells of different formats and capacities, and made by different manufacturers (the manufacturers, models, and nominal capacities of the studied batteries are presented in Tables I–IV) were used. The cells were cycled according to their operation manuals.
Table I. Optimal values of parameters for Eq. 17.
| Manufacturer & model | Cn(Ah)a) | Tref(°K) | Cmref (Ah) | β | TL (°K) | K | δ (%)a) |
|---|---|---|---|---|---|---|---|
| Vapcell IMR18490 | 1.4 | 298 | 1.4 | 3.256 | 240.053 | 1.063 | 1.475 |
| LG 18650HE2 | 2.5 | 298 | 2.5 | 3.492 | 240.161 | 1.029 | 1.461 |
| Samsung INR18650-20R | 2 | 298 | 2 | 2.387 | 239.599 | 1.049 | 0.819 |
a)Nominal cell capacity. b)Relative error of experimental data approximation by Eq. 17 in Fig. 3.
Table II. Optimal parameters of generalized Peukert's Eqs. 5–7 for lithium-ion cells IMR with cathode LiMn2O4.
| Manufacturer & model | Cn(Ah)a) | Cm(Ah) | i0(A) or ik(A) | n | δ (%)b) | i0/Сmor ik/Сm | Dm(Ah)c) |
|---|---|---|---|---|---|---|---|
| Eq. 5 | |||||||
| Eizfan IMR21700 | 5 | 4.776 | 25.182 | 4.124 | 2.058 | 5.273 | 0.138 |
| Imren IMR18650 | 3.5 | 3.176 | 17.54 | 4.454 | 3.453 | 5.522 | 0.134 |
| Vapcell IMR18490 | 1.4 | 1.289 | 10.101 | 4.873 | 2.909 | 7.835 | 0.049 |
| Windyfire IMR18350 | 0.7 | 0.746 | 11.729 | 7.282 | 2.26 | 15.733 | 0.022 |
| Eq. 6 | |||||||
| Eizfan IMR21700 | 5 | 4.765 | 24.881 | 2.5 | 2.958 | 5.221 | 0.23 |
| Imren IMR18650 | 3.5 | 3.164 | 17.301 | 2.831 | 4.688 | 5.469 | 0.208 |
| Vapcell IMR18490 | 1.4 | 1.292 | 9.956 | 2.993 | 3.71 | 7.704 | 0.067 |
| Windyfire IMR18350 | 0.7 | 0.743 | 11.585 | 4.613 | 3.765 | 15.588 | 0.042 |
| Eq. 7 | |||||||
| Eizfan IMR21700 | 5 | 4.823 | 25.536 | 1.77 | 0.678 | 5.295 | 0.039 |
| Imren IMR18650 | 3.5 | 3.221 | 17.796 | 1.779 | 1.704 | 5.525 | 0.053 |
| Vapcell IMR18490 | 1.4 | 1.316 | 10.173 | 1.979 | 1.698 | 7.731 | 0.025 |
| Windyfire IMR18350 | 0.7 | 0.749 | 11.857 | 3.022 | 1.233 | 15.839 | 0.012 |
a)Nominal cell capacity. b)Relative error of experimental data approximation by Eq. 7 in Fig. 5. c)The maximum difference between the experimental values of the capacity and the values of Eqs. 5–7 at the same discharge currents for each cell studied.
Table III. Optimal parameters of generalized Peukert's Eqs. 5–7 for lithium-ion cells ICR with cathode LiCoO2.
| Manufacturer & model | Cn(Ah)a) | Cm(Ah) | i0(A) or ik(A) | n | δ (%)b) | i0/Сmor ik/Сm | Dm(Ah)c) |
|---|---|---|---|---|---|---|---|
| Eq. 5 | |||||||
| Vapcell ICR18500 | 2 | 1.966 | 9.163 | 5.175 | 1.515 | 4.661 | 0.08 |
| LG 18650HE2 | 2.5 | 2.385 | 40.102 | 5.559 | 3.083 | 16.812 | 0.11 |
| LG 18650 HA1 | 1.3 | 1.213 | 26.917 | 8.052 | 1.697 | 22.187 | 0.031 |
| Eq. 6 | |||||||
| Vapcell ICR18500 | 2 | 1.957 | 9.074 | 3.206 | 4.15 | 4.636 | 0.135 |
| LG 18650HE2 | 2.5 | 2.37 | 39.928 | 3.925 | 3.658 | 16.846 | 0.121 |
| LG 18650 HA1 | 1.3 | 1.21 | 26.714 | 4.94 | 2.722 | 22.078 | 0.063 |
| Eq. 7 | |||||||
| Vapcell ICR18500 | 2 | 1.988 | 9.266 | 2.179 | 1.251 | 4.662 | 0.034 |
| LG 18650HE2 | 2.5 | 2.336 | 41.546 | 2.640 | 1.258 | 17.789 | 0.025 |
| LG 18650 HA1 | 1.3 | 1.216 | 27.093 | 3.434 | 1.182 | 22.277 | 0.037 |
a)Nominal cell capacity. b)Relative error of experimental data approximation by Eq. 7 in Fig. 6. c)The maximum difference between the experimental values of the capacity and the values of Eqs. 5–7 at the same discharge currents for each cell studied.
Table IV. Optimal parameters of generalized Peukert's Eqs. 5–7 for lithium-ion cells INR with cathode LiNiMnCoO2.
| Manufacturer & Model | Cn(Ah)a) | Cm(Ah) | i0(A) or ik(A) | n | δ (%)b) | i0/Сmor ik/Сm | Dm(Ah)c) |
|---|---|---|---|---|---|---|---|
| Eq. 5 | |||||||
| LG 18650HE4 | 2.5 | 2.341 | 27.594 | 4.318 | 2.392 | 11.789 | 0.091 |
| LG 18650HG2 | 3 | 2.767 | 36.855 | 4.55 | 2.315 | 13.32 | 0.098 |
| Samsung INR18650-20R | 2 | 1.98 | 40.597 | 6.84 | 2.16 | 20.501 | 0.083 |
| Sony US18650VT3 | 1.5 | 1.496 | 31.762 | 6.847 | 0.958 | 21.234 | 0.021 |
| Eq. 6 | |||||||
| LG 18650HE4 | 2.5 | 2.333 | 27.281 | 2.627 | 3.436 | 11.696 | 0.149 |
| LG 18650HG2 | 3 | 2.758 | 36.517 | 2.807 | 3.093 | 13.239 | 0.15 |
| Samsung INR18650-20R | 2 | 1.993 | 40.131 | 4.1 | 2.711 | 20.135 | 0.089 |
| Sony US18650VT3 | 1.5 | 1.492 | 31.558 | 4.13 | 1.62 | 21.146 | 0.039 |
| Eq. 7 | |||||||
| LG 18650HE4 | 2.5 | 2.369 | 28.002 | 1.855 | 0.946 | 11.822 | 0.041 |
| LG 18650HG2 | 3 | 2.796 | 37.314 | 1.938 | 1.37 | 13.347 | 0.051 |
| Samsung INR18650-20R | 2 | 2.003 | 40.815 | 2.898 | 1.64 | 20.379 | 0.04 |
| Sony US18650VT3 | 1.5 | 1.494 | 32.034 | 3.021 | 0.949 | 21.435 | 0.023 |
a)Nominal cell capacity. b)Relative error of experimental data approximation by Eq. 7 in Fig. 7. c)The maximum difference between the experimental values of the capacity and the values of Eqs. 5–7 at the same discharge currents for each cell studied.
The charge procedure consisted of using the mode of the constant current and constant voltage (CC/CV) (charge: direct current 0.5 Cn to a voltage value of 4.2 V and step CV until the current fell to 0.025 Cn (Cn, nominal cell capacity). The cells were charged using a QL355P power supply, which was controlled by a computer (accuracy: voltage ΔU = ±(0.03% of reading + 5 mV), current ΔI = (0.2% of reading + 5 mA)).
The discharge procedure consisted of using the mode of the СС (discharge: direct current down to the voltage value of 2.75 V). When studying the cells, the discharge currents ranged from 0.2 Cn up to the currents, at which the cells' released capacity was close to zero. The cells were discharged using the electronic load of a BK Precision 8601, which was controlled by a computer (accuracy ΔI = ±(0.05% of reading + 0.05% of full scale)). The temperature of the cells was measured using an LM35 temperature sensor fixed to the side of the cells (accuracy ΔT = ±0.2% of reading (°C)). The cells were cycled inside of a Binder MK240 climatic chamber (Binder GmbH, Germany).
Before the experiment was conducted, each cell was cycled no less than 10 times to stabilize the cell parameters in connection with the SEI layer formation. The training cycles were fulfilled according to the operation manual of each cell (charge: the standard mode described above; discharge: direct current 0.2 Cn to a voltage value of 2.75 V). The training cycles were stopped when the observed capacities differed by less than 5% of three cycles in a row.
During the experiment, as the released capacity value at a certain discharge current, the obtained capacity value was taken as the average of the last three charge–discharge cycles. However, if the released capacity differed by more than 5% in these three cycles, additional training cycles were fulfilled, and the experiment was repeated again (or the cell was changed to another more stable cell, and the experiment was performed from the very beginning).
Thus, in our experiments (Figs. 3 and 5–7), each experimental point was measured several times. This way, the absolute error of each measured result (Figs. 3 and 5–7) could be calculated more accurately using statistical methods based on the obtained experimental results for each point of Figs. 3, 5, 6, and 7. In this case, both the accuracy of the measuring instruments used and the possible slight instability of the cell parameters were considered.
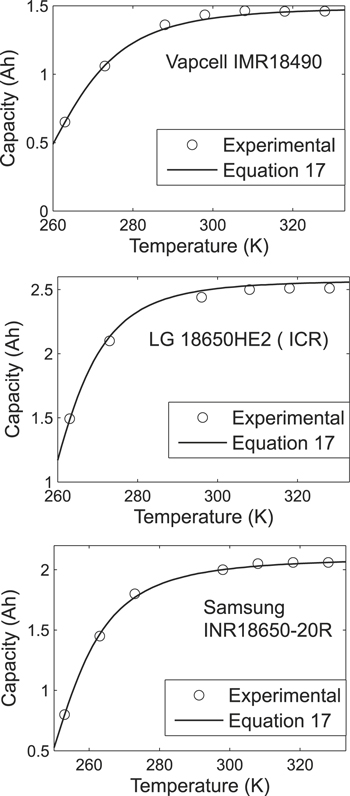
Figure 3. Dependence of cell released capacity on temperature at discharge current 0.2 Cn (Cn is the nominal cell capacity).
Download figure:
Standard image High-resolution imageBefore each discharge current or cell temperature change, training cycles were conducted to prevent the mutual influence of the charge–discharge cycles (due to various residual factors). The training cycles were performed until the difference of the found capacities started to be less than 5% of three cycles in a row.
Our cell cycling experiment demonstrated that in a batch of the same cells and when using the same cycling mode, the released capacity of the cells differed by 1%–2% or more. This was connected with many random factors, e.g., the cell statistical parameter dispersion in the course of their production, the time of cell operation, and the cell operation mode. That is why if the obtained experimental cell capacities via their maximum capacity (the values of which will be found experimentally for each particular cell) are standardized, eventually, all of the above random factors will be largely eliminated. This method allowed us to find the empirical curves more reliably.
Results and Discussion
The cells' released capacity was influenced by two external factors: the discharge current and the cell temperature.9,10
Dependence of the released capacity on cell temperature
At first, the influence of temperature on the cells' released capacity was studied. The cells were cycled inside of a Binder MK240 climatic chamber (Binder GmbH, Germany). The measurements were performed in a training cycling mode. The obtained experimental results are presented in Fig. 3.
In this research,10 the lithium-ion cells' released capacity at different temperatures was described in the following empirical equation:
where Сmref is the top capacity released by a cell at temperature Tref; TL is a temperature, at which С = 0, i.e., the temperature close to the freezing temperature of the electrolyte at which all electrochemical processes stop; and Tref is a reference temperature for the type of cells studied.
At T = Tref, the multiplier connected with the temperature in Eq. 17 was equal to 1, i.e., it had no influence on the cell capacity. However, when T → ∞, the thermal multiplier in the Eq. 17 tended toward the value of parameter K. Thus, parameter K showed (theoretically) how much capacity С in Eq. 17 could increase with the cell temperature growth in comparison with capacity Cmref.
The optimal parameters for Eq. 17 were found using the least squares method using the Levenberg–Marquardt optimization procedure. The obtained optimal parameters are given in Table I.
In Fig. 3, it can be seen that in the temperature range 25 °C–55 °C, the capacity's relative deviation from its average value was less than 1%. Thus, in this temperature range, the temperature influence could be neglected when studying the dependence between the cells' released capacity and the discharge current. This statement was true for all the studied cells (Tables II–IV).
Dependence of cells' released capacity on discharge current
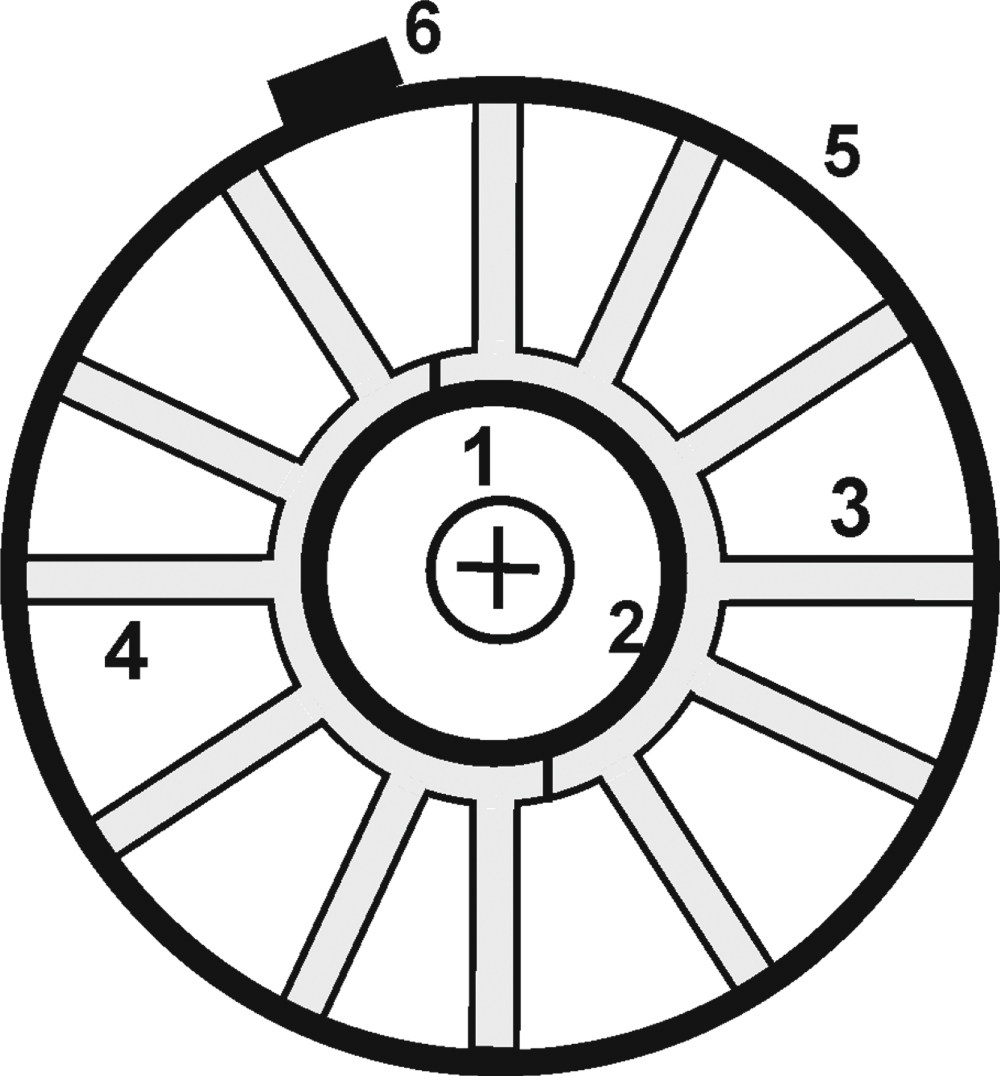
The cells were cycled inside of a Binder MK240 climatic chamber (Binder GmbH, Germany) at the temperature Т = 25°C. For the purposes of heat exchange and cooling intensity increase, when the cells were discharged by high currents, modified heat sinks were fastened to them (usually used for computer processor cooling). This fixation was done with the aid of heat-conducting paste MX-2 (ARTIC) and a specially manufactured clamp (Fig. 4). As a result, the temperature of the cells in all our experiments was well below 55 °C. None of the studied cells had protection, which why it was possible to discharge them using high currents.

Figure 4. Drawing of the setup (top view): (1) lithium-ion cell, (2) heat-conducting paste, (3, 4) two halves of a modified heat sink, (5) clamp, and (6) screw of the clamp.
Download figure:
Standard image High-resolution imageDuring the experiment, we constantly checked for possible aging of the cells before each measurement of each experimental point on any curve (Figs. 3 and 5–7). Before each change in the discharge current or element temperature, at least three training cycles were performed (see experimental section). However, the capacity Ct obtained in the training cycles was very close to the maximum capacity of the Cm cell, since the discharge current was small at 0.2 Cn. Therefore, by constantly measuring the Ct before each experimental point, we could control the aging process of the cells. All of our experiments used new cells. In addition, less than 100 charge–discharge cycles were required to obtain any curve in Figs. 5–7. This is probably why the capacitance Ct changed by less than 2% in all our experiments. This result indicated that aging processes were not significant in our experiments and did not affect the view of the curves in Figs. 5–7.
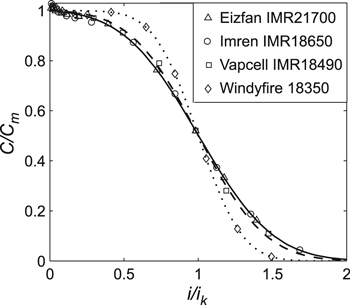
Figure 5. Experimental data for IMR lithium-ion cells with cathode LiMn2O4 and the generalized Peukert's Eq. 7. Cm is the maximum cell capacity, and ik is the current, at which cells' released capacity in erfc(−1/n) times less than their maximum capacity. Parameters Cm and ik were taken from Table II.
Download figure:
Standard image High-resolution image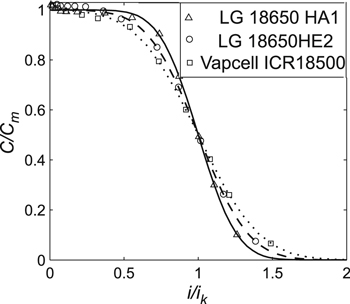
Figure 6. Experimental data for ICR lithium-ion cells with cathode LiCoO2 and the generalized Peukert's Eq. 7. Cm is the maximum cell capacity, and ik is the current, at which cells' released capacity in erfc(−1/n) times less than their maximum capacity. Parameters Cm and ik were taken from Table III.
Download figure:
Standard image High-resolution image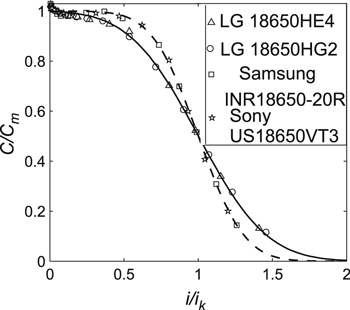
Figure 7. Experimental data for INR lithium-ion cells with cathode LiNiMnCoO2 and the generalized Peukert's Eq. 7. Cm is the maximum cell capacity, and ik is the current, at which cells release capacity in erfc(−1/n) times less than their maximum capacity. Parameters Cm and ik were taken from Table IV.
Download figure:
Standard image High-resolution imageIt should be noted that in the coordinates (С/Сm, i/i0 (or i/ik)), the view of the curves in Figs. 5–7 did not change even with significant aging processes. This was because in the case of cell aging, the parameters С, Сm, i, and i0 (ik) decreased proportionally. We experimentally verified this repeatedly.
Initially, lithium-ion cells of different capacities, formats, and manufacturers with the cathode LiMn2O4 (i.e., IMR cells) were studied. Figure 5 provides the obtained experimental data for the studied cells (in the standardized coordinates). The absolute error of the measured experimental data was ΔC = ±0.071 Ah (calculated using the statistical method, see experimental section). Parameters Cm and ik in Fig. 5 were taken from Table II. In this work, the optimal parameters for Eqs. 5–7 were found via the least squares method using the Levenberg–Marquardt optimization procedure. The obtained optimal parameters are given in Table II. In Figs. 5–7, the experimental data were approximated by Eq. 7, as this equation had the least relative error of approximation (as shown later).
Next, we considered lithium-ion cells of different capacities, formats, and manufacturers with the cathode LiCoO2 (i.e., ICR cells). In Fig. 6, the obtained experimental data are given (in the standardized coordinates) for the studied cells. The absolute error of the measured experimental data was ΔC = ±0.068 Ah (calculated using the statistical method, see experimental section). Parameters Cm and ik in Fig. 6 were taken from Table III.
Finally, lithium-ion cells of different capacities, formats, and manufacturers with the cathode LiNiMnCoO2 were studied (i.e., INR cells). In Fig. 7, the obtained experimental data are given (in the standardized coordinates) for the studied cells. The absolute error of the measured experimental data was ΔC = ±0.071 Ah (calculated using the statistical method, see experimental section). Parameters Cm and ik in Fig. 7 were taken from Table IV.
From the analyses in Tables II–IV, it was possible to come up with the following conclusions:
Firstly, generalized Peukert's Eqs. 5–7 could be used to evaluate the cells' released capacities, as the relative error of the experimental data approximation by these equations was less than 5%. As a rule, this error was acceptable for practical evaluations of battery residual capacity.9 However, it should be noted that the average relative error of experimental data approximation in Eqs. 5–7 decreased in the following sequence of Eqs. 5, 6 and 7. Thus, in all experiments, Eq. 7 corresponded best to the experimental data.
We compared the absolute error of the measured experimental data (approximately ΔC = ±0.07 Ah) and the maximum difference Dm between the experimental values of the capacity and those of Eqs. 5–7 at the same discharge currents for each cell studied (Tables II–IV). From this comparison, only in Eq. 7 was ΔC > Dm for all studied cells. Therefore, only Eq. 7 strictly corresponded to the experimental data within the experimental errors.
Secondly, from a theoretical point of view, the most interesting equation was Eq. 7. It had a statistical basis unlike Eqs. 5 and 6, which were purely empirical equations.
The lithium-ion cell discharge process is a phase transition; it runs between different phases of active mass on the cathode and anode. For example, in this study, for ICR lithium-ion cells during the charge–discharge cycle, the following phase transitions were observed regarding the active mass on the cathode and anode:


Often in physics,28,29 phase transitions are described by the complementary error function (Eq. 4), which is based on the normal law of distribution. Undoubtedly, on the level of molecules and ions, the discharge is a statistical process. Thus, judging by the good coincidence of the experimental data with Eq. 7 (Figs. 5–7), it was possible to conclude that the cells' discharge was a statistical process subject to the normal law of distribution. This experimental fact was significant for a theoretical explanation of the charge–discharge process in lithium-ion batteries as well as a better understanding of the Peukert's equation.
Thirdly, in the normalized coordinates (С/Сm, i/i0 (or i/ik)), Eqs. 5–7 depended only on the single parameter n. Notably, according to the experiments conducted (Tables II–IV), parameter n depended on neither the cell capacity nor its format or manufacturer.
However, as the ratio i0/Сm (or ik/Сm) increased, parameter n also grew; this was observed for cells of any type and manufacturer (Tables II–IV). Thus, the ratio i0/Сm (or ik/Сm) represented an important characteristic of the lithium-ion cells. Notably, if for two cells, the ratio i0/Сm (or ik/Сm) coincided within the experimental error, the parameter n of these cells also coincided within the experimental error (Tables II–IV); hence, the corresponding curves of the generalized Peukert's equations also coincided in the standardized coordinates. For example, in Fig. 5, the curves coincided for the Eizfan IMR21700 and Imren IMR18650 cells, whereas in Fig. 7, the curves coincided for the Samsung INR18650–20R and Sony US18650VT3 cells. Nevertheless, those cells had different capacities and were made by different manufacturers.
We further analyzed the ratio i0/Сm (or ik/Сm):
where j0 is the density of the discharge current i0, S is the surface area of electrodes, l is the average effective thickness of positive and negative electrodes, and ε is the specific effective capacity of electrodes.
Then,

The expression in the brackets on the right in Eq. 21 was determined by a particular electrochemical system (e.g., IMR) of the lithium-ion cells. For cells of this particular electrochemical system, this expression remained the same. Therefore, for lithium-ion cells of the particular electrochemical system, any growth of the ratio i0/Сm (or ik/Сm) was connected with a decrease of the electrodes' average effective thickness, l. However, the decrease of the electrodes' thickness (at the same cell capacity) enabled the cells to be discharged by high currents, bringing us to starter-type cells.29 Thus, the higher the ratio i0/Сm (or ik/Сm), the higher the working currents, by which the cells could be discharged. This assertion held true for all the studied cells (Tables II–IV).
According to the experiments conducted herein (Tables II–IV), along with the growth of the ratio i0/Сm, the parameter n also grew in Eqs. 5–7. Consequently, parameter n was a growing function of the ratio i0/Сm:
Thus, for cells of a particular electrochemical system (e.g., IMR), along with the decrease of the electrodes' effective thickness (l), parameter n grew according to Eq. 22. In this case, in Eqs. 5–7 (in concordance with Eqs. 13–15), the inclination angle grew in the generalized Peukert's equations in the point i = i0 (or i = ik). Consequently, the starter-type cells' released capacity fell much faster than that of cells able to be discharged by small currents. This fact corresponded perfectly to the experimental data obtained (Figs. 5–7).
Additionally, it should be noted that from Eq. 21, for parameter i0, we obtained the following equation:

Thus, for cells of a particular electrochemical system (e.g., IMR) and with the same capacity, the parameter i0 grew as the electrodes' effective thickness decreased (Eq. 23). This corresponded well to the experimental studies (Tables II–IV).
It was possible to conclude that as the discharge current grew, the starter-type cells' released capacity was conserved virtually unchanged much longer than those only able to be discharged by small currents. The starter-type cells' released capacity fell much faster (Eqs. 13–15 and 22), which was in good agreement with the experimental data (Figs. 5–7).
In our opinion, such behavior of generalized Peukert's Eqs. 5–7 regarding the lithium-ion cells could be explained with due consideration of the distribution pattern of the electrochemical process along the depth of a porous electrode.
To describe the distribution of the discharge current j(x) along the depth of the porous electrode (for a one-dimensional electrode model) in the simplest case of the Butler–Volmer linear function ( ) on the boundary of an electrode/electrolyte, we obtained the following equation:33,34
where the electrode start is located at the point x = 0, J is the density of the external current, ρ is the specific resistance of the electrolyte in a porous electrode, s is the surface area of pores in an electrode volume unit,  is the half-thickness of an electrode at a bilateral current supply, α is the specific conductivity for the activation process on the boundary electrode/electrolyte, and φ is the polarization inside of a porous electrode.
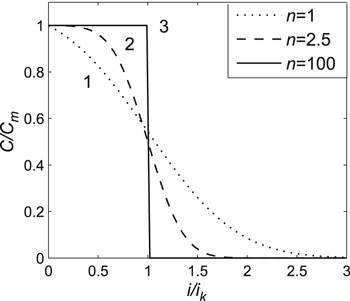
In the case of a uniform distribution of the discharge electrochemical process along the depth of the porous electrode, the entire active mass of the electrodes would be discharged uniformly, regardless of the discharge current. In this case, the cells' released capacity would be the maximum Сm and not depend on a discharge current.
However, at very high discharge currents (because of the cells' inner resistance), when switching on the element to discharge, the voltage at its terminals would be less than the lower cut-off voltage, i.e., the cells' released capacity would be equal to zero. Thus, in the case of a uniform distribution of the electrochemical process along the porous electrode depth, the function С(i) had to have a rectangular form (Fig. 8 (3)). However, in a real electrode, the electrochemical process decreased exponentially along the depth of the porous electrode (Eq. 24).
Figure 8. Generalized Peukert's Eq. 7 in standardized coordinates for various values of the parameter n.
Download figure:
Standard image High-resolution image
From Eq. 24, it followed that
Thus, as the electrodes' effective thickness l decreased, the distribution of the electrochemical process along the porous electrode depth tended toward a uniform distribution, whereas the function С(i) tended toward a rectangular form (Fig. 8 (1, 2, 3)).
In general, as the electrode thickness decreased (or as parameter i0/Сm grew (Eq. 21)) for cells of a particular electrochemical system, the statistical dispersion fell for a state of discharge of the active mass along the depth of the porous electrode (Eq. 25). Consequently, the statistical dispersion σ in Eq. 4 fell for the entire cell discharge process. In Eq. 7, the statistical dispersion for the cell discharge process in the standardized coordinates was determined by parameter 1/n. Thus, as the electrode thickness decreased, parameter n in Eqs. 5–7 grew (for cells of a particular electrochemical system), which corresponded to the obtained experimental data (Tables II–IV).
The same conclusion followed from Eq. 22 as well, i.e., that as the electrodes' effective thickness decreased, parameter n (for cells of a particular electrochemical system) grew, and, along with it, the standard deviation σ in Eq. 4 fell according to Eq. 8. Consequently, in this case, the function С(i) tended toward the rectangular form (Fig. 8 (1, 2, 3)).
Conclusion
In conclusion, we would like to draw attention to a number of advantages of the proposed generalized Peukert's Eq. 7 as compared with the classic Peukert's Eq. 1 and Eqs. 5 and 6.
Firstly, the generalized Peukert's Eq. 7 had a clear statistical and electrochemical sense unlike Eqs. 1, 5, and 6, which were purely empirical equations. This statistical mechanism of the cells' discharge process explained the parameter changes of Eq. 7 depending on the type of battery used (Eqs. 18–25).
Secondly, Eq. 7 had the least approximation error of the experimental data (less than 1.7%), which was satisfactory for practical evaluation of the cells' released capacity. It should also be noted that only in Eq. 7 was the absolute error of the measured experimental data ΔC greater than the maximum difference Dm between the experimental values of the capacity and those of Eqs. 5–7 at the same discharge currents for each cell studied (Tables II–IV). Therefore, only Eq. 7 strictly corresponded to the experimental data within the experimental errors.
As various generalizations of the Peukert's equation are widely used in diverse evaluations and models,9,10,23,35–37 the clarification of the equations and their underlying physical and electrochemical mechanisms has great practical significance.