
Abstract
We report on the performance and durability of four Pt-based cathode catalysts in a microfluidic  fuel cell: commercial unsupported Pt and
  as well as in-house acid-treated
  (
( -at) and
  . Commercial
  was used as the starting material for both
  -at and
  . The composition of the resulting catalysts was confirmed via X-ray photoelectron spectroscopy analysis. In situ cathode studies were performed using an acidic microfluidic
  fuel cell with an analytical platform. The electrolyte flow rate was optimized to minimize the effects of water management such that fuel cell performance is kinetically limited by the oxygen reduction reaction (ORR). In addition, electrolyte concentration was separately varied to determine cathode performance as a function of acidic pH. All four catalysts demonstrated good short-term activity and stability under fuel cell operating conditions in harsh acidic environments, with the
  alloy exhibiting the highest activity. Furthermore, both modified catalysts,
  and
and  -at, exhibited superior durability compared to commercially available
  and Pt in the accelerated cathode aging studies performed within the microfluidic fuel cell via potential cycling. In situ impedance analysis of the
  cathode revealed enhanced catalyst stability and electrode durability as the cause of the dramatic improvements in long-term performance.
Export citation and abstract BibTeX RIS
For the widespread commercialization of small-scale fuel cell technologies, significant and simultaneous reductions in system costs (i.e., catalysts) and enhancements in activity and durability are required.1–3 In particular, improving the cathodic oxygen reduction reaction (ORR) remains a key challenge. Sluggish kinetics and high overpotentials associated with the ORR hamper both energetic efficiency and peak power production.4 Furthermore, the high cost and limited availability of platinum (Pt) necessitate the development of alternative catalysts, which either reduce or eliminate Pt content.2 Many Pt-free oxygen reduction catalysts have been explored, including ruthenium-based chalcogenides,5–7 metal oxides,8 transition carbides,9 cobalt–polypyrole–carbon composites,10 enzymes,11 and pyrolized porphyrins,12–16 but none have shown the necessary combination of electrocatalytic activity and stability under acidic conditions to replace Pt-based catalysts in fuel cell systems. Alloying Pt with transition metals (i.e.,  , Ni, Fe, Cu, etc.) not only reduces catalyst costs by lowering Pt loading but can also increase the ORR activity over pure Pt in acidic media.4, 17–21 Recent work by Stamenkovic et al. suggests that Pt–Co alloys are the most promising of these Pt–M catalysts due to favorable shifts in Pt d-band energy centers, which alter the electronic structure and improve the ORR activity.22 Several other factors have also been proposed as key contributors to the enhanced catalytic activity including, but not limited to, changes in the geometric structure (Pt–Pt bond distance), increased particle surface roughness, and particle size effects.4, 17, 20–27 However, studies also indicate that under acidic conditions, the Pt–M alloys may exhibit instability and lose oxygen reduction activity due to leaching of the transition metals from the alloys.2, 28 According to Gasteiger et al. , transition-metal dissolution is due to: (i) excess transition metal on the Pt surface, (ii) incomplete alloying of the two metals, and (iii) transition-metal leaching for a well-alloyed Pt–M catalyst under acidic fuel cell operating conditions.2 Leaching of the transition metal from the catalyst surface cannot only reduce electrocatalytic activity, but also increase ohmic resistance and accelerate membrane electrode assembly degradation in polymer electrolyte membrane (PEM)-based fuel cells.2, 29–31 The surface dissolution of the transition metals can result in a core-shell or a skeleton configuration that are comprised of Pt surface atoms with underlying transition-metal atoms.21, 24 The resulting geometric and electronic distortions lead to more stable enhancements of the ORR activity.24, 32 However, Antolini et al. observed that the reported stabilities of many Pt–M alloys in acidic environments are often conflicting and vary widely depending not only on experimental parameters (i.e., temperature, pressure, and pH) but also on material characteristics (i.e., degree of alloying) rather than just on the choice of a particular transition metal.28 These findings demonstrate that the exact experimental configuration used for characterization can significantly impact reported Pt–M stabilities, as some reported results have observed high stabilities in the PEM-based fuel cells and low stabilities in half-cell setups for identical materials.28
Here, we compare the performance and durability of four different Pt-based cathode catalysts for the ORR in a previously developed microfluidic hydrogen–oxygen  fuel cell (Fig. 1), which functions as an analytical platform.33, 34 This configuration enables the experimental versatility of a traditional three-electrode electrochemical cell while operating as a true fuel cell. The four cathode catalysts investigated are commercial unsupported Pt and
  , as well as in-house modified acid-treated
  (samples referred to as
  -at from here on) and
  (Fig. 2). Others have shown that adding molybdenum (Mo) to palladium (Pd)-based oxygen reduction catalysts promotes activity, improves stability, and enhances carbon monoxide (CO) tolerance;35, 36 thus, the addition of Mo to an already ORR active catalyst,
  , is investigated in this study. Ex situ character analyses of both catalyst materials before and after measurements, including the analysis of surface compositions, were confirmed via X-ray photoelectron spectroscopy (XPS) analysis.

Figure 1. Modular schematic of a microfluidic  fuel cell that utilizes a flowing electrolyte stream and can serve as a catalyst/electrode characterization platform.

Figure 2. Cartoon of cathode catalyst development strategy. The new catalyst materials of  and
and  -at were both modified from as-received, commercial unsupported
  (
( , E-TEK) via a Mo addition and a cyclic acid treatment, respectively. The activity and stability of all three catalysts (
 ,
,  -at, and
  ) were compared to Pt black (Pt, Alfa Aesar) over a range of experimental conditions.
Varying the parameters, such as flow rate, pH, and composition, of the aqueous electrolyte flowing between the two electrodes enables detailed performance analyses unencumbered by typical fuel cell limitations (i.e., water management and by-product removal). Moreover, in situ half-cell analyses of individual electrode characteristics can be compared over a wide range of fuel cell operating conditions (i.e., high current densities) by placing an external reference electrode at the electrolyte stream outlet.33, 37 These techniques were used to investigate the activity, stability, and durability of the four Pt-based catalysts as cathode materials over a range of experimental conditions through in situ chronoamperometric and impedance measurements in our microfluidic  fuel cell.
Experimental
Catalyst preparation
All modification procedures started with 3–5 nm unsupported  (E-TEK) nanoparticles based upon manufacturer specification. To obtain the
  nanoparticles, the mixture of as-received unsupported
  nanoparticles, phosphomolybdic acid
  , and Millipore water was sonicated (3510 Branson) for 15 min before refluxing at
  under constant stirring and argon (Ar) flow for 1 h. After cooling the nanoparticle mixture to room temperature, 25 mL
  was added in a dropwise fashion under sonication. The solution was reheated to
  under constant stirring and Ar flow for 10 min and was then cooled to room temperature. The resulting
  nanoparticles were filtered from the solution and rinsed with Millipore water
  to remove all unwanted residuals.
To obtain the acid pretreated nanoparticles, as-received  was loaded into a gold (Au) boat, which was carefully filled with 0.5 M
  so as not to dislodge the catalyst particles on the bottom of the boat. The catalyst was then cycled 40° times between 0 and 1.40 V vs reversible hydrogen electrode (RHE) at a scan rate of 50 mV/s.32 After each modification, both the resulting catalysts,
  and
and  -at, were filtered from the solution and rinsed with Millipore water
  to remove all unwanted residuals
XPS measurements
XPS studies were performed on all  -based catalysts before and after modification procedures to confirm the changes in the surface structure and binding energies (BEs). A combined electrochemical and ultrahigh vacuum (UHV) XPS system was used so that electrochemical and XPS measurements could be conducted without sample exposure to the ambient environment during transfer between the electrochemical and UHV chambers.32, 38 For the XPS characterization, 5.0 mg/mL suspensions of desired catalyst nanoparticles in Millipore water were prepared. After sonication for 30 min,
  of catalyst suspension was deposited onto a gold disk, and the XPS measurements were taken. Using the M-Probe ESCA software, version 1.36 (Fisons Surface Science), the XPS spectral peaks were fitted using a mixed Gaussian–Lorentzian line shape and Shirley baselines. The BE scale was calibrated using
  (at 84.0 eV) and
  (at 932.68 eV).39
CV measurements
Cyclic voltammogram (CV) measurements were carried out using a three-electrode electrochemical cell with a rotating disk electrode (RDE, Autolab, EcoChemie) with a Au tip of 3 mm diameter (polished down to  ), a Ag/AgCl (
 , BAS) reference electrode (in a separate compartment), and a Pt wire (Alfa Aesar) counter electrode. Measurements were performed with a potentiostat (Autolab PGSTAT 100, EcoChemie). A 5.0 mg/mL suspension of the desired catalyst nanoparticles, either Pt black or
  -based alloys, in Millipore water was prepared. After sonication for 30 min,
  of the catalyst suspension was deposited on the RDE. The geometric surface area of the RDE was calculated to be
  , and this value was used for the calculation of the current densities for the CVs. The CVs were measured in 0.5 M
  which was bubbled with nitrogen for 30 min before testing. For the
  -based alloys, voltammograms were measured from 0 to 1.2 or 1.4 V vs RHE at a scan rate of 50 mV/s. For the comparative Pt black, the voltammogram was measured from 0 to 1.4 V vs RHE at a scan rate of 20 mV/s. The RDE was stationary for all measurements.
Gas diffusion electrode preparation
Four different cathode catalysts were investigated: as-received  (
( , E-TEK), Pt black (Pt, Alfa Aesar), (
 -at), and
  . For all studies, Pt black was used as the anode catalyst. Each catalyst ink was prepared by mixing 12 mg of the desired catalyst, 0.4 mg Nafion (5 wt % solution, Aldrich) as a binder,
  Millipore water, and
  isopropyl alcohol. The catalyst ink was sonicated (Branson 3510) for 2 h to obtain a uniform mixture, which was then painted on a Toray carbon paper gas diffusion layer (EFCG "S" type electrode, E-TEK) to create a gas diffusion electrode (GDE). The electrodes (geometric surface area:
  ) were then hot-pressed (Carver 3851-0) at 340 psi
  and
and  to ensure that the catalyst layer was compacted into the gas diffusion layer. All GDEs, both anode and cathode, had the
  desired catalyst and
  Nafion.
Fuel cell assembly and testing
Two GDEs, anode and cathode, were placed on opposite sides of a 0.15 cm thick poly(methyl methacrylate) sheet, such that the catalyst-covered sides interfaced with the 3 cm long and 0.33 cm wide precision-machined window. The window had an inlet and an outlet on either side such that the aqueous sulfuric acid ( , GFS Chemicals, Inc., double distilled by Vycor) electrolyte flows between the electrodes. Two 0.1 cm thick graphite windows served as the current collectors. The hydrogen and oxygen gas flow chambers
  were precision-machined into polycarbonate sheets. This multilayered assembly was held together using binder clips (Highmark). Fuel cell studies were conducted using a potentiostat (Autolab PGSTAT-30, EcoChemie) at room temperature with hydrogen and oxygen gas (laboratory grade, S.J. Smith), each at a flow rate of 50 sccm. Electrolyte flow rates were varied from 0.0 to 0.9 mL/min using a syringe pump (Harvard apparatus). The concentration of
  was varied from 0.25 to 3.0 M (approximate pH range of 0.6 to −0.48). Fuel cell polarization curves were obtained by steady-state chronoamperometric measurements at different cell potentials. All studies were conducted four times to ensure the immediate chemical and electrocatalytic stability of the cathodic materials under the acidic fuel cell operating conditions. Because all catalyst loadings were identical,
  , the exposed geometric electrode surface area
  was used to calculate the current and power densities for the microfluidic
  fuel cell tests. The aqueous electrolyte stream exited the fuel cell through a plastic tube (Cole Parmer, 1.57 mm i.d.) and was collected in a beaker. The polarization losses on the anode and the cathode were independently analyzed using multimeters (Fluke) by placing a Ag/AgCl reference electrode (
 , BAS) in the collection beaker.33, 34, 37 No potential drop was observed along the plastic tubing connecting the fuel cell and the reference electrode.37
Electrochemical impedance spectroscopy (EIS) measurements were performed on the acidic microfluidic  fuel cell operated with the five different cathode catalysts. AC impedance spectra were obtained using a frequency response analyzer module controlled by a potentiostat (Autolab PGSTAT-30, EcoChemie). The spectra were measured at a constant voltage mode by decreasing frequencies from 10 kHz to 30 mHz at 9 points/decade. The modulating voltage was 10 mV root-mean-squared. The measurements were performed at cell potentials ranging from 100 to 800 mV. The resulting Nyquist plots isolated the effects of the internal cell resistance
  and fuel cell electrode charge-transfer resistance
  . Each measurement was performed three times.
Accelerated electrochemical aging
By cycling electrodes across a potential range, catalyst dissolution rates were accelerated, leading to rapid performance losses due to a reduced electrochemical surface area. The rate and extent of these losses depended on the potential ranges and the cycle patterns (i.e., square waves vs cycles). Here, cathodes were aged in a three-electrode electrochemical cell via cyclic voltammetry under acidic conditions. Each cathode was cycled over a range of fuel cell operating potentials (0.10–1.00 V vs RHE) in 0.5 M  for 1000-cycle sets at a 50 mV/s scan rate. After each set of 1000 cycles, the electrodes were rinsed with Millipore water to remove any residual acid. Between cycling sets, the cathodes were tested in an acidic microfluidic
  fuel cell to investigate the effects of aging on the electrode performance.
Results and Discussion
The activity, durability, and stability of the four catalysts, Pt,  ,
,  -at, and
  , were investigated as cathode materials under multiple experimental conditions using an acidic microfluidic
  fuel cell as an analytical platform. By varying the acidic electrolyte flow rate and concentration, we were able to compare the performances of the different cathodes at high current densities (at peak power density) within an operating fuel cell. Furthermore, accelerated aging studies by potential cycling offered insight into cathode durability under extended fuel cell operation. Ex situ analyses of the catalysts before and after measurements were performed by XPS and CV.
Ex situ characterization
XPS studies were performed on the as-received  samples and the new samples,
  -at and
  , to characterize the surface chemical composition and to confirm the success of the modification procedures. The comparative XPS survey spectra of the commercial alloy before and after cyclic pretreatment under acidic conditions are shown in Fig. 3. For the commercial
  sample, a nominal atomic Pt:Co ratio of 3:1 was determined from the XPS peak analysis (Fig. 3a), confirming the quality of the as-received sample. Cobalt (Co) peaks arise at 800 and 780 eV, corresponding to a
  peak and a
  peak, respectively.32, 40 The strong oxygen peak at 531 eV, along with the positive shift in the BE of the Co peaks, indicates a cobalt oxide surface species. Metallic Co is present as a shoulder in the
  peak at 778 eV. Further quantitative analysis of the Co signals shows that
  is cobalt oxide and
  is metallic Co (Table I). After the acidic electrochemical pretreatment, the XPS spectrum shows a disappearance of the Co 2p and the O 1s peaks (Fig. 3b), but the platinum and the metallic Co peaks remain, which indicates that the surface cobalt oxides have dissolved.32 This dissolution of the metal oxide species under acidic conditions causes a decrease in the oxygen reduction activity of the Pt–Co alloy.2 However, the dissolution of the surface cobalt oxides from the nanoparticle surface leads to the formation of a core-shell catalyst particle or a skeleton structure with a Pt surface and a Co-rich layer beneath, enhancing the activity of the Pt–Co catalyst.21, 24 Here, the formation of a core-shell structure is further supported by the CV and XPS data. CVs of the as-received and pretreated
  sample (Fig. 5a) show the removal of the Co surface species of the pretreated sample, as it now resembles the CV of pure Pt (Fig. 5b). Further XPS peak analysis of the acid pretreated
  sample confirms the removal of all cobalt oxide species, yet Co is still present as metallic Co, beneath a protective Pt skin, which agrees with the CV (Fig. 5a), which lacks Co peaks; only those of Pt remain (Table I). More detailed XPS and electrochemical analyses of the
  ,
,  -at, and Pt catalysts may be found in a previous publication by Duong et al.32

Figure 3. XPS survey spectra of commercial  (E-TEK) (a) as-received and (b) after electrochemical pretreatment with key peaks labeled. The electrochemical pretreatment consisted of 40 cycles between 0 and 1.40 V vs RHE at 50 mV/s in 0.5 M
  .
.
Table I. Quantitative surface analysis of as-received  before and after electrochemical pretreatment in 0.5 M
  .
.
 |
 -at -at | |
|---|---|---|
| Pt:Co ratio | 3:1 | 36:1 |
| Cobalt oxide concentration (%) |
 | 0 |
| Metallic cobalt concentration (%) |
 | 100 |

Figure 5. CVs of  -based catalysts in 0.5 M
  : (a) Commercial
  and
and  -at and (c) commercial
  and in-house modified
  recorded at 50 mV/s. (b) For comparison, a CV of Pt black, recorded at 20 mV/s.
The addition of Mo was added to the  catalysts to test the activity and stability, similar to the addition of Mo to Pd-based catalysts.35, 36 XPS survey spectra (Fig. 4) and CVs (Fig. 5c) were also performed to verify the successful molybdenum (Mo) deposition onto the
  . Though difficult to discern from the broader survey spectra shown in Fig. 4a, small dual Mo peaks exist at 231 and 236 eV, confirming the deposition (Fig. 4b). Based upon the position of the BE peaks, Mo exists on the catalyst surface both in metallic form (
 peak at 231 eV) and in oxide form (possibly
  peak at 236 eV).40 From the peak analysis, nominal atomic ratios of 3:1 and 37:1 are determined for Pt:Co and Pt:Mo, respectively. Previous work by Raghuveer et al. and Sarkar et al. on the oxygen reduction activity of Pd–Co–Mo and Pd–Mo, respectively, demonstrated that catalytic performance decreased if alloys contain greater than 10 atom % Mo.35, 36 This decrease in the catalytic activity would be due to a reduction in electrochemically active surface sites, as the ORR does not occur on Mo. Therefore, a low deposition of the transition metal is favorable and is reflected in our
  catalyst with a
  to 3 atom % Mo.

Figure 4. (a) XPS survey spectra of in-house modified  after the Mo modification. (b) Blown-up view of the 243–223 eV region. Box in part (a): The dual Mo peaks highlight the presence of Mo on the catalyst surface.
The Mo addition to the  catalyst was also apparent in the CVs of
  and
and  in 0.5 M
  (Fig. 5c). Distinctive oxidative and reductive peaks are observed around 0.5 V vs RHE on the
  catalyst and indicate the presence of Mo species. This observation agrees well with the aforementioned XPS measurements and previously reported results.41 Furthermore, the
  catalyst immediately demonstrates improved stability compared to the as-received
  catalyst under acidic conditions. Over 100 cycles, the
  performance remains consistent with only marginal decreases in the Pt and Co oxide as well as Mo peaks, indicating minimal dissolution.
Effects of electrolyte flow rate
The performance of an acidic microfluidic  fuel cell operated with hot-pressed Pt electrodes, both anode and cathode, was investigated as a function of electrolyte flow rates (0.0, 0.3, 0.6, and 0.9 mL/min). Hydrogen and oxygen flow rates were 50 sccm each to ensure an adequate fuel and oxidant supply.33 As shown in Fig. 6a and 6b, the polarization curves suggest that cell performance is limited by the cathode and is weakly dependent on the electrolyte flow rate. In prior work, we described in detail performance variations as a function of flow rate in this microfluidic
  fuel cell, specifically with respect to water management at the cathode.33 At high current densities, performance improvements are observed when utilizing a flowing electrolyte compared to a stationary electrolyte because the dynamic stream facilitates water removal on the cathode. Individual electrode polarization curves confirm that any performance enhancements are due to improved water management at the cathode as the anode performance appears flow rate independent (Fig. 6b). Small enhancements are observed with increasing flow rate until 0.6 mL/min after which performance plateaus. At this point, the microfluidic configuration shifts from a mass-transfer limited regime, due to water removal from the cathode, to a kinetically limited regime, limited by ORR kinetics at the cathode. Cell peak power densities confirm an optimal electrolyte flow rate of 0.6 mL/min after which cell performance levels off (Fig. 6c). Furthermore, identical trends were observed with fuel cells operated with
  and
and  cathodes, confirming that in the current configuration, ORR kinetics may be observed without significant interference from mass-transfer limitations at an electrolyte flow rate
  . This flow rate dependence is also a function electrolyte concentration. Thus, while a flow rate of 0.6 mL/min is a transition point for 0.5 M
  , this transition point flow rate would be reduced for lower concentrations and be elevated for higher concentrations. Also, the effects of hot-pressing electrodes on transport processes within the GDE and consequent impact on the fuel cell performance are yet to be determined and will be addressed soon.
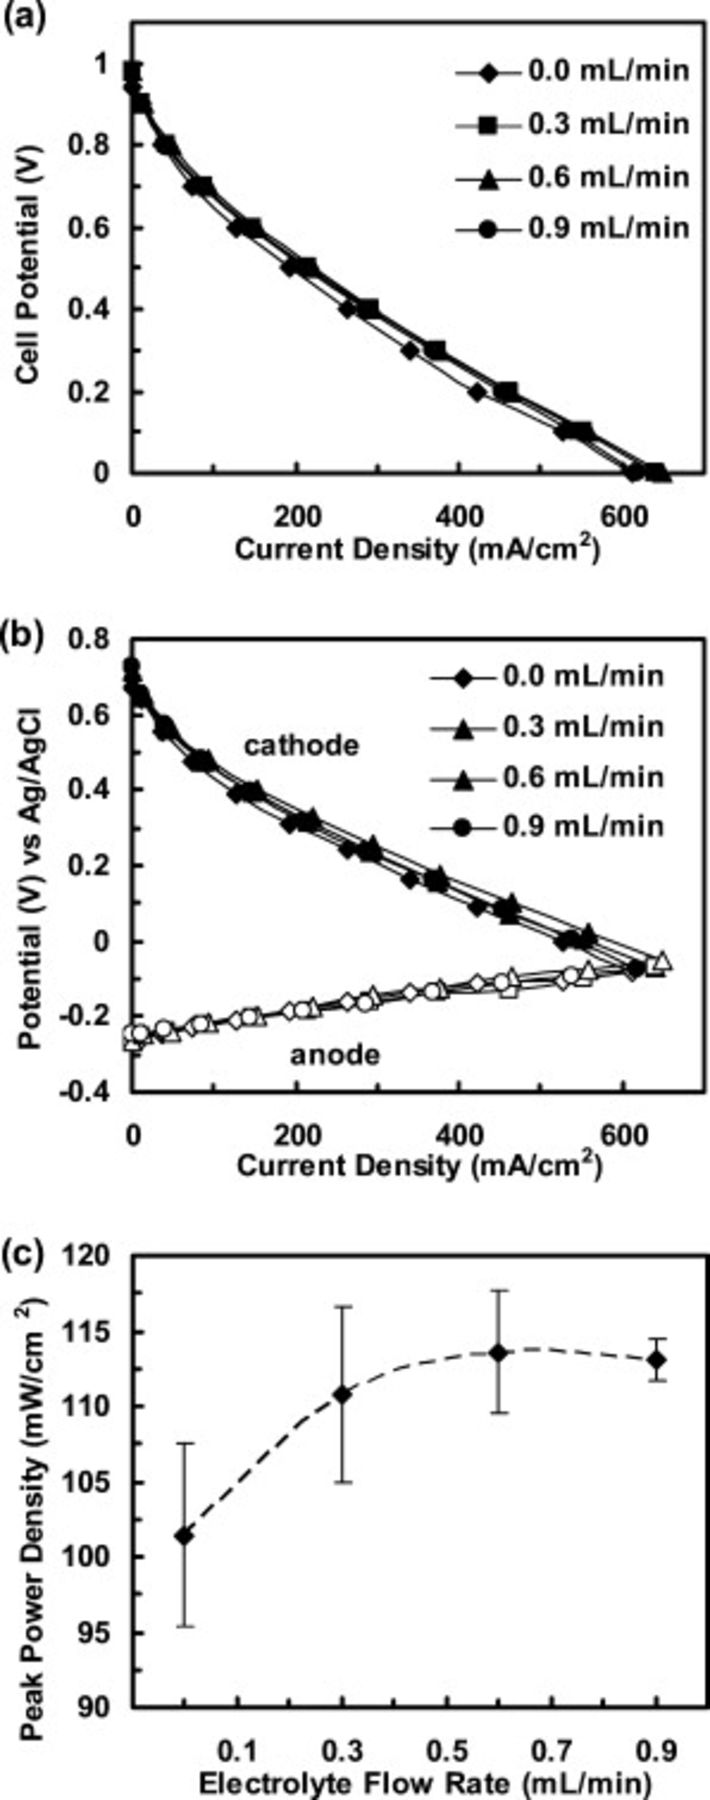
Figure 6. (a) Representative polarization curves for an acidic microfluidic  fuel cell as a function of electrolyte flow rate (0.0, 0.3, 0.6, and 0.9 mL/min). (b) Corresponding representative anode and cathode polarization curves. (c) Peak power density of the fuel cell as a function of electrolyte flow rate
  . Error bars represent a standard deviation from the average cell power density at each flow rate. In all studies, hydrogen and oxygen flow rates were 50 sccm each, electrode loadings were
  ,
,  was 0.5 M, and experiments were performed at room temperature.
Cathode characterization
Analyses of the four Pt-based cathodes were performed in a microfluidic  fuel cell with a flowing acidic electrolyte of varying
  concentrations. Figure 7a shows comparative polarization and power density curves for the fuel cell operated with each cathode, and all cathodes demonstrated good oxygen reduction activity and chemical stability. Fuel cells operated with either
  or
or  cathodes exhibited enhanced performance over those with either
  -at or Pt cathodes, and the performance shifts are due to changes in the oxygen reduction activity of the cathode catalysts (Fig. 7b). The core-shelled
  -at cathode demonstrates slightly greater ORR activity than the Pt cathode, suggesting that the electrocatalytic properties of the core-shell nanoparticle are very similar to pure Pt despite the 25% reduction in Pt content. The
  cathode exhibits slightly greater ORR activity than the
  cathode and significantly greater ORR activity than the Pt cathode, suggesting that the Mo addition did not adversely affect catalytic activity.

Figure 7. (a) Representative polarization and power density curves for an acidic microfluidic  fuel cell as a function of cathode catalyst (Pt,
  ,
,  -at, and
  ). (b) Corresponding representative anode and cathode polarization curves. In all studies, a Pt black anode was used, and all electrode loadings were
  . Furthermore, hydrogen and oxygen flow rates were 50 sccm each, electrolyte flow rate was 0.6 mL/min, [
 ] was 0.5 M, and experiments were performed at room temperature.
Further in situ studies were performed at varying  concentration from 0.25 to 3.0 M. The purpose of these studies is to analyze cathode performance and stability as a function of acid pH. The performance of the different cathodes is analyzed at peak power density
  to simulate the high current densities typically observed in working fuel cells. As evident in Fig. 7b, the anode polarization curves are identical from experiment to experiment; thus, changes in cell performance may be attributed exclusively to different cathodes. Thus, while varying electrolyte concentration impacts the fuel cell flow rate dependence, comparative analyses may be performed on different cathode materials. Acidic microfluidic
  fuel cells operated with
  or
or  cathodes significantly outperformed fuel cells operated with Pt or
  -at over the range of
  concentrations (Fig. 8). Subtle effects on the fuel cell performance due to changes in acid concentration for Pt and
  -at are shown in Fig. 8a, and those due to changes in acid concentration for
  and
and  are shown in Fig. 8b. At
  concentrations
  , cell performance was limited by the increased cell resistance associated with the low electrolyte conductivity at these concentrations. At
  concentrations
  , cell performance leveled out and slightly decreased as increased sulfate/bisulfate poisoning reduced the active catalytic surface area available for reaction.42, 43 Furthermore, when operating the fuel cell with either
  or
or  cathodes at high acid concentrations, when performance exceeds
  , enough water was produced that the transport processes become insufficient and the cathode flooded. For milder acidic conditions
  , the
, the  -at and Pt cathodes showed similar catalytic activities (Fig. 8a). At harsher conditions
  , the Pt cathode showed a slightly higher activity than the
  -at cathode, which may be due to a greater number of active sites on the Pt cathode surface compared to the number of sites available on the
  -at cathode surface. As shown in Fig, 8b,
  cathodes slightly outperform
  cathodes over the entire range of acidic conditions, suggesting that the Mo addition improves ORR activity. IR-correction analyses confirmed that all cathode performances were pH-independent for the pH range of 0.6 to −0.48 (0.25 to 3.0 M
  ).
).

Figure 8. Peak power densities of microfluidic  fuel cell operated with different cathodes, (a) Pt and
  -at and (b)
  and
and  , as a function of flowing
 . Error bars represent a standard deviation from the average cell power density at each
  . In all studies, a Pt anode was used, and all electrode loadings were
  . Furthermore, hydrogen and oxygen flow rates were 50 sccm each, electrolyte flow rate was 0.6 mL/min, and experiments were performed at room temperature.
Durability studies
To test the long-term durability of the catalysts studied, accelerated cathode aging studies were performed in a three-electrode electrochemical cell where the electrodes were cycled multiple times over a range of fuel cell operating potentials, 0.1–1.00 V vs RHE, in 0.5 M  . Potential cycling is a widely used technique in fuel cell durability studies, both ex situ (i.e., RDE and GDE) and in situ (i.e., PEM-based fuel cells), as potential cycling under acidic conditions has been shown to expedite catalyst and electrode degradation.3, 29–31, 44–52 First investigated by Kinoshita et al. , potential cycling reduces the electrochemical active surface area of catalytic particles via metal dissolution into the acid and growth of larger particles at the expense of smaller particles, analogous to Ostwald ripening.31, 45 Reduced catalyst surface area decreases absolute activity and lowers fuel cell performance. The rate and extent of electrochemical surface area losses depend on potential ranges and on cycle patterns (i.e., square waves vs cycles). Previous studies have shown, at potentials greater than 0.8 V vs RHE, increased dissolution rates, and, consequently, reduced catalyst and fuel cell performances are observed for the Pt and Pt–M alloy catalysts in both in situ and ex situ studies.31, 47–52
After each 1000-cycle set, cathode performance was investigated in an acidic microfluidic  fuel cell. Peak power densities for the fuel cell operated with each cathode studied as a function of cathode aging are shown in Fig. 9a. Over the course of the 10,000 cathode aging cycle, the peak performance of Pt,
  ,
,  -at, and
  decreased by 11.8, 33.2, 1.9, and 8.3%, respectively (Table II). Both modified cathode catalysts,
  -at and
  , demonstrated superior durability, compared to Pt and
  , in acidic environments under fuel cell operating potentials. Over the course of 10,000 cycles, the performance of the as-received
  activity reduces to that of the
  -at, which seems to indicate a complete loss of cobalt oxide species from the catalytic surface of the core-shelled particle. Despite a modest overall improvement in catalytic performance, the enhanced stability and reduced Pt content make the core-shelled
  a viable alternative to pure Pt as a fuel cell cathode catalyst.

Figure 9. (a) Peak power densities of acidic microfluidic  fuel cell operated with different cathodes (Pt,
  ,
,  -at, and
  ) as a function of electrochemical cathode aging, specifically potential sweep cycles. Nyquist plots of fuel cell performance with fresh (0 cycles) and aged (10,000 cycles) when using (b) a
  cathode or (c) a
  cathode. For fuel cell studies, a Pt anode was used and all electrode loadings were
  . Furthermore, hydrogen and oxygen flow rates were 50 sccm each, electrolyte flow rate was 0.6 mL/min,
  was 0.5 M, and experiments were performed at room temperature.
Table II. Peak power density losses in an acidic microfluidic  fuel cell as a function of cathode aging before and after 10,000 cycles. Accelerated aging studies performed in a three-electrode electrochemical cell in 0.5 M
  cycling between 0.10 and 1.00 V vs RHE at a 50 mV/s scan rate. For all studies, a fresh Pt black anode was used.
| Cathode catalyst | Peak power density | Decrease (%) | |
|---|---|---|---|
| 0 cycles | 10,000 cycles | ||
| Pt | 121.6 | 107.2 | 11.8 |
 | 176.0 | 117.6 | 33.2 |
 -at -at | 124.4 | 122.0 | 1.9 |
 | 177.6 | 162.8 | 8.3 |
The dramatically enhanced durability of the  cathode compared to that of the
  cathode is a very promising result. By performing EIS measurements on the acidic microfluidic
  fuel operated with fresh (0 cycles) or aged (10,000 cycles)
  and
and  cathodes, the root causes of the improved durability may be determined. Figure 9b and 9c shows the representative Nyquist plots of the fuel cell studies conducted with fresh and aged
  and
and  cathodes, respectively, at a cell potential of 0.4 V, the potential at which peak power densities were observed. For all experiments, the same fresh Pt anode was used; thus, comparative shifts in the impedance spectra can be attributed to the changes in the different cathode materials. The high frequency intercept on the
  -axis (initial data point closest to the origin in Fig. 9b and 9c) represents the cell resistance
  , which includes electrolyte solution resistance and any ohmic resistances in the fuel cell components (i.e., catalyst layer, gas diffusion layer, and current collectors).53 As the experimental setup and operating conditions are identical, the differences between the measured cell resistances and the calculated electrolyte solution resistance (
 in 0.5 M
  )54 can be attributed to the changes in cathode internal resistance, which varies as a function of electrochemical aging and the catalyst used. In general, as the
  increases due to greater electrode resistances, the electrode and overall fuel cell performance decrease. An increase in
  , as a function of aging, is observed for fuel cells operated with the
  cathode (Fig. 9b). No increase in
  is observed for fuel cells operated with the
  cathode (Fig. 9c). This increase in
  may be attributed to Co leaching from the unsupported
  nanoparticles under acidic fuel cell operating conditions, adversely affecting adhesion between the catalyst and gas diffusion layers, which increases contact resistances. These qualitative observations suggest that the Mo addition to the
  nanoparticles prevents leaching of Co species.
The two fuel cell electrode reactions, represented by the semicircular features in each Nyquist plot, can be described by two parallel  circuits with different time constants. Here,
  is a constant phase element capacitance describing the porous, distributed nature of the GDEs and
  is the overall fuel cell charge-transfer resistance represented by the diameter of the semicircle. In acidic media, hydrogen oxidation reaction kinetics are rapid and contribute minimally to the overall
  response.55 Thus, the sluggish cathodic ORR kinetics are the dominant contribution to the measured
  . An increase in
  , as a function of aging, is observed for fuel cells operated with the
  cathode (Fig. 9b). No increase in
  is observed for the fuel cells operated with the
  (Fig. 9c). This increase in
  can again be attributed to Co leaching for the unsupported
  nanoparticles, which reduces the ORR activity, thus lowering the cathode and overall fuel cell performance. These qualitative observations suggest that the
  retains a high ORR activity, despite electrochemical aging, by minimizing Co leaching from the Pt alloy.
To quantitatively analyze the trends shown in the representative Nyquist plots in Fig. 9b and 9c, all experiments were performed in triplicate to account for any cell-to-cell variations resulting from (i) differences in assembly/disassembly and (ii) differences in exact operating parameters due to the nature of the syringe pump used to drive the electrolyte flow. The critical  and
and  values as well as the total resistance
  , as shown in Table III, for fuel cells operated with fresh and aged
  and
and  cathodes. With the
  as the cathode, the measured
  increased from
  to
to  as a function of electrochemical aging. This corresponds to an increase in
  in the
  . In contrast, when using
  cathodes, the measured
  increased from
  to
to  due to aging. This negligible increase in
  in the
  confirms that the
  cathode structure does not degrade significantly over the course of the electrochemical aging.
Table III. Cell resistance  , charge-transfer resistance
  , and total resistance
  for microfluidic fuel cells operated with fresh (0 cycles) and aged (10,000 cycles)
  and
and  cathodes
  . In all studies, hydrogen and oxygen flow rates were 50 sccm each, electrolyte flow rate was 0.6 mL/min,
  was 0.5 M, and experiments were performed at room temperature. For all studies, a fresh Pt black anode was used.
| Cathode catalyst |
 ( ( ) ) |
 ( ( ) ) |
 ( ( ) ) | |
|---|---|---|---|---|
 | Fresh |
 |
 |
 |
| Aged |
 |
 |
 | |
| Difference |
 |
 |
 | |
 | Fresh |
 |
 |
 |
| Aged |
 |
 |
 | |
| Difference |
 |
 |
 | |
Furthermore, while operating the fuel cell with  cathodes, the measured
  increased from
  to
to  as a function of aging (Table III). This corresponds to an increase in
  in the
  . In contrast, when using the
  cathodes, the measured
  changed from
  to
to  as a function of aging. This negligible increase in
  in the
  confirms that the
  cathode activity does not reduce significantly over the course of the electrochemical aging. The quantitative observations suggest that
  cathodes outperform
  cathodes by minimizing transition-metal leaching for the catalyst surface. Also, the effects of Co leaching are twofold: (i) an increase in the internal electrode resistance and (ii) a decrease in the ORR activity. Consequently, the improved performance observed for the
  cathodes may be attributed to the dual effects of enhanced electrode and catalyst stability, but further work would be needed to confirm this.
Conclusions
Lack of low cost cathode catalysts with suitable activity and durability remains a key obstacle that hinders the widespread commercialization of fuel cell technologies. Pt–M alloys demonstrate enhanced oxygen reduction activity compared to Pt, but these alloys often exhibit insufficient stability under acidic fuel cell operating conditions. Here, the performance and durability of several Pt-based cathode catalysts were probed in a microfluidic  fuel cell with a flowing acidic electrolyte. An excellent catalyst/electrode characterization tool, this analytical platform enables detailed in situ investigations of the performance of individual components over a range of experimental conditions that are traditionally limited to a three-electrode electrochemical cell. Core-shell
  (
( -at) and Mo-modified
 catalysts were modified from a commercially available
  catalyst. The XPS measurements confirmed the successful modification of the catalyst surface composition for the catalysts studied.
In situ cathode studies were performed in an acidic fuel cell to determine the oxygen reduction activity and stability of the three  -based alloys, and their performance was compared to unsupported Pt, the current cathode catalyst of choice. The electrode analysis of hot-pressed GDE performance indicated that the dynamic electrolyte stream improved water removal at the cathode surface, but at flow rates
  fuel cell performance became kinetically limited by the ORR for the operation at 0.5 M
  . All the cathode catalysts (Pt,
  ,
,  -at, and
  ) studied exhibited good short-term chemical stability and electroactivity in an operating fuel cell at varying acid concentrations. Due to largely similar surface compositions,
  -at and Pt cathode performances were comparable. Under milder acidic conditions, the
  -at cathode slightly outperformed the Pt cathode, while under harsher conditions, the Pt cathode performance was superior. These observations may be due to the differences in the structure of the respective nanoparticle surfaces, such as the variation in the activity and in the number of catalytic sites. The
  cathode outperformed the
  cathode over the range of pH, indicating that the modification of
  with Mo indeed resulted in an improved ORR activity.
In accelerated durability studies, both the modified cathode catalysts,  -at and
  , demonstrate improved long-term stability compared to both Pt and
  . The
. The  -at cathode demonstrates a superior long-term stability, compared to all the other catalysts. Thus, despite modest overall performance improvements, various core-shell
  cathode catalysts represent a viable alternative to the commonly used Pt due to their reduced Pt content (lower costs) and enhanced durability. The dramatically enhanced durability of the
  catalyst with the Mo addition was further investigated via impedance analysis to reveal the source as dual improvements in catalytic stability and electrode durability.
While the development of core-shell Pt–M alloys is an area of intense ongoing investigation, to our knowledge Pt–Co–Mo alloys have not been used as ORR catalysts previously. Building on these promising results and drawing from reported Pd–Co–Mo and Pd–Mo alloy studies,35, 36 further development and optimization of catalyst modification procedures, e.g., through tailoring of Pt:M ratios, may lead to marked enhancement in oxygen reduction activity. Furthermore, adding capabilities to the microfluidic electrochemical platform would benefit catalyst/electrode performance and durability studies. For example, the integration of an in situ analyses of effluent electrolyte compositions facilitates a study of catalyst degradation patterns.
Acknowledgments
We gratefully acknowledge the financial support from the Department of Energy (grant DE-FG02005ER46260) and the National Science Foundation (grant NSF CHE06-51083 and career grant CTS 05-47617 for P.J.A.K.). F.R.B acknowledges support from the Graduate Engineering for Minorities (GEM) Fellowship. H.T.D acknowledges support from the Vietnam Education Foundation Fellowship. We thank Dr. Wei-Ping Zhou, Dr. Ranga Jayashree, Dr. Matt Rigsby, Matt Naughton and Jerrod Henderson for the stimulating discussions.
University of Illinois at Urbana-Champaign assisted in meeting the publication costs of this article.