
Abstract
In this paper we propose a mechanistic model describing the coupling between the polymer electrolyte fuel cell (PEFC) membrane electrodes assembly (MEA) electrocatalysis and the cathode carbon catalyst-support corrosion. The electrocatalysis description includes our previously introduced irreversible thermodynamics nanoscale models of the electrochemical reactions (hydrogen oxidation reaction/oxygen reduction reaction) coupled with the catalyst/ionomer interface double layer phenomena. Physically, the model describes the feedback between the instantaneous performance and the intrinsic cathode carbon oxidation process. It allows exploring the impact of the operating conditions (nominal current, reactant gas pressures, temperature, etc.) and the initial electrodes compositions (carbon and platinum loadings) on the PEFC MEA durability. Some numerical simulations show agreement with experimental knowledge already reported in literature, in particular, when the anode chamber is partially exposed to oxygen (induced by polymer electrolyte membrane crossover or fuel starvation), cathode thickness decrease and cell potential decay are predicted. Furthermore, we found that cathode damage increases as platinum loading increases and as platinum nanoparticles size decreases. Moreover, carbon corrosion favors the platinum coarsening; competition between carbon oxidation reaction and electrocatalytic mechanisms is investigated. Simulations also suggest that an "optimal" external load current inducing a "maximal" durability exists. The sensitivities of the electrochemical impedance spectra to the operating conditions and simulated operation time are also provided.
Export citation and abstract BibTeX RIS
In order to reach large-scale development and commercialization of low-temperature polymer electrolyte fuel cells (PEFCs), it seems crucial to elucidate membrane electrodes assembly (MEA) degradation mechanisms to help improve both PEFC electrochemical performance and durability and reduce manufacturing cost. Under realistic operation conditions, severe MEA nano-microstructural deterioration is observed inducing the cell voltage degradation.1, 2 In particular, electrode platinum/carbon  damages are attributed to several coupled physicochemical phenomena, such as the oxidation/dissolution of the platinum, the transport of dissolved platinum in the Nafion phase, platinum coarsening, and Nafion degradation.3–7
In order to decrease the total Pt-based PEFC efficiency lost due to the high thermodynamic overpotential of the oxygen reduction reaction (ORR), current PEFC cathode electrodes achieve uniform and highly dispersed Pt loadings [high-surface-area Pt particles  ] by using high-surface-area
  carbon supports [carbon black (CB) with a high degree of graphitic character, such as Vulcan XC-72, Black Pearls BP 2000, etc.]. These CB supports consist mostly of near-spherical particles of
  diam, that aggregate forming agglomerates of
  diam.8
It is largely recognized that CB corrosion also has a major impact on MEA performance degradation. CB supports are thermodynamically unstable at typical cathode operating conditions [the equilibrium Butler–Volmer potential for carbon oxidation to carbon dioxide is a  vs reference hydrogen electrode (RHE) at
  9]. Despite that carbon corrosion reaction reveals to be quite slow at common PEFC operating temperatures
  with a steady nonzero current demand, severe CB structure damage has been observed after a PEFC power-cycled and start-up/shutdown operation representative of automotive applications.10–16 In-line direct gas mass spectroscopy analysis successfully detected intermittent peaks of carbon dioxide emission in exhausted gas from the cathode, indicating that carbon corrosion occurs during load cycle in the PEFC.17–19
Several experimental studies implied that this degradation is due to the presence of oxygen  in the anode. Reiser et al.15 have used two different experimental setups exacerbating the cathode carbon corrosion phenomena: (i) two single cells electrically connected in parallel, where the electrodes of one of the cells were exposed to stagnant air and (ii) a single cell with two segmented gas flows on the anode, where in one of them oxygen flow was introduced.
In both experimental setups, the authors show that the presence of the oxygen in the anode induces a reverse current between the electrodes increasing the cathode carbon oxidation, which manifests as a significant decrease in the thickness of the cathode and cell performance. In contrast, the anode thickness appeared to be unchanged.
A similar parallel cell setup has been used by Tang et al.11 highlighting the dramatic catalyst active surface area loss induced by this cathode carbon corrosion phenomenon. According to the same authors, after the shutdown operation, if the anode exhaust port is not closed, air can gradually diffuse into the anode side, creating an oxygen/hydrogen boundary. It is also believed that maldistribution or anode local interruption of hydrogen supply (the so-called fuel starvation phenomenon) improves oxygen permeation from the cathode into the anode.20
According to Fuller and Gray,21 as well as Darling and Jayne,22 formation of liquid water drops in the anodic channel could also locally block the hydrogen access to the electrode. The corrosion problems of CB in PEFCs have stimulated enormous interest in looking for alternative catalyst supports, such as carbon nanotubes (CNTs).23 In particular, a multiwalled CNT was found to improve corrosion resistance in acidic liquid electrolytes over Vulcan XC-72.24
Many ex situ experiments have been carried out in order to elucidate the kinetics and the mechanisms that control the carbon catalyst-support oxidation in acidic media. However, this process remains poorly understood, maybe due to the complex surface structure of carbon supports that could present pollutants or surface oxides (such as phenols, quinones, lactones, carboxylic acids, etc.), generated by the CB fabrication methods.9, 25–28 It is assumed that the oxidation mechanism in acidic media occurs through the two-step mechanism


where  is an oxidation intermediate specie.
It is believed that supported platinum catalyzes (accelerates) this carbon oxidation reaction (COR). Ex situ potentiostatic hold tests ( vs RHE applied) have been carried out by Ball et al. in order to study the carbon and platinum stability.9 The authors showed that at
  the percentage of carbon corroded increases with its specific surface area and that increasing the temperature increases the carbon surface oxidation. Moreover, the carbon is oxidized at lower potentials in the presence of platinum, and the higher the mass fraction of platinum is, the higher the production rate of
  is.
is.
Furthermore, following the experiments carried out by Stevens et al. ,29 both the decrease of the platinum nanoparticle size and the increase of the carbon initial surface area led to the increase of the carbon corrosion. The authors also showed that carbon degradation increases as the humidity of the electrochemical environment increases. Additionally, according to Roen et al. , carbon corrosion is found to increase by increasing the supported platinum loading.30
In PEFC environments, COR mechanism could be strongly affected by the presence of ionomer, solvent (water in both gas and liquid phases), and catalyst, which can modify the carbon stability properties. Maass et al. have recently reported experiments accounting for the PEFC environment: carbon corrosion rates were found to be higher under dynamic operation and to strongly depend on electrode history.31 The authors highlight the complexity of the COR in the PEFC environments and the necessity of the development of mathematical models to provide more insight. Furthermore, in an operating PEFC, carbon catalyst-support oxidation is expected to be strongly coupled with other aging mechanisms: interpretation of the experimental observations becomes difficult, and thus, analysis through mathematical modeling becomes crucial.
Different modeling approaches allowing simulating PEFC performances have been developed during the last  .32, 33 However, at present, too little modeling work addressing PEFC degradation has been reported.
Reiser et al. have proposed a one-dimensional static model devoted to the calculation of the PEFC electrode/electrolyte electropotential profiles when the anode is partially exposed to air, in order to define the conditions that could be favorable for the cathode carbon oxidation.15 By using a numerical finite element method, the authors solve a Poisson equation coupled with a conservation equation of the electric charges and a classic Bulter–Volmer description of the global hydrogen oxidation reaction (HOR) and ORR.
A similar model has been recently proposed by Meyers and Darling.34 The model describes how a maldistribution of hydrogen across the fuel electrode can induce both oxygen permeation from the cathode to the anode and cathode carbon corrosion in the fuel starved region. Implications of this reverse current mechanism are explored by simulating a cell with a nonuniform distribution of hydrogen along the fuel channel in both steady-state and transient operation. The mathematical model is a one-dimensional (1D) representation taking into account the reactants transported in the channels and the Bulter–Volmer equations.
Fuller and Gray21 proposed a two-dimensional extension of these models to calculate the electric-potential profile under conditions of partial hydrogen coverage in the anode. Computational fluid dynamics model versions describing carbon corrosion in a PEFC has been also recently proposed.35
One common feature of these models is that they describe which operating conditions affect carbon corrosion but do not describe the impact of carbon corrosion on instantaneous performance (any prediction of the transient behavior of the PEFC MEA, such as cell potential degradation, is provided). The instantaneous feedback between performance and aging is not taken into account. Furthermore, the role of the catalyst in the carbon corrosion is not explored (platinum and carbon are treated as a unique single phase). These models do not predict the impact of the initial catalyst and carbon loadings on the PEFC durability.
Another common feature is that electrochemistry is described statically: electrochemical reactions are described globally, and the coupling between them and the double-layer phenomena is not taken into account.
In an attempt to provide an engineering tool to suggest guidelines for improving PEFC performance and durability, in this paper we propose a mechanistic model of carbon catalyst-support corrosion in PEFC environments, including detailed electrochemistry and an explicit description of the instantaneous feedback between performance and the aging carbon catalyst-support process (Fig. 1). The model is suitable for integration in a more global multiscale MEA model and is developed on the basis of an irreversible thermodynamics approach of PEFC electrochemistry previously proposed by us.5–7, 36–40 The work here compliments our recently proposed transient mechanistic model of platinum oxidation-dissolution-electrochemical ripening in the PEFC cathode.5–7

Figure 1. Principles behind the standard modeling approach and our modeling approach of aging mechanisms in PEFC environments.
In this paper, we investigate the cumulative effect of the partial exposure of the anode catalyst to oxygen on the transient PEFC performance. The aim here is to provide some insight into the competition between the platinum interface reactions and the cathodic carbon oxidation.
This paper is organized as follows. In the next section, we present the main physical assumptions of our model. Global mathematical structure is also discussed. In the HOR and ORR section, we describe the catalyst anode and cathode models. In the COR section, the cathode carbon oxidation model is provided, followed by a section on membrane models. Then, we discuss some numerical simulation experiments [static operating conditions and dynamic simulation of electrochemical impedance spectra (EIS)], focusing on the sensitivity of the simulated cell response to the nominal current, temperature, pressure, platinum and carbon loading, and PEFC operation time. Finally, we conclude and propose some future work directions in order to improve our model.
Main Assumptions
Global physicochemical hypothesis
Water transfer phenomenon is a mandatory issue that has been addressed in several low-temperature PEFC models.41 As a first approximation in our model, we consider the case of an isothermal fuel cell fed with pure oxygen and hydrogen fully saturated with water vapor (to be in agreement with experiments now occurring in our group). In particular, we assume that the polymer electrolyte membrane (PEM) and electrodes are already fully humidified at the simulated operation time  (PEFC starting operation time). In these conditions, it is not necessary to take into account the transient pore phase flooding by liquid water in the electrode:36, 37 in fact, chemical potential of water becomes the same in pore and ionomer phases, inducing equilibrium conditions and thus no transients. The additional water production in the cathode is assumed to be evacuated through the liquid phase with zero thermodynamic resistance (no chemical potential gradient). These comments are extensive to water description in the gas diffusion layer (GDL). Pressure drop is supposed to be negligible in the GDL and the pore phase, and the additional water production is assumed to be evacuated through the liquid phase.
As we consider pure feeding gases (no nitrogen), hydrogen and oxygen pressure drops in the pore phases are neglected.34 Produced  pressure is regarded to be negligible [there is no accumulation of
  in the cathode; the
  diffuse through the GDL, and is evacuated by the channels (cf. COR section)].
In this first step model, oxygen crossover transients are not taken into account. The anodic carbon oxidation and the oxidation-dissolution-electrochemical ripening of Pt nanoparticles are not considered here.
Global model organization
Our global model organization is presented in Fig. 2. The model consists of four interacting parts: the anode region operating with hydrogen (anode 1), the anode region exposed to oxygen (anode 2), the cathode Pt/ionomer interface (cathode 1), and the cathode C/interface (cathode 2). The couple anode 1/cathode 1 constitutes the direct fuel cell, and the couple anode 2/cathode 2, the reverse one.
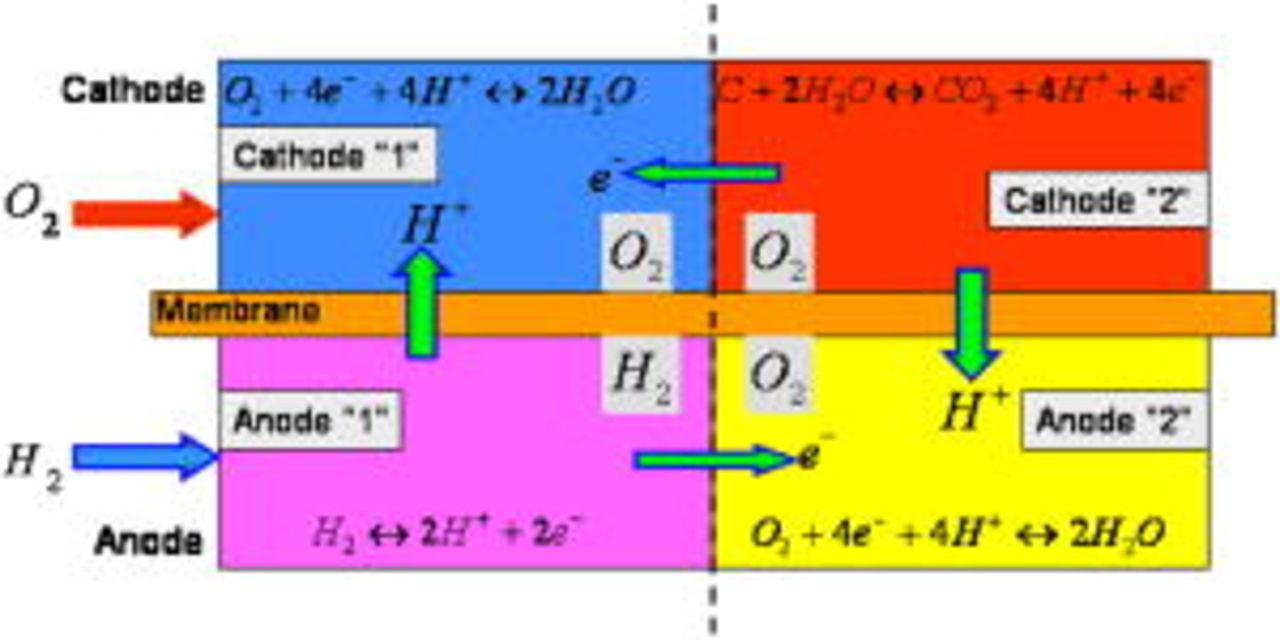
Figure 2. Model organization.
In cathode 1, only the ORR is assumed to occur. In cathode 2, the COR is the only electrochemical reaction taking place. These two electrode models interact, e.g., as in the description of the platinum coarsening in cathode 1 driven by the carbon degradation occurring in cathode 2 (see COR section).
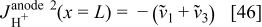
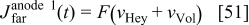
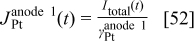
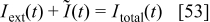
In the anode, we account for two different electrochemical reactions: the HOR and the ORR. As shown in Fig. 2, electrons produced by the COR (reverse current  ) in cathode 2, are consumed by the ORR in cathode 1; the protons produced are consumed by the ORR occurring in anode 2 (this favors the COR in cathode 2). Then, the total current entering in the cathodic platinum phase is the addition of the external load current and the reverse current.
The cathodic electrostatic potential  is assumed to be the same for platinum and carbon phases (i.e., the same for both cathodes). The anodic electrostatic potential
  is assumed to be the same for the two anodes (excellent electronic conductivity is assumed between the two anode regions).
Modeled electrode morphology
The electrode morphology adopted here is similar to that previously introduced in Ref. 37: carbon agglomerate networks (and supported Pt) are assumed to be embedded in a hydrated ionomer medium (the so-called impregnated Nafion phase in our previous papers) (Fig. 3). These structures also include nano/micropores, allowing the reactant gas transport. Obviously, this is a simplistic representation of the high-level complexity of the electrode morphology. However, it allows one to capture the elementary processes taking place in the MEA and to describe, on a physical basis, the coupling between them.
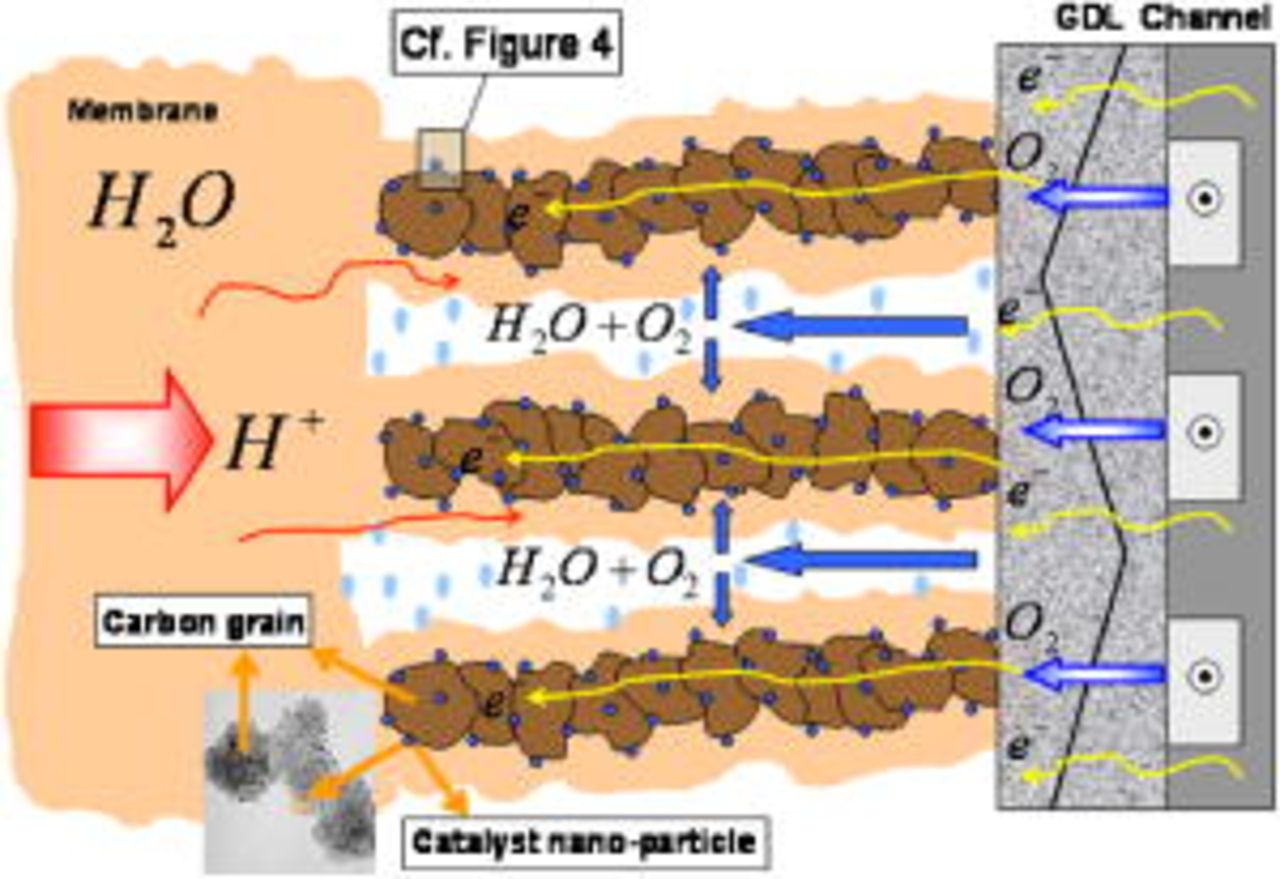
Figure 3. Cathode microscale models.
Within a continuum framework, each electrode submodel is designed to describe coupled physicochemical phenomena taking place at different geometrical scales: a microscale transport phenomena description of reactants  and charges (protons and electrons) through the electrodes and the membrane thickness, and a spatially distributed microscale model of the reactant diffusion through the hydrated Nafion ionomer layer covering the
  networks, are coupled to a 1D nanoscale mechanistic description of the catalyst-electrolyte interface (anodes 1 and 2, cathode 1) and of the carbon-electrolyte interface (cathode 2) (Fig. 4).
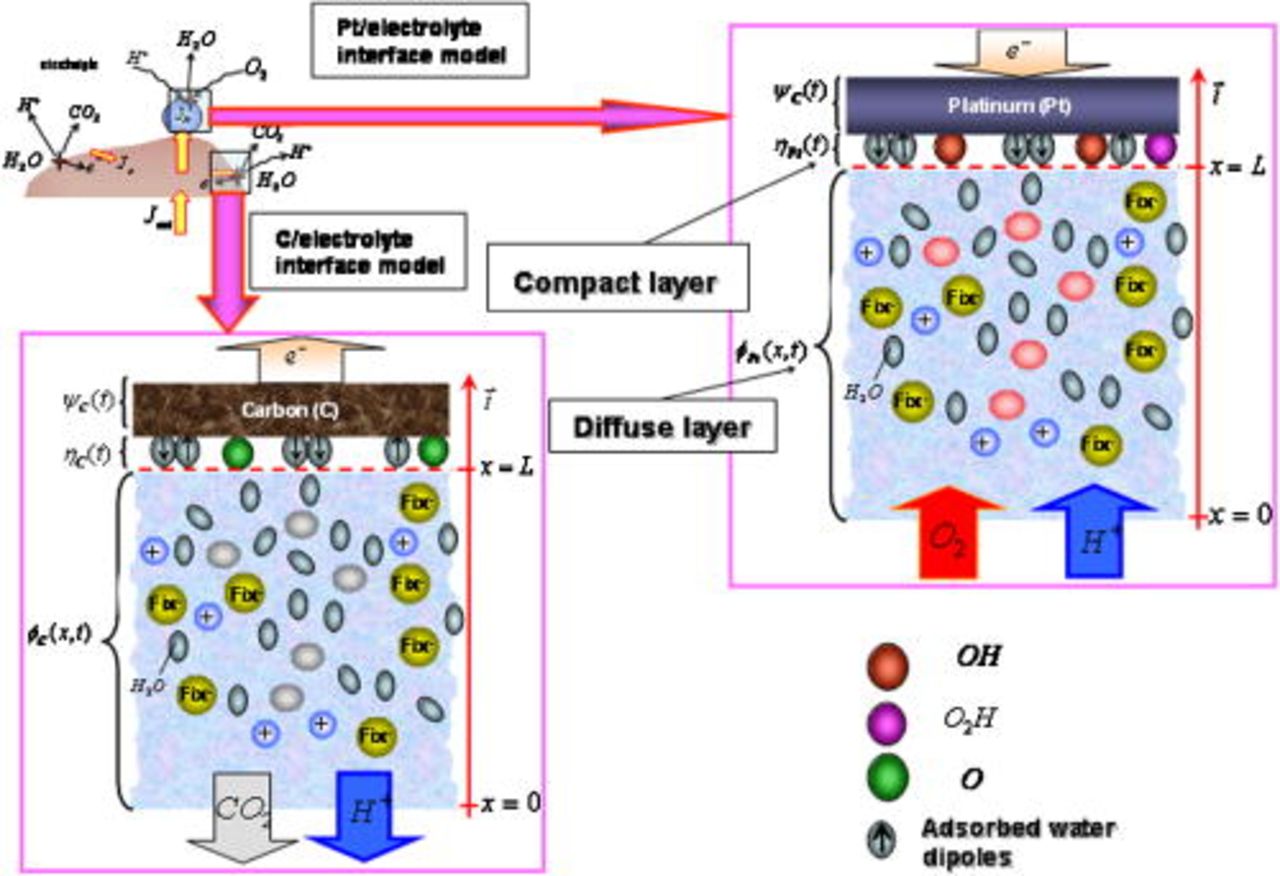
Figure 4. Cathode nanoscale models.
The nanoscale models in anodes 1 and 2 and cathode 1 are similar to those introduced in our previous papers:5, 36–38 they consist of a compact layer submodel describing the competitive adsorption of the intermediate reaction species and the parasite water molecules on the catalyst surface, and of a diffuse layer submodel in the electrolyte, constituted of protons and spatially fixed counterions (sulfonate sites). The nanoscale model of the C/ionomer interface (cathode 2) is also shown in Fig. 4. Because of the highly complex nature of the C interface, we account here only for the inner layer describing the competitive adsorption of C oxides and water molecules (see COR section).
We note  as the microscale coordinate in the thickness of the impregnated Nafion layer. The interfacial nanoscale model is located at the microscale point
  , and the nanoscale coordinate inside the diffuse layers of some nanometers thickness is noted by
  . The Nafion/Pt and Nafion/C interfaces are supposed to be flat and located at
  .
.
Adopted cathodic carbon structure
In order to simulate the temporal evolution of the cathode thickness (cf. COR section), we account for high carbon surface area/volume ratio by representing the carbon phase as a two-dimensional Sierpinski's carpet projected in the cathode thickness direction (Fig. 5).

Figure 5. Modeled cathode carbon phase morphology.
The total volume occupied by carbon  is given by
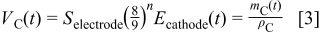
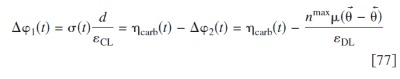
where  is the Sierpinski's fractal order,
  the electrode geometrical area,
  the (time-dependent) cathode thickness,
  the carbon density, and
  the instantaneous carbon mass constituting the cathode.
The internal total carbon surface area  is
is

By assuming an initial cathodic carbon mass  ,
,  , [an initial cathode thickness
  (cf. Tables I and II)] and using Eq. 3, the fractal order is
  ; this value is adopted for the calculations presented in this paper. By using Eq. 4 with these parameter values, the specific carbon surface area in the cathode is
  , in quantitative agreement with experimental measurements.9 Equation 3 also implies that if we increase the initial carbon mass, the initial cathode thickness
  is increased.
HOR and ORR: Anodes 1 and 2 and Cathode 1 Models
These models are similar to those already introduced in our previous papers. We underline here how they couple with the cathode 2 model discussed in the COR section.
Microscale mechanisms
In the anode pore phase, the hydrogen and oxygen partial pressures ( ,
,  ) are assumed to obey
where  is the water saturation pressure (cf. Table I). In a first approximation, we assume a linear relation between anode hydrogen and oxygen partial pressures and total anode pressure, according to

where  is a dimensionless constant comprised between 0 and 1 (cf. Table II).
Table I. Parameters values used in the numerical simulations.
| Geometrical or physicochemical parameter value | Unit | References | |
|---|---|---|---|
| Anode |

|

| Estimated |
| Cathode 1 |

|

| Estimated |
| Cathode 2 |

|

| Estimated |
| Cathode 2 |

|

| Estimated and 9 |
| Cathode 1 |
|

| Estimated |

| m | Measured | |

| m | Estimated 5–7, 36–40 | |

| m | Measured | |

| m | Measured | |

| m | Measured | |

|

| Measured | |
| m | 5–7, 36–40 | |

| m | Calculated 5 | |

| — | Calculated (Eq. 4) | |

|

| 36–38 | |
| Anode 1 |

| Fitted | |
| Anode 2 |

| — | Fitted |
| Cathode 1 |
| — | Fitted |
| Cathode 2 |
 
| — | Fitted |
| Anode 1 |
 
|

| This work and 5–7, 36–40 |
 
| |||
 
|

| This work and 5–7, 36–40 | |
| Anode 2 |

|

| Fitted |

|

| Fitted | |
 
| |||

| |||

|

| Fitted | |
| Cathode 1 |

|

| This work and 5–7, 36–40 |
   
|

| Fitted | |

|

| Fitted | |
| Cathode 2 |

|

| Fitted |

| |||
|

| Fitted | |

|

| Fitted | |

|

| Fitted | |
| |||

|

| Fitted | |
|

| Fitted | |
 
|

| Fitted | |
| |||

|

| 5 | |
|

| 36, 37 | |
 (the same value in both electrodes) (the same value in both electrodes) |

| 36, 37 | |
 (the same value in both electrodes) (the same value in both electrodes) |

| 5–7, 36, 37 | |

| — | 53 | |

|

| 5, 37 | |

|

| 5, 37 | |

|

| 5, 37 | |
|

| 50 | |

|

| Assumed | |
|

| Assumed | |

|

| 36 | |
|

| 36 | |

|

| 36 | |

| Pa | 5–7, 36–40 | |
|

| 38 | |

|

| 5 | |

|

| 53 | |

| Assumed | ||

| Ω | Assumed |
Table II. Default parameters and operating conditions used for the simulations.
| Default operating parameter value | |
|---|---|

| |

| |

| |
| |
| |

| |

| |

| |

| |
| |

| |

| |

| |

|
The anodic platinum surface area  is assumed to be partially exposed to oxygen. The platinum surface area
  exposed to hydrogen is given by
where  is a coefficient comprised between 0 and 1 (cf. Table II). The platinum surface area
  exposed to oxygen is given by

In the cathode pore phase, the oxygen partial pressure  is assumed to obey
In the impregnated Nafion layers hydrogen and oxygen transport is assumed to be governed by diffusion36, 37

where  and
and  are, respectively, the concentration and the diffusion coefficient of the hydrogen (anode 1) and oxygen (anode 2 and cathode 1).
By assuming equilibrated absorption of  and
and  in hydrated Nafion, we have at
  (Henry's laws)36, 37

where  and
and  are the Henry's coefficients given in Table I.
The fluxes  are given by the kinetics at the compact layer level, as described in the following section.
Nanoscale mechanisms
The nanoscale models describe the interfacial electrochemical phenomena taking place in anodes 1 and 2 as well as in cathode 2 (cf. Fig. 5). According to our approach,5–7, 36–40 in the compact layer we have

where  is the catalyst surface coverage by the free sites,
  is the surface coverage by the reaction intermediates, and
  and θ⃖ the surface coverage by parasite adsorbed water molecules with dipolar moment opposed (up) and directed (down) to the platinum layer. Note that all the coverages are defined at the compact layer level: a simple physically based description of the electrochemical interface is provided, taking into account the coupling between the double layer structure and the electrochemical reactions.
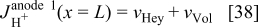
In anode 1, we describe the HOR according to the Tafel–Heyrovsky–Volmer reaction model38


In anode 2 and cathode 1, for the ORR description, we assume the mechanism5, 36, 42


The rates of these elementary steps can be written for the HOR as38


and for the ORR in cathode 15, 37


and, respectively,  ,
,  , and
, and  for the ORR in anode 2 with kinetic parameter values being not necessarily the same as in Eq. 24, 25, 26.
In the previous kinetic equations,  is the hydrogen concentration at
  ,
,  the oxygen concentration in cathode 1 or in anode 2,
  the proton concentration, and
  ,
,  and
and  are the surface coverages by adsorbed intermediates.
  ,
,  denotes the electronic transfer factors,
  are the standard rate constants, and
  is the electrostatic potential drop through the compact layer, defined as36, 38

where  is the electrostatic potential in the catalyst phase and
  is the electrostatic potential in the Nafion phase just outside the water layer adsorbed on the catalyst with charge surface density
  .
.  is given by

where  is the electrostatic potential drop related to the thickness of the adsorbed water layer,
  is the potential drop related to the dipolar nature of these molecules, where
  is the "effective thickness" of the compact layer (e.g., this layer could consist of several water layers),
  ,
,  is the electric permittivity of the compact layer, and
  is the electric permittivity of the diffuse layer. We have demonstrated that
  in Eq. 28 is given by the solution of the transcendental equation38

The value of  (anode 1) and the values of
  and
and  (anode 2 and cathode 2) are given by the solution of the balance equations


For the surface coverage by dipoles directed toward the electrode, we have5, 37, 38
and for the opposed ones, we have


The diffuse layer models describe the proton diffusion/electromigration transport (in the nanometric neighborhood of the  particles), coupled with the electric field generated by the resulting charge distribution. All species are considered as punctual, and the interparticle electrical interaction and water solvatation are neglected. The proton-driving equations are given by

and the electrostatic potential in the diffuse layer by the Poisson's equation as
where  is the electrical potential in the electrolyte phase, and
  the concentration of the spatially immobile anions modelling the Nafion sulfonate sites.38
For the anode 1 diffuse layer model, the boundary conditions are given by


where  is obtained as explained in the following section. This diffuse layer model allows calculating
  and
and  . Following the procedure described in Ref. 36–40, the combination of Eq. 27, 28, 29 gives
  , the electrostatic potential in the anode
  phase.
For the cathode 1 ORR, we have


Again, in cathode 1, this diffuse layer model allows calculating  and
and  . The combination of Eq. 27, 28, 29 gives
  , the electrostatic potential in the cathode Pt and C phases.
For the anode 2 ORR, we write


The anode 2 diffuse layer model allows calculating  for kinetics Eq. 24, 26, as well as
  as described in the section on membrane models.
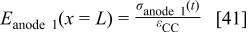
The charge density  is calculated by the conservation law at the catalyst/electrolyte interface surface5, 36–38 as

for anode 1 where
where  is given by Eq. 8 and
  by
by
where  is the external load current (the input of the model), and
  is the reverse current produced by the carbon oxidation (cf. next section).
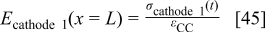
For cathode 1, we have

where


where  is the surface of the platinum interface in cathode 1 (cf. next section).
Finally, for the anode 2 ORR, we have

where
with  given by Eq. 9.
The boundary conditions to coupling with the microscale transport description of the reactants (Eq. 11) in the impregnated Nafion are

for anode 1 and
for cathode 1 (anode 2).
On the basis of Eq. 27, 28, the anode 1 and cathode 1 nanoscale models calculate the electrostatic potential in the Pt phase  for both electrodes; thus, the cell potential is given by
  .
.
Carbon Oxidation Reaction: The Cathode 2 Model
The cathode 2 model describes the COR mechanism taking place on the carbon catalyst support surface area represented by the fractal geometry (cf. Fig. 5). The model also describes the temporal evolution of the cathode thickness, as well as the COR-driven Pt coarsening and the augmentation of the GDL/cathode contact resistance.
Mechanisms
In an analogous way to anode 1 and cathode 1, here we introduce a compact layer model describing the carbon oxidation mechanism (cf. Fig. 4). In a first approximation, the carbon oxidation is modeled by the two-step mechanism in Eq. 1, 2 with an O intermediate specie. In this compact layer, we have the global equation

The reaction rates are, respectively, for  and
and 


where  are the standard rate parameters (cf. Table I),
  is the proton concentration [supposed to be the same as in the bulk
  ],
],  is the
  concentration in the cathode, and
  is the surface coverage by the absorbed monoatomic oxygen on the carbon interface surface given by the solution of the balance equation

In Eq. 63,  is the carbon pure phase activity,and is given by43
with  the initial carbon mass in the cathode and
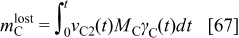
  the cumulated lost carbon mass given by
where  is the carbon molar mass.
The concentration of  in the cathode is given by the balance equation
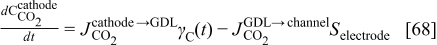
where  is the
  molar flux from the cathode to the GDL, given by
 is the
  molar flux from the GDL to the cathode chamber (channel), given by

where  is the diffusion coefficient of
  into the GDL. As it shows in Fig. 6, expression 70 can be written as

where  is the
  concentration in the cathodic chamber given by

where  and
and  are, respectively, the inlet and outlet gas flow in the cathode channel,
  is the
  concentration in the oxygen inlet flow gas,
  the
the  concentration in the channel, and
  the cathode channel thickness.
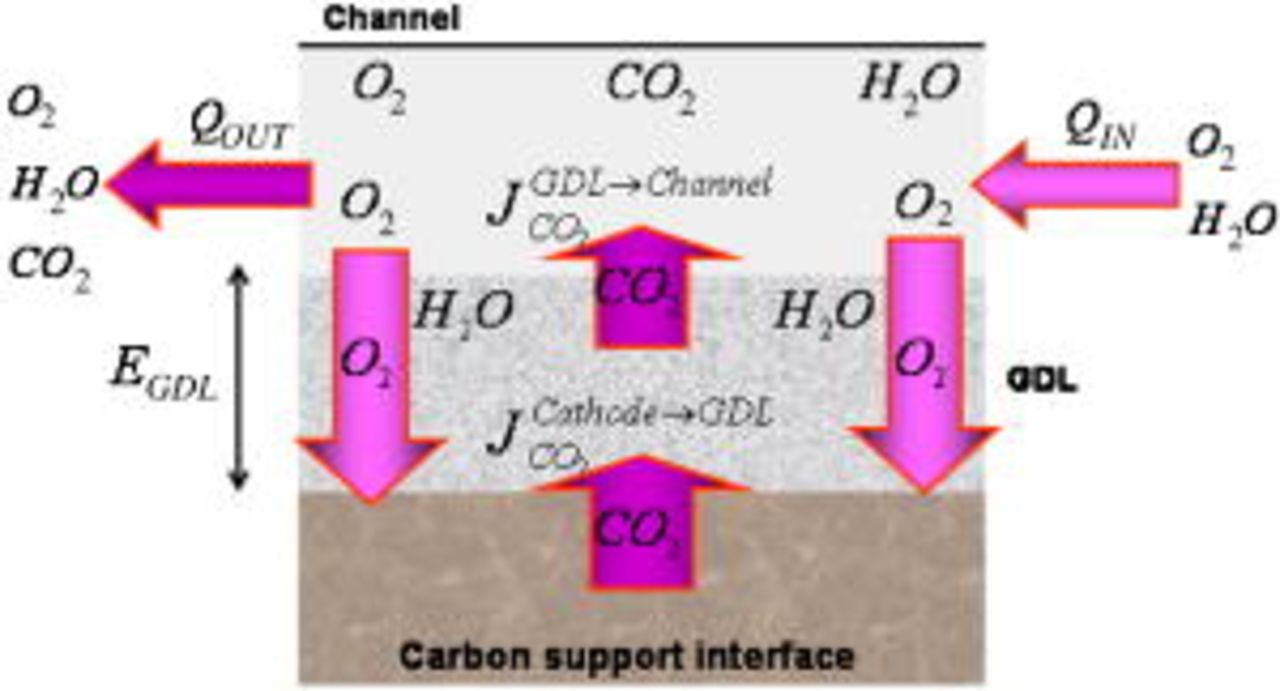
Figure 6. Carbon dioxide transfers through the cathode GDL and chamber.
The C/electrolyte interfacial potential in Eq. 63, 64 is given by

where the electrostatic potential in the carbon phase is known [ is assumed], and the electrostatic potential at the compact layer level is assumed to be the same as in the bulk [
 , calculated as explained later, in the section on membrane models]. The current produced by the COR is

which constitutes the input for Eq. 53, 59.
The different coverages are


with the same transcendental equation calculating  as in the other electrodes (cf. Eq. 29), with
  provided by the solution of
COR induced degradation mechanisms
In our model, we assume three phenomena to be directly linked with the COR: the decrease of the cathode electrode thickness  , the decrease of the platinum surface area of the cathode
  , and the increase of the cathode/GDL contact resistance
  .
.
Cathode thickness temporal evolution
From Eq. 3, we derive a linear relation between the cathode thickness  and the lost carbon mass

The total cathode carbon surface area  decreases following Eq. 4.
COR-driven platinum coarsening
Under operating PEFC conditions, the platinum oxidation/dissolution,5–7 the electrochemical Ostwald's ripening,5–7 and the platinum coarsening driven by the COR cathode degradation,3 contribute to decrease the platinum surface area.
In the model in this paper, we take into account only the platinum coarsening (the two other mechanisms being already implemented in our previous model5–7). This mechanism is assumed to be driven by the decrease of the cathode thickness: when the carbon support degrades, the platinum nanoparticles coarsening is favored and they can detach from the carbon support becoming useless.44–46 Both processes contribute to the active surface area decrease (Fig. 7).

Figure 7. Cathodic COR-driven Pt coarsening mechanism.
In a first approximation, we assume the mathematical relation for the platinum surface area of cathode 1 
where β is a dimensionless positive constant,  the initial thickness of the cathode electrode, and
  is the initial surface area of platinum in cathode 1 given by
where  is the platinum total mass in the cathode,
  is the radius of the platinum nanoparticles (spherical representation),and
  is the platinum density.
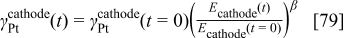
Time-dependent contact resistance
 denotes the time-dependent contact resistance between the cathode electrode and the GDL (Fig. 8). When the cathode is not damaged (no carbon degradation), we assume to have
  , and the electrostatic potential in the electrode carbon phase
  and the one on the current collector
  are the same. However, when the carbon layer is damaged, the electric connectivity among the electrode, the GDL, and the current collector is degraded and then
  increases.15, 47, 48
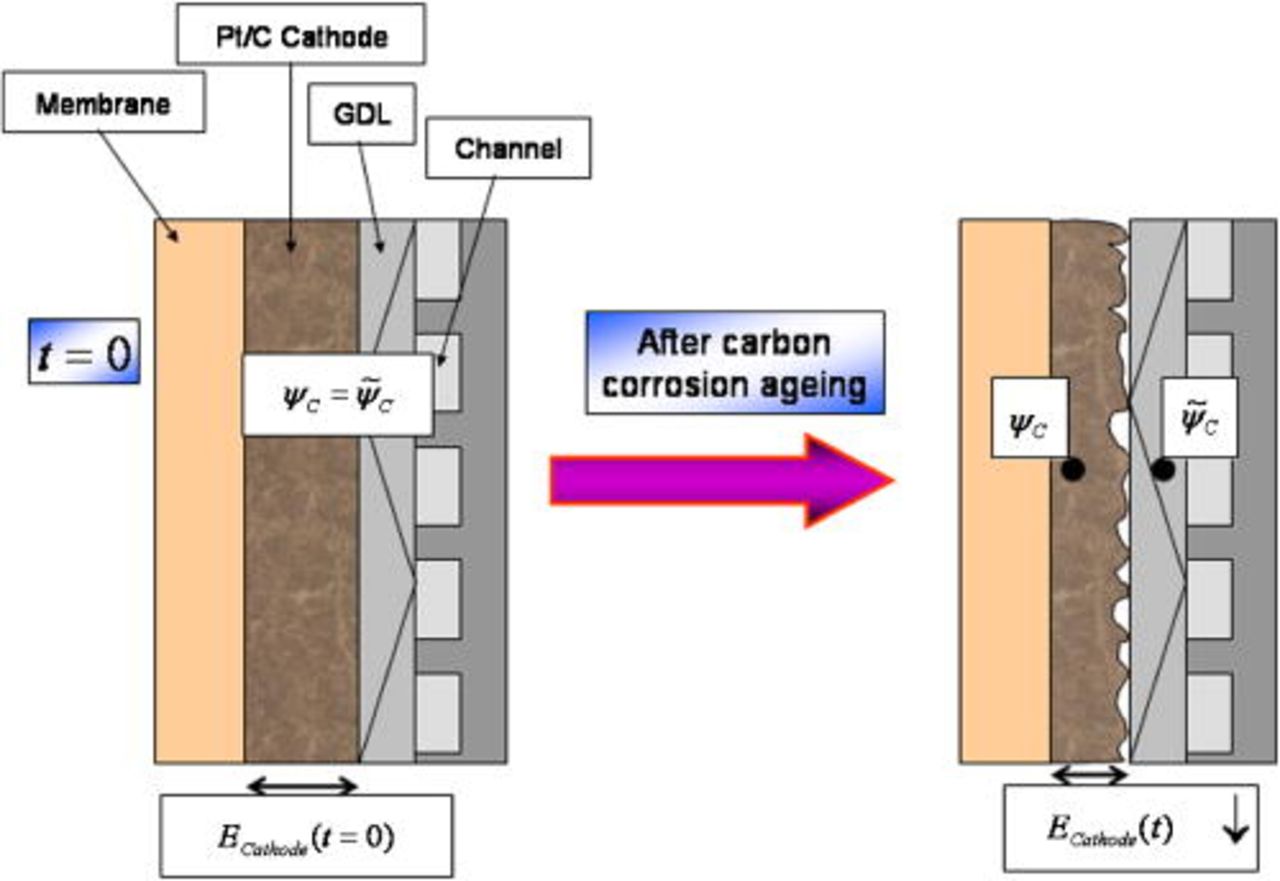
Figure 8. COR-driven cathode/GDL contact resistance increase.
In a first approximation, we assume that  is a function of
  according to
where  is a positive constant (cf. Table I).
The measured cathode potential becomes

Remark. In a first approximation, the impregnated Nafion thickness is assumed to be constant. Actually, because the carbon thickness decreases, the Nafion thickness may increase (if Nafion chemical degradation is not significant), increasing even more the reactant transport resistances and the impact on MEA performance degradation rate.
Membrane Models and Exchanged Currents
The membrane is considered impermeable to gases; only protons and water transfer through it. By assuming the electroneutrality in the electrolyte phase, the proton transport is governed by Ohm's law. For the two couples, anode 1/cathode 1 and anode 2/cathode 2, we have

where  and
and  are the electrostatic potentials of the cathode and anode electrolyte bulk
  .
.  for anode 2 is calculated by combining Eq. 48, 9 (cf. Appendix
  for the direct cell (anode 1/cathode 1) and
  for the reverse cell (anode 2/cathode 2).
In Eq. 83,  is the membrane resistance given by37
where  is the membrane thickness,
  the protonic conductivity, and λ the local number of water molecules per sulfonate site (cf. Table I)
Numerical Experiments
Software and parameters
We have solved our model numerically by means of an in-house code developed within a Simulink/Matlab environment. Discretization of the equations describing the reactants diffusion through the Nafion phase has been directly performed by using Simulink; five grid points have been used for the impregnated layer models. Solutions of the diffuse layer transport equations are analytically approximated as described in Appendix
For the simulations shown in this paper, we have chosen the set of physicochemical and geometrical parameters given in Table I. The orders of magnitude of some of the involved parameters in our model are known (e.g., electrical permittivity  ), others are estimated [e.g.,
  ] or measured (e.g.,
  ). Electrokinetics parameters are obtained following the procedure in Ref. 36: calculated observables (e.g., potential) are fitted with experimental values under well-known operating conditions [e.g., predicted open-circuit voltage (OCV) value obeys Nernstian behavior under equilibrium conditions (i.e., at
  ]. Results shown in all figures in this paper are obtained in the conditions detailed in Table II, unless stated otherwise. The numerical code allows the analysis of the dynamic behavior of the different state variables for different simulated operation times
  , including the electrode electronic potentials
  and
and  and the cell potential
  , in response to a static or dynamic current demand
  at given temperature
  , pressures
  and
and  , and initial platinum, Nafion, and carbon loadings. Also, the model allows analyzing the temporal evolution of the reverse current
  , the
, the  concentration, the cathode electrode thickness
  , the cumulated carbon mass loss, and the platinum surface area.
Electrochemical impedance spectroscopy diagrams are also calculated for different  and operating conditions. These transient simulations are carried out by following the numerical method previously introduced by us in the context of PEFC modeling:5–7, 36–40 the calculation is performed by controlling the current in the time domain with subsequent fast Fourier transformation. For the determination of the impedances, as in real experiments, a small sinusoidal signal (1% of the nominal current) is superimposed on the fixed (dc) current level
  in order to obtain a linear response of the potentials. This is performed for frequencies ranging from
  in the anticlockwise direction. As in our previous models, prior to starting the simulation of the periodic signal response, the pseudo-steady-state is calculated.
We underline that the full coupled model (i.e., including anode 1, cathode 1, anode 2, and cathode 2) is solved here. Simulations have been carried out on a computer with an Intel Pentium 4 processor  ,
,  of RAM, using the commercial Simulink solver ode15s with variable integration time step. The approximate calculation running time for a simulated operation time of
  is
is  . Calculation time (including the calculation of the pseudostationary state) of an EIS with 40 frequency points is
  .
.
Numerical simulations
Impact of the COR-driven degradation mechanisms on the performance temporal evolution
In Fig. 9, we compare the polarization curves obtained without and with cathode carbon oxidation for three different simulated operation times (the calculation without the coupling with the COR corresponds to the case  ).
).
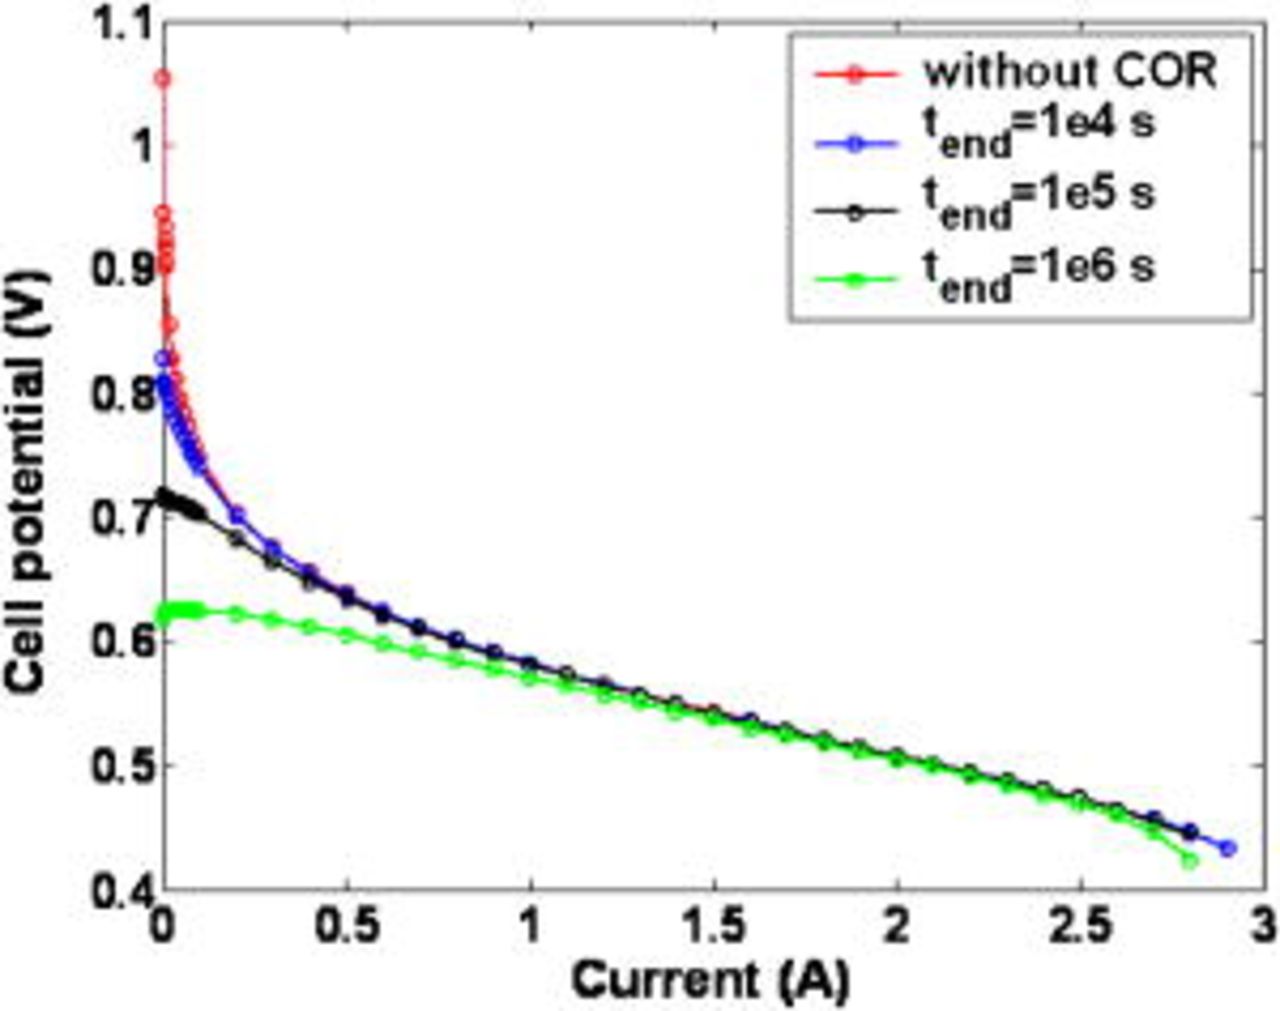
Figure 9. Predicted polarization curves for different simulated operation times.
For the shorter simulated operation times ( and
and  ), the cell potential shape agrees with typical experimental cell polarization curves. At
  , the OCV potential appears to be lower because of the simultaneous presence of hydrogen and oxygen in the anode chamber.
For longer simulated operation times ( and
and  ), the aging impact on performance reveals higher potential at OCV and low-current potential (no considerable impact is observed for intermediate and high operating currents). This behavior agrees with experimental observations9 and theoretical results discussed later in this paper (cf. Fig. 16).
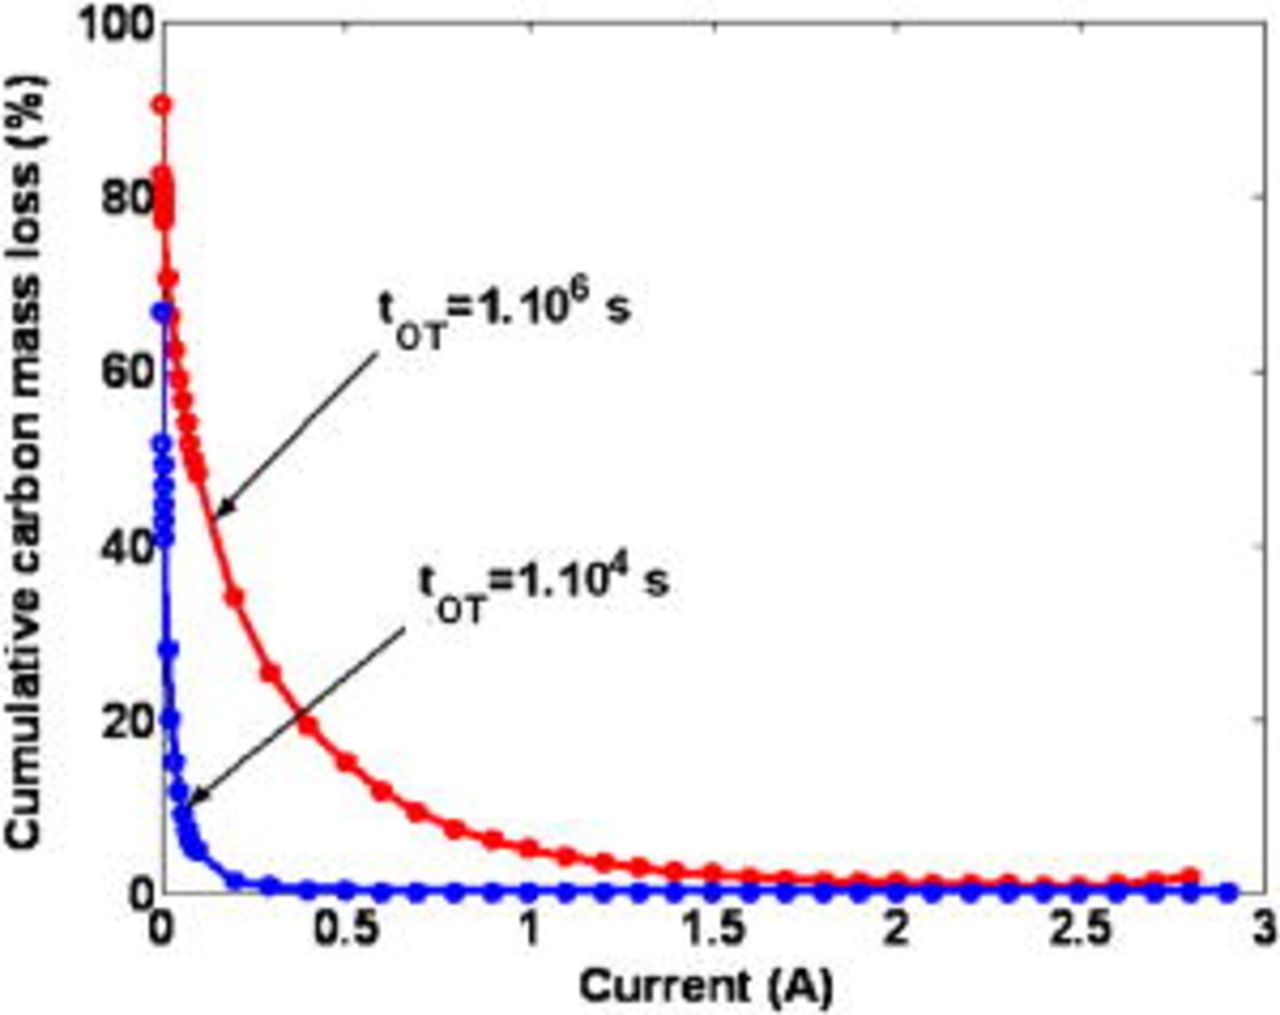
Figure 16. Impact of the nominal external current on the cumulative carbon mass loss for two simulated operation times.
On the basis of these results, we underline here that carbon oxidation could be another explanation of the experimentally observed PEFC OCV degradation under power cycling conditions, which some authors attribute to the presence of  in the cathode (resulting from
  membrane crossover from the anode).10
Figure 10 shows the simulated long-term behavior of the anode, cathode, and cell potential, for two static nominal currents. First, we note that  and
and  decrease with time because of the COR-driven degradation mechanisms [by not taking into account the COR description, the model calculates time-invariant potentials (not shown here)]. When the cathode carbon phase is degraded, the cathode thickness and the platinum surface area
  decrease with time (Fig. 11a and 11b), the latter following the platinum coarsening mechanism (cf. Eq. 79). Thus, the current density at the platinum level
  increases, despite the corrosion current
  decline shown in Fig. 12 (this current decreases because carbon mass decreases). In fact, there exists a competition between the COR rate, inducing the
  decrease, and the COR-driven platinum coarsening, inducing the
  increase. Prediction of cathode thickness and corrosion current decays has been already reported in experimental literature.11, 31
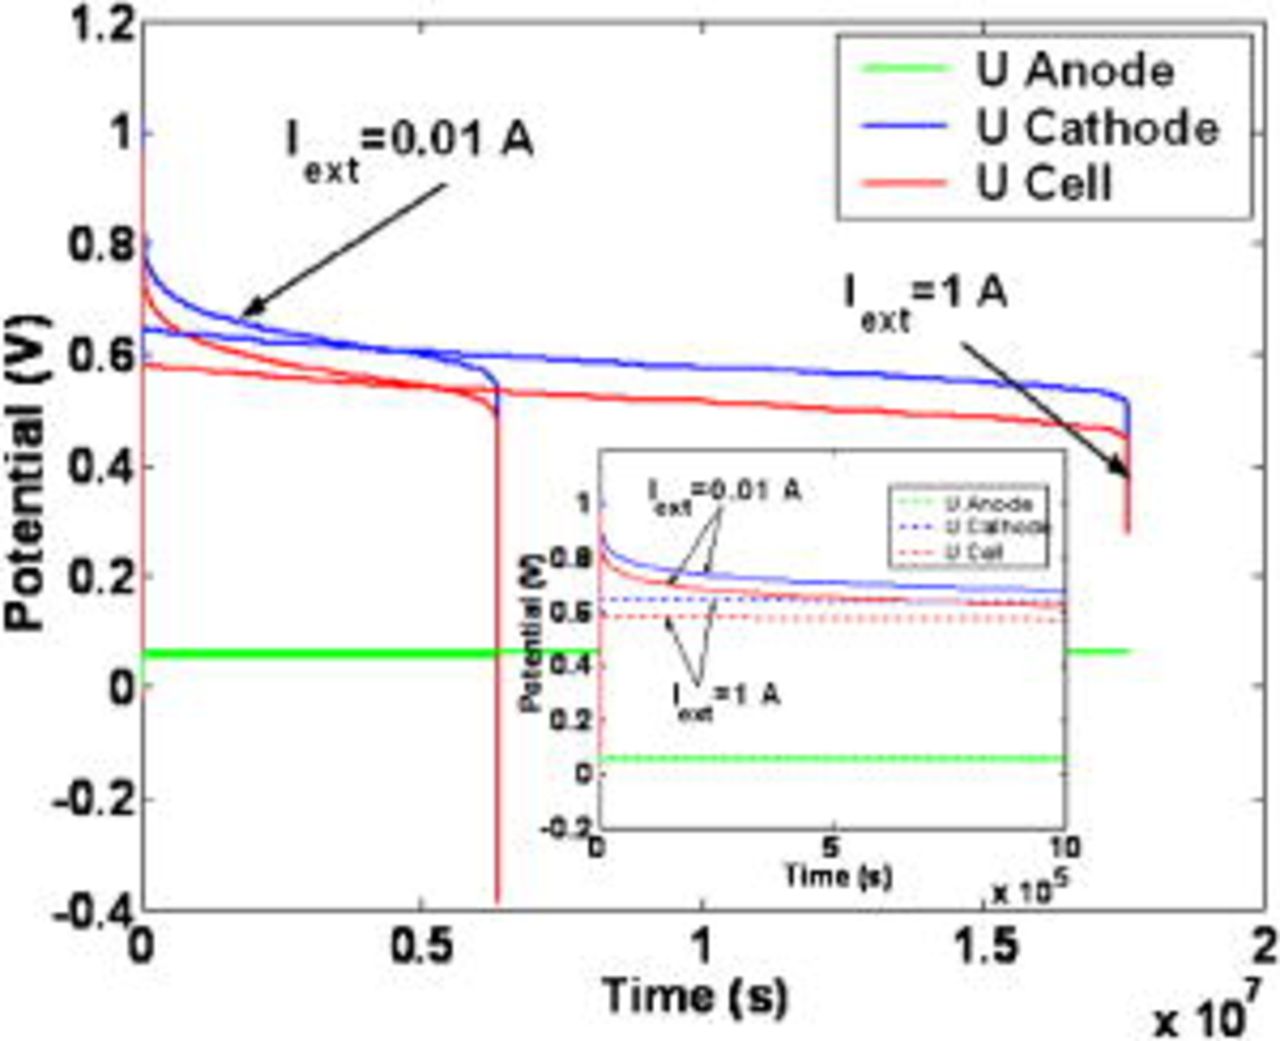
Figure 10. Simulated temporal evolution of the electrodes and cell potentials.

Figure 11. (a) Simulated temporal evolution of the cathode thickness and (b) simulated temporal evolution of the cathode platinum area.
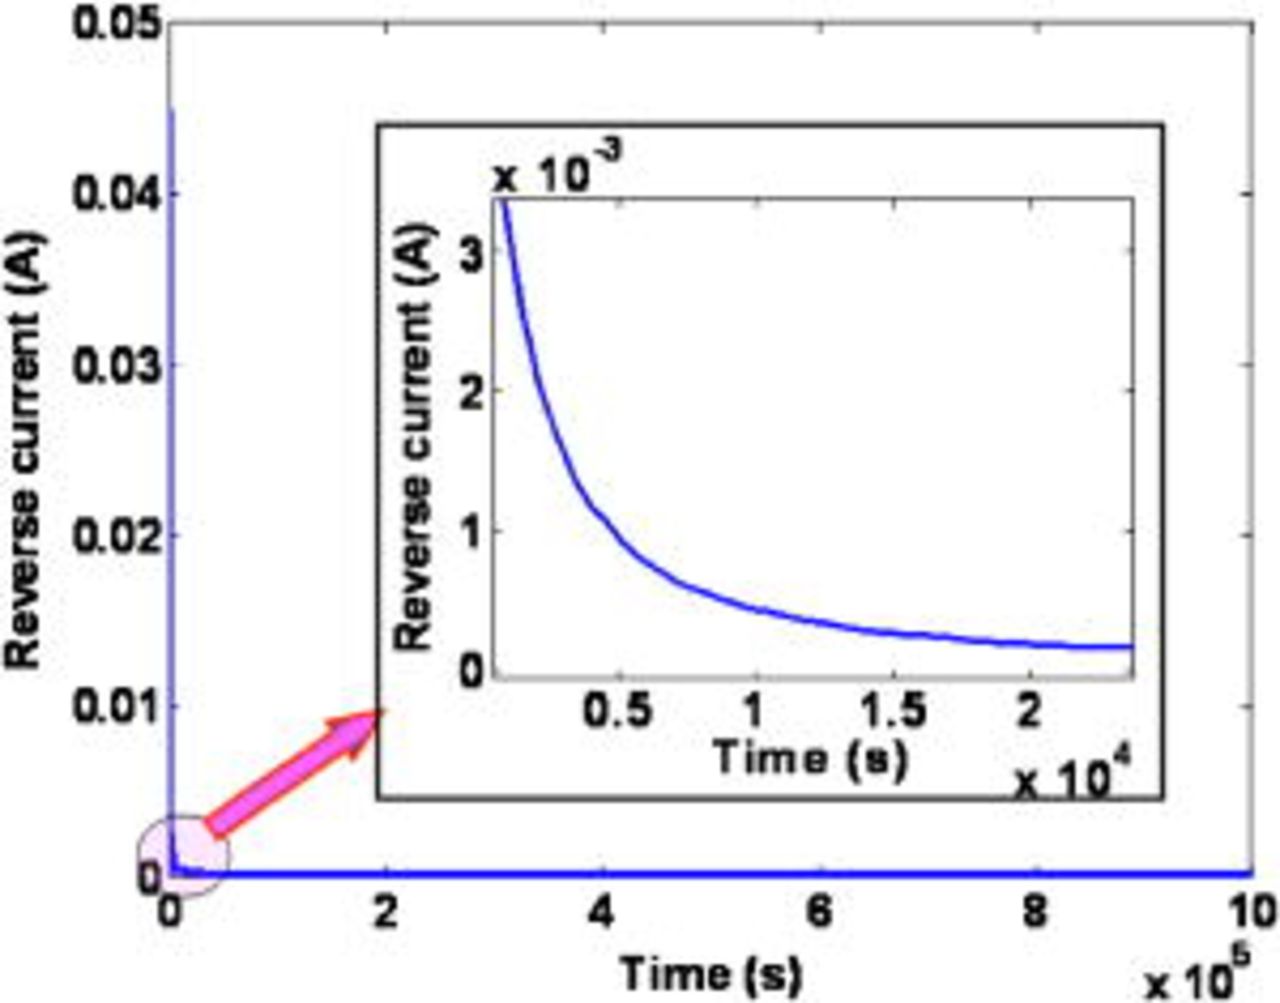
Figure 12. Simulated time-dependent reverse current.
For both nominal currents in Fig. 10, at a given simulated operation time  , the simulated cathodic potential decreases dramatically. This potential failure occurs when the cathode platinum surface area
  (driven by the temporal evolution of the cathode thickness) becomes too small to ensure the demanded current
  .
.
The predicted "potential collapse" operation times probably overestimate the durability of typical PEFC because, in the model discussed here, we do not include coupling with other degradation mechanisms. Our previous model in Ref. 5–7 can be coupled to the model here in order to explore the competition between the different aging mechanisms, as we propose for future work49 (cf. Conclusion section).
The temporal evolution of the cumulative carbon mass loss and the  concentration in the cathode layer
  at
at  are provided in Fig. 13. The predicted behavior is governed by the carbon corrosion reaction rates (cf. Eq. 63, 64). The cumulative carbon mass loss increases with time, but the slope decreases because of the platinum surface area decrease (cf. discussion of Fig. 28). The transient
  concentration behavior is in qualitative agreement with some in-line measurements reported in literature.18
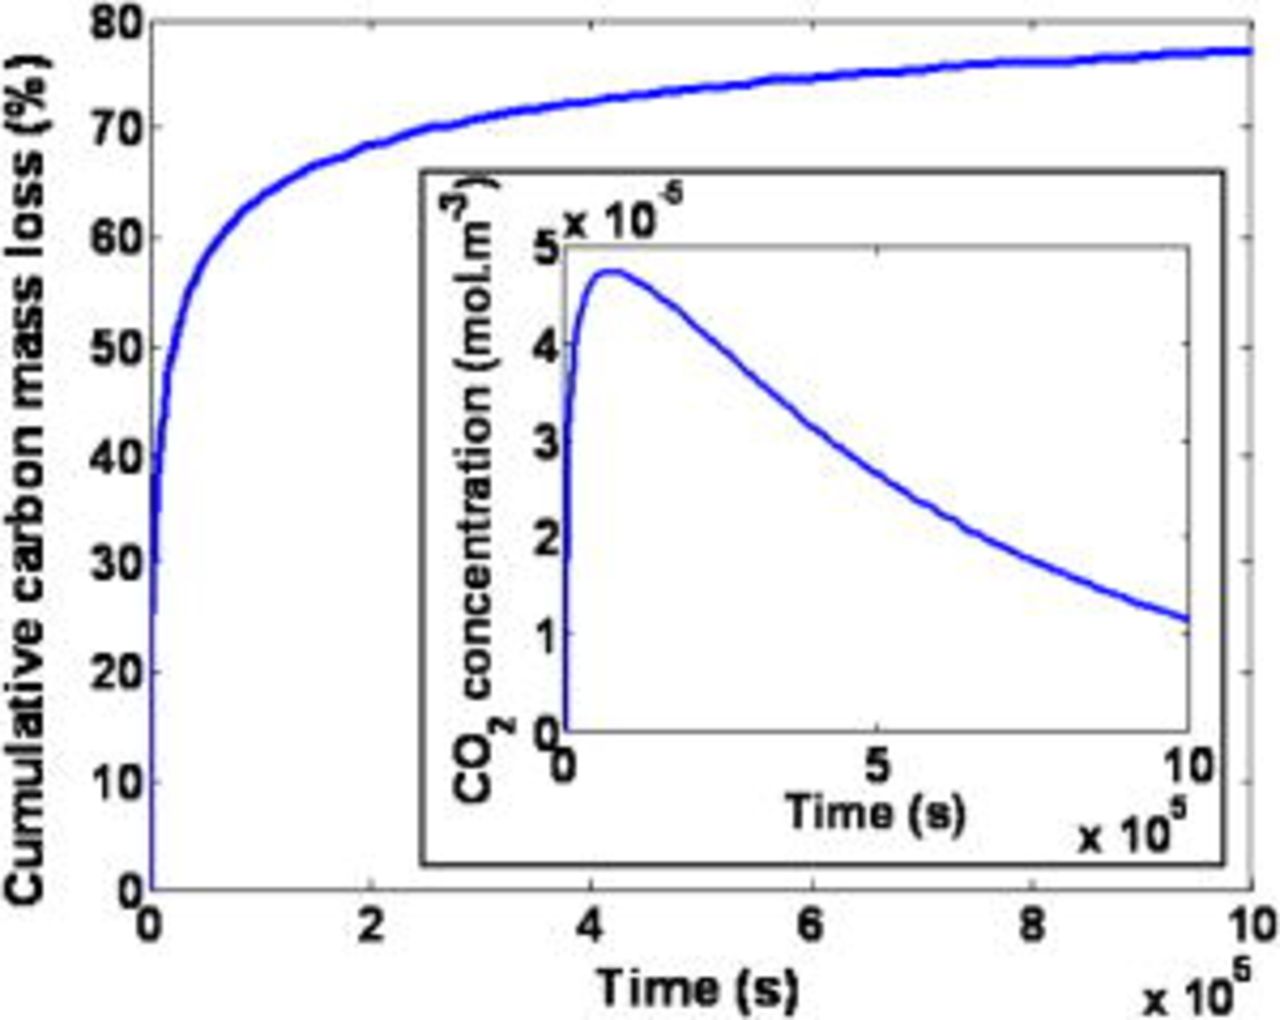
Figure 13. Simulated cumulative carbon mass loss and carbon dioxide concentration in the cathode.
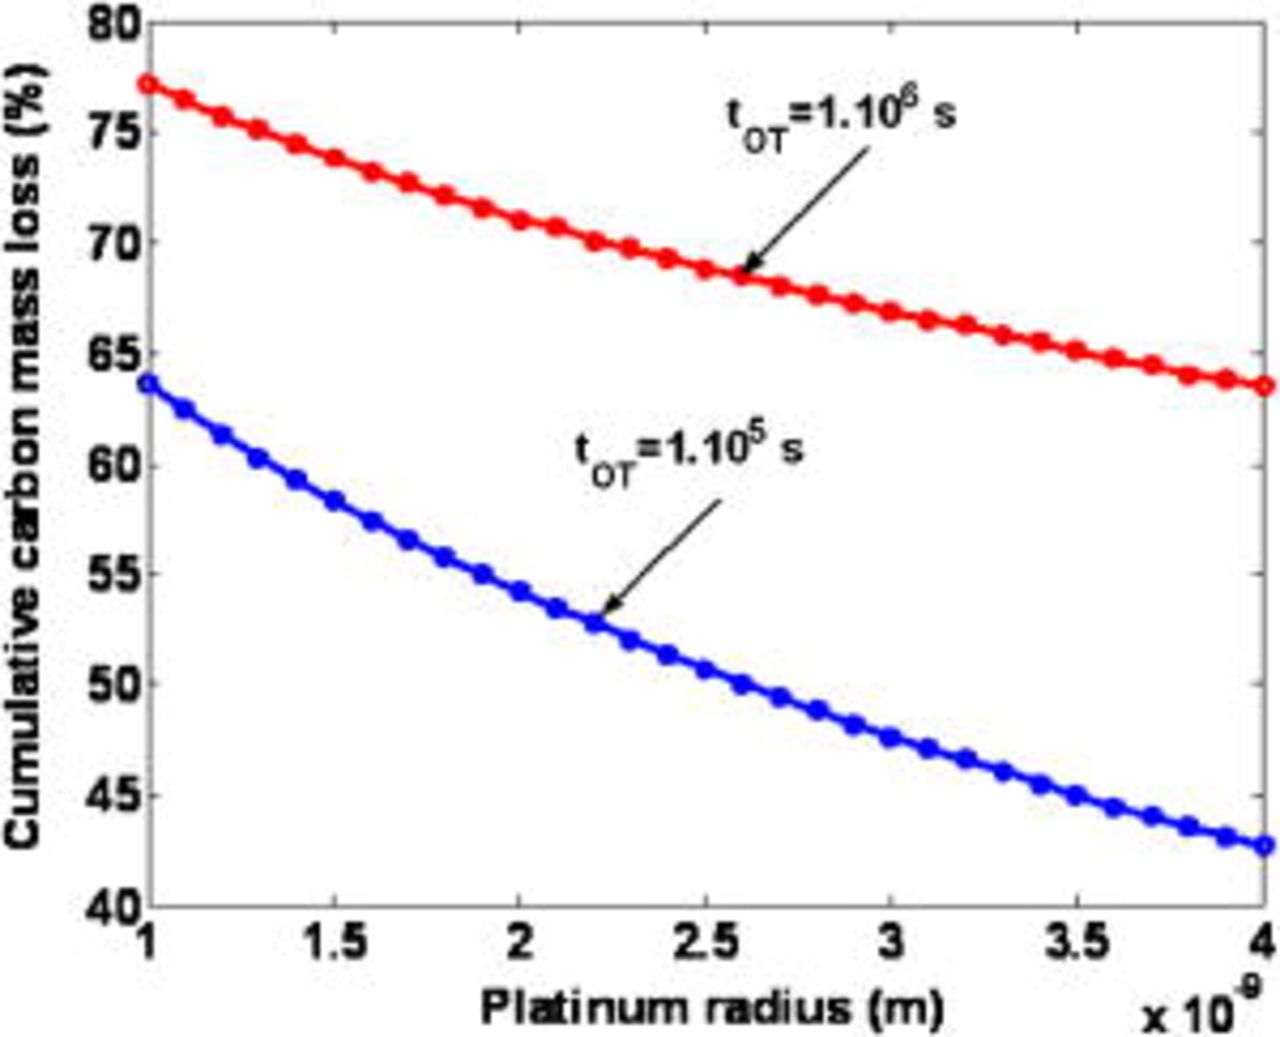
Figure 28. Simulated impact of the Pt grain radius on the cumulative carbon mass loss for two operation times.
The calculated effect of the external nominal current  on the MEA durability [cell potential "failure time" (cf. Fig. 10)] is plotted in Fig. 14, which shows a bell-shaped curve suggesting that an "optimal" external current inducing a maximal durability exists. The predicted shape is explained as follows. Lower currents favor COR-driven Pt coarsening (COR is favored). Then,
  decreases faster as the current decreases: durability decreases as the nominal current decreases. At higher currents, COR-driven Pt coarsening is slower; however, because the demanded current is higher, failure potential is reached faster as the current increases, and durability decreases again as the current increases.
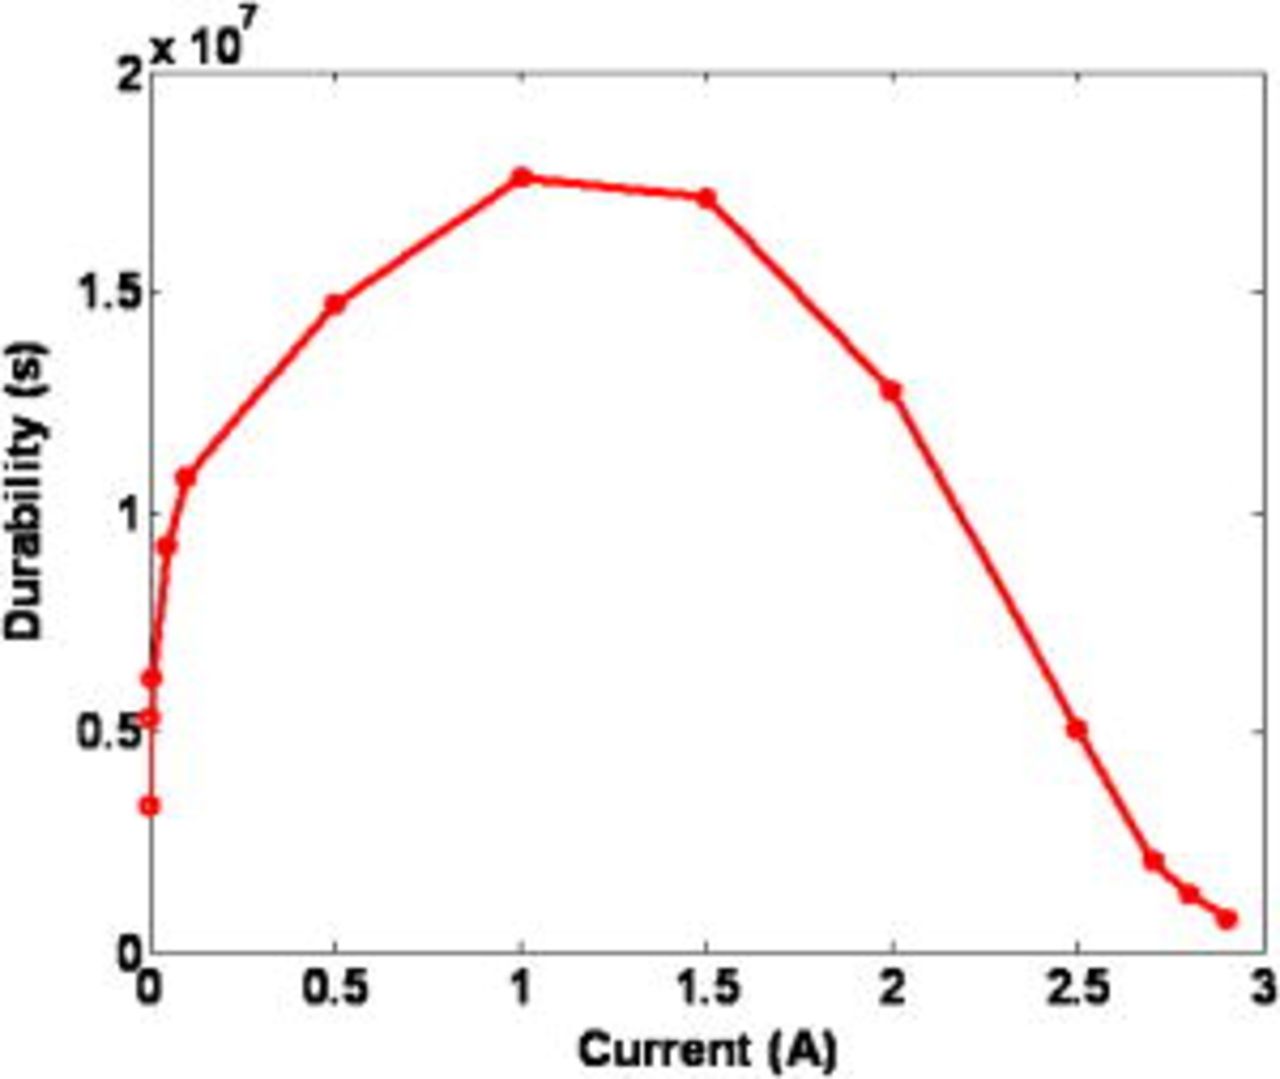
Figure 14. Calculated durability (time when "potential failure" occurs) as a function of the external nominal current.
As shown in Fig. 15, the model captures the effect of the simulated operation time on the EIS pattern. At  , for short simulated operation times, EIS consists of a high-frequency capacitive and of a low-frequency inductive loop, in agreement with experimentally observed patterns.50 The low-frequency inductive loop is related to the competition between intermediates species on the catalytic surface,5 and its size decreases with simulated operation time (because
  increases). Furthermore, the high-frequency capacitive arc diameter, also linked to interfacial electrochemical phenomena, looks less sensitive to short operating times.
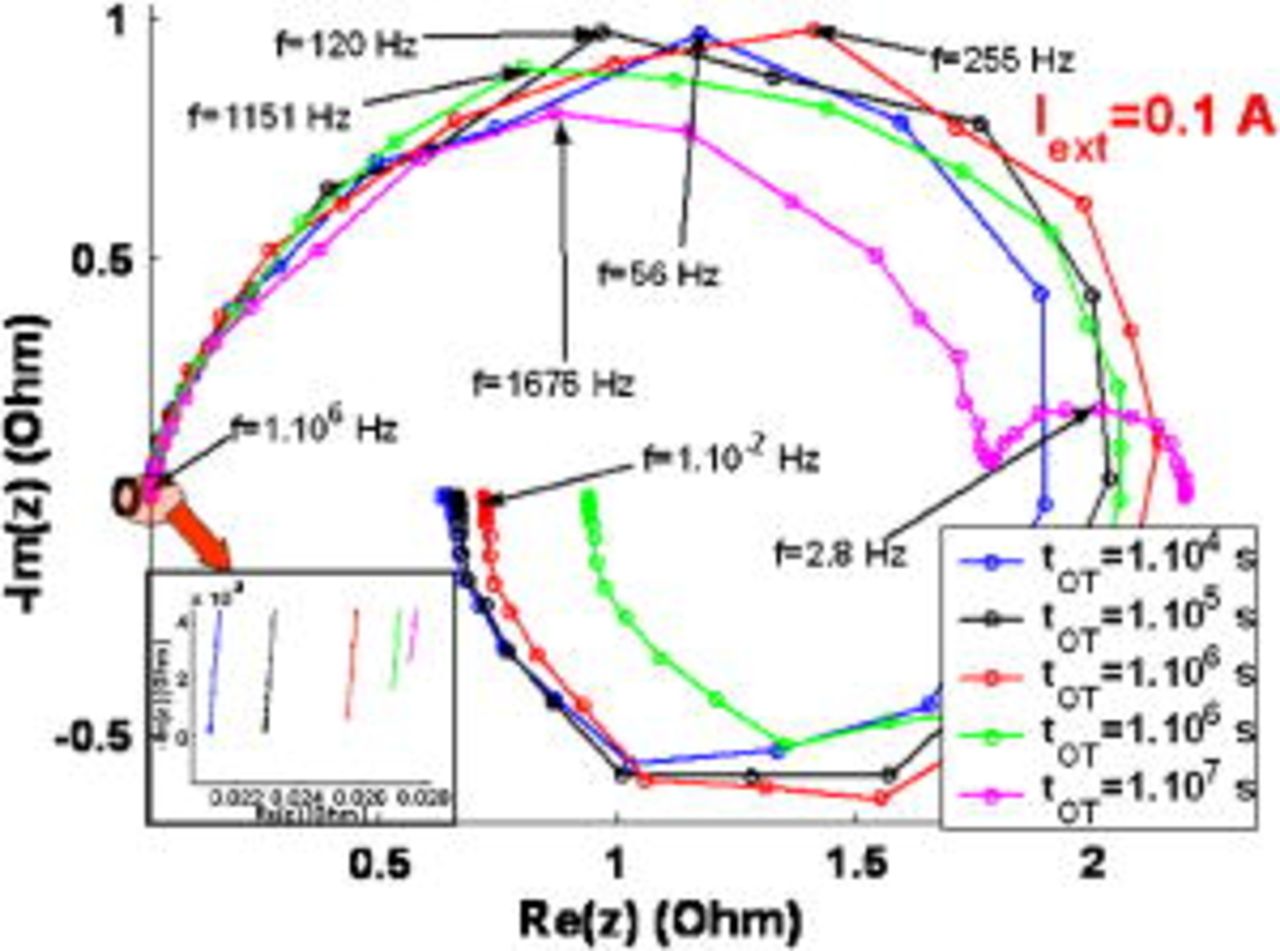
Figure 15. EIS sensitivity to the simulated operation time.
The degradation impact is more significant when the simulated operation time is longer. We can see that the inductive loop becomes a capacitive loop at  , as already reported,18 and the high-frequency loop diameter decreases considerably.
The increase of the amplitude of the low-frequency capacitive loop is associated with the increase of the oxygen transport limitation through the microscale Nafion layer because of the COR-driven rise of  .
.
Moreover, we can see that the high-frequency resistance increases with time. Because in our simulations the membrane resistance remains unchanged (no ionomer degradation mechanisms included), this behavior is due to the  increase originated by the COR.
Impact of the operating conditions on the degradation
In Fig. 16, we show the impact of the external current  on the cumulative carbon mass loss {defined as
  }, for two simulated operation times. It can be observed that when the current increases, the cathodic potential decreases and then the COR becomes slower (cf. Fig. 9); lost carbon mass is higher at lower currents, in agreement with ex situ experimental behaviors.9 This suggests that, to mitigate cathode carbon oxidation during start-up/shutdown
  flow experiments, it seems better to operate the MEA at intermediate/high current values.
Figures 17 and 18 illustrate the effect of the external current  on the EIS shape for two simulated operation times. At
  , the impact of the carbon corrosion on performance is not yet significant and the EIS sensitivity to the nominal current is analogous to the tendency already reported by us by simulating a MEA without describing the aging phenomena36, 37, 39, 40 (Fig. 17a, 17b and 17c). At low currents, the EIS high-frequency capacitive arc diameter decreases with the demanded current and the inductive loop decreases. At a sufficiently high current, a low-frequency capacitive loop related to the oxygen transport limitation through the microscale hydrated Nafion layer appears. As expected, the magnitude of this low-capacitive arc increases as the nominal current increases.
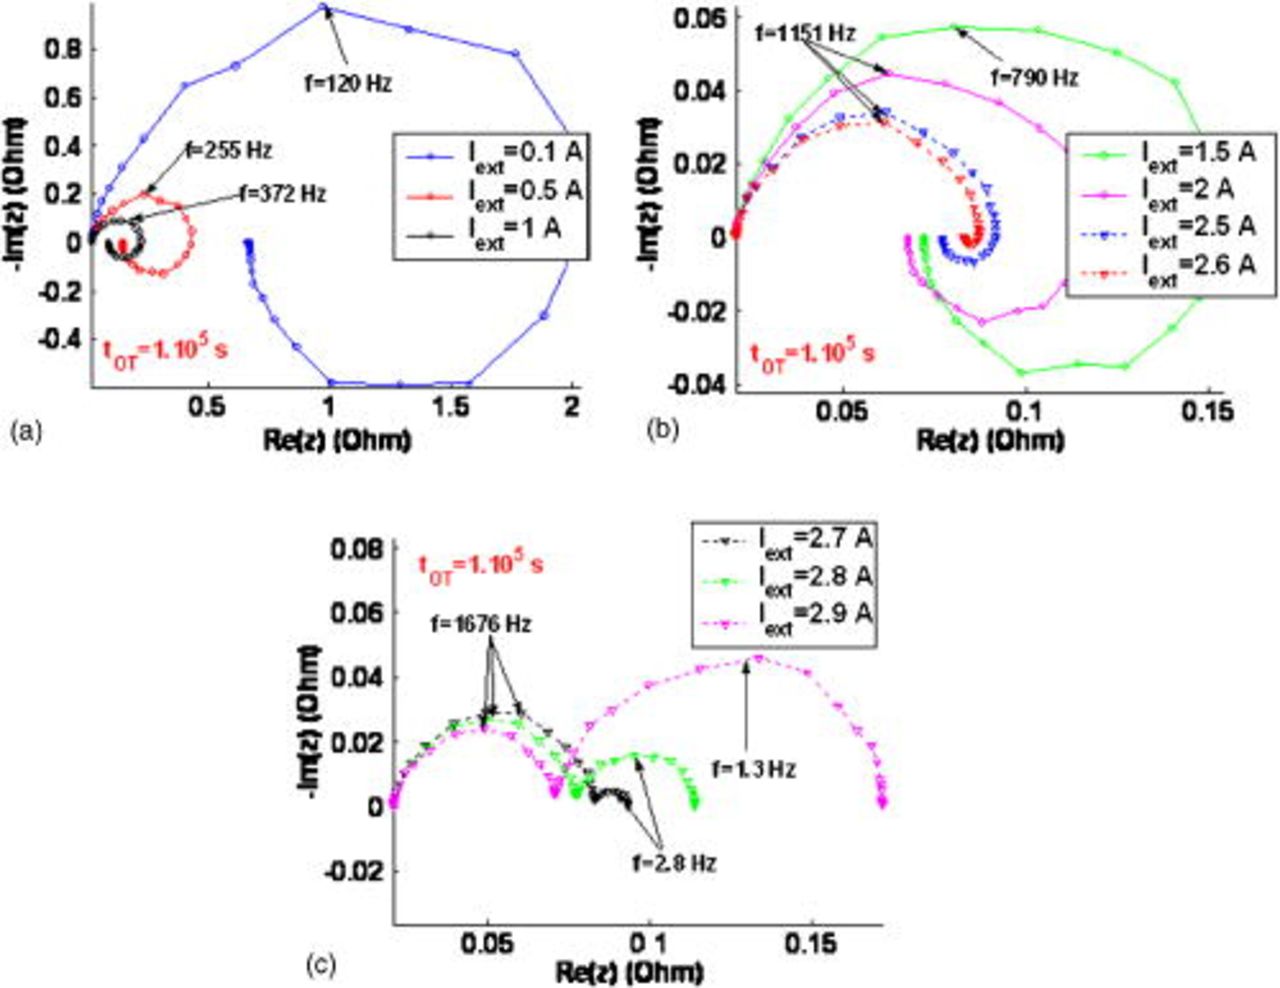
Figure 17. Simulated impact of the nominal external current on the EIS pattern at  .
.
At  , the COR-driven degradation is quite significant at
  , which translates as the presence of a low-frequency capacitive loop (not observed for the same current at
  ) (Fig. 18a). However, for intermediate currents (
 and
and  ) the EIS shapes are qualitative and quantitative similar to the ones calculated at
  because COR impact on performance decreases with current. At higher currents (Fig. 18b), despite that COR process and the driven platinum coarsening are slower, the available platinum surface area becomes too low to ensure the demanded external current. Then, transport limitation low-frequency capacitive arcs appear at lower currents than in the
  case.
case.
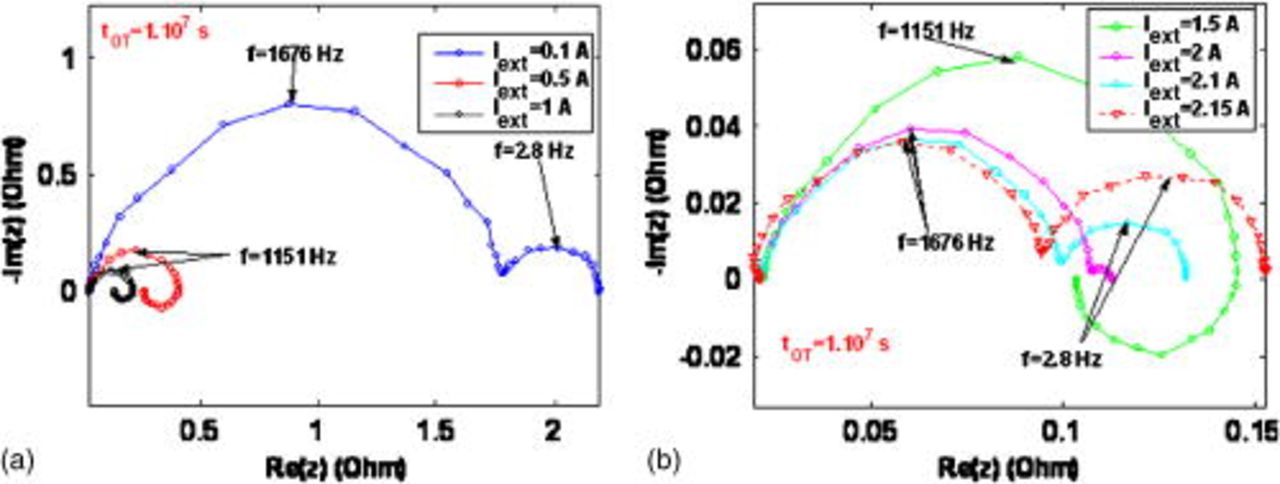
Figure 18. Simulated impact of the nominal external current on the EIS pattern at  .
.
Figure 19 shows the impact of the temperature on the cumulated carbon mass loss and on the performance, for two simulated operation times. As expected from the experimental knowledge,31 the cathode damage increases with the temperature, up to  ; the temperature favors the COR (cf. Table I). For higher temperatures, however, cumulated carbon mass loss slightly decreases; this interesting feature occurs because the remaining
  at a given simulated operation time decreases with temperature (COR-driven Pt coarsening is faster as temperature increases), slowing down the carbon corrosion process (cf. discussion of Fig. 28).
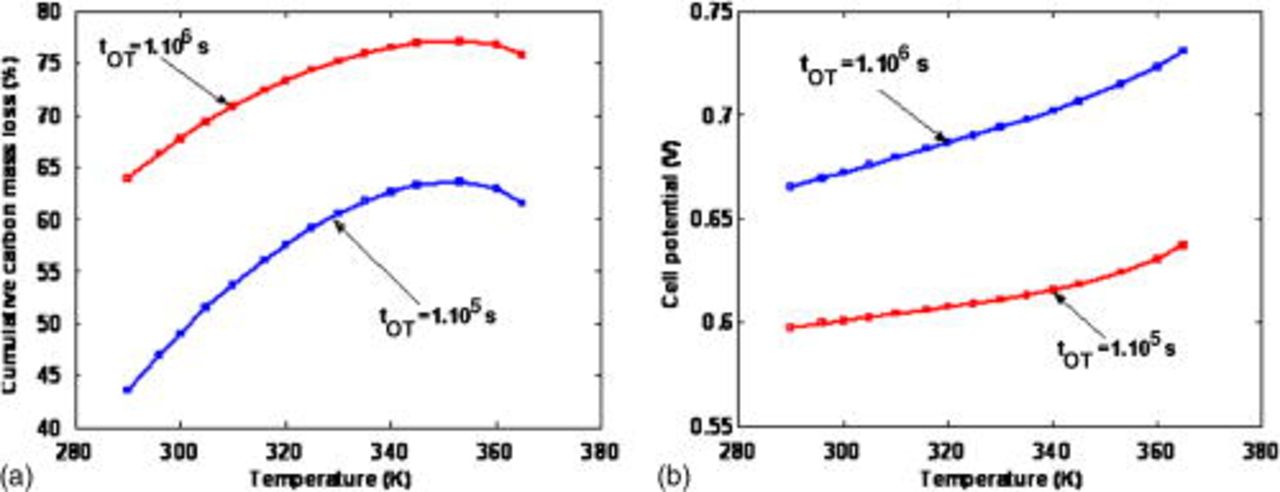
Figure 19. (a) Simulated impact of the temperature on the cumulative carbon mass loss and (b) simulated impact of the temperature on the cell potential.
Figures 20 and 21 show the simulated temperature impact on EIS at  , for two different operation simulated times (
 and
and  ). In both cases, because the hydrated Nafion proton conductivity increases with the temperature (cf. Table I), the high-frequency resistance shifts toward the Nyquist's plan origin.
The predicted sensitivity of the capacitive and inductive loop sizes is related to the temperature-dependent mathematical expressions used to describe the electrochemical reactions, the carbon oxidation mechanism, and the reactant transports. It can be observed that at  , the amplitude of the high-frequency capacitive arc is slightly bigger at the highest temperature (Fig. 20).
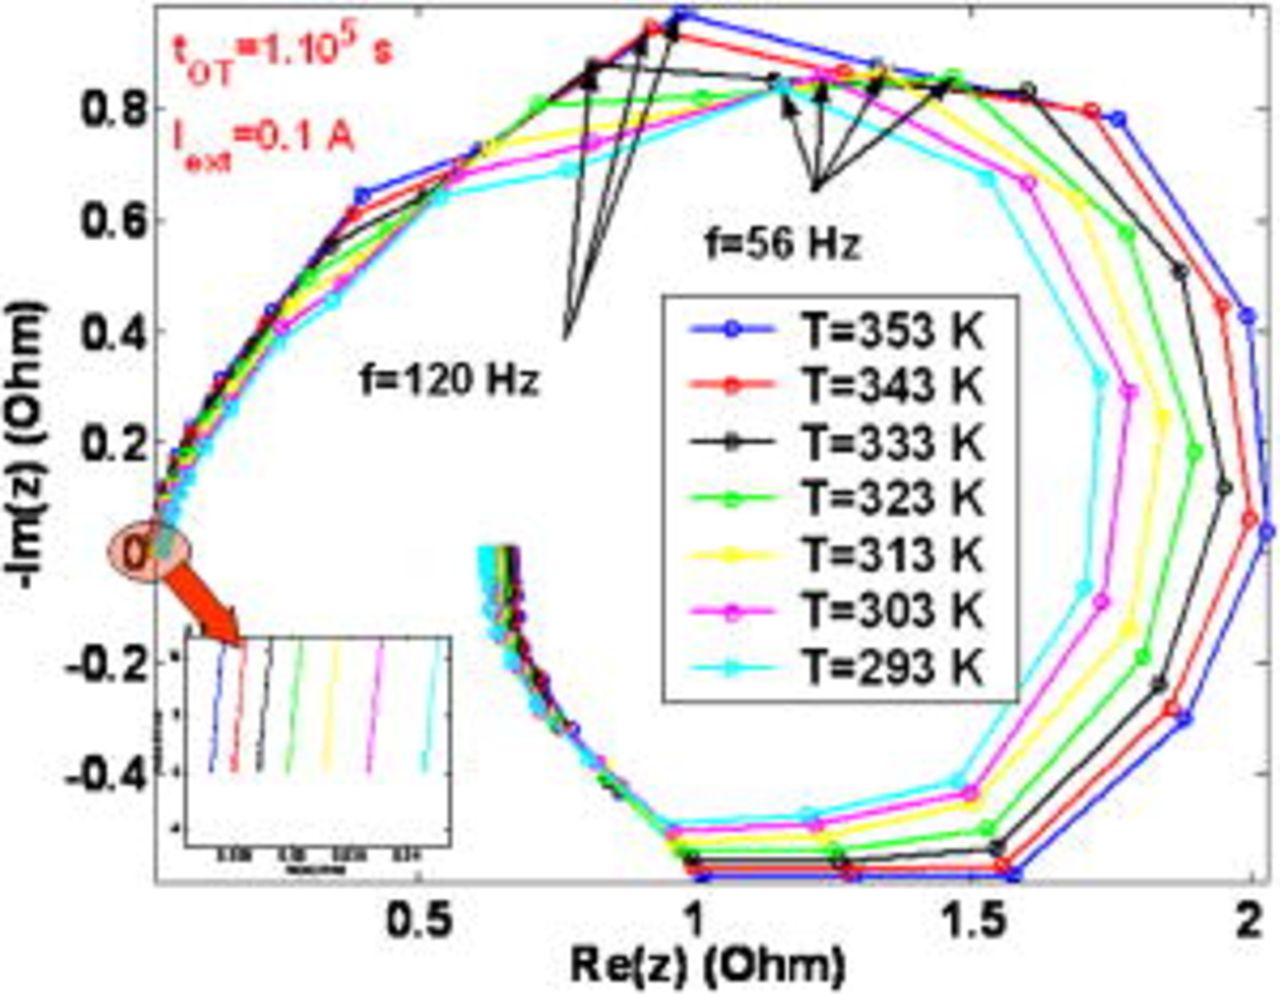
Figure 20. Simulated impact of the temperature on the EIS pattern at  .
.
Otherwise, at  , the impact of the COR-driven degradation is significant (cf. Fig. 11a): the amplitude of the high-frequency arc is smaller at the highest temperature (Fig. 21). As shown in Fig. 21, the COR also contributes to decrease the amplitude of these low-frequency inductive arcs. These loops are masked, for a sufficiently high temperature, by a low-frequency capacitive loop, with an amplitude increasing with temperature. In fact, temperature favors the COR-driven platinum coarsening and again, this leads to the decreasing of
  and to the increasing of
  . The increase of this current density leads to early hydrogen and oxygen limitation and manifests as a bigger low-frequency arc amplitude at the highest temperature.
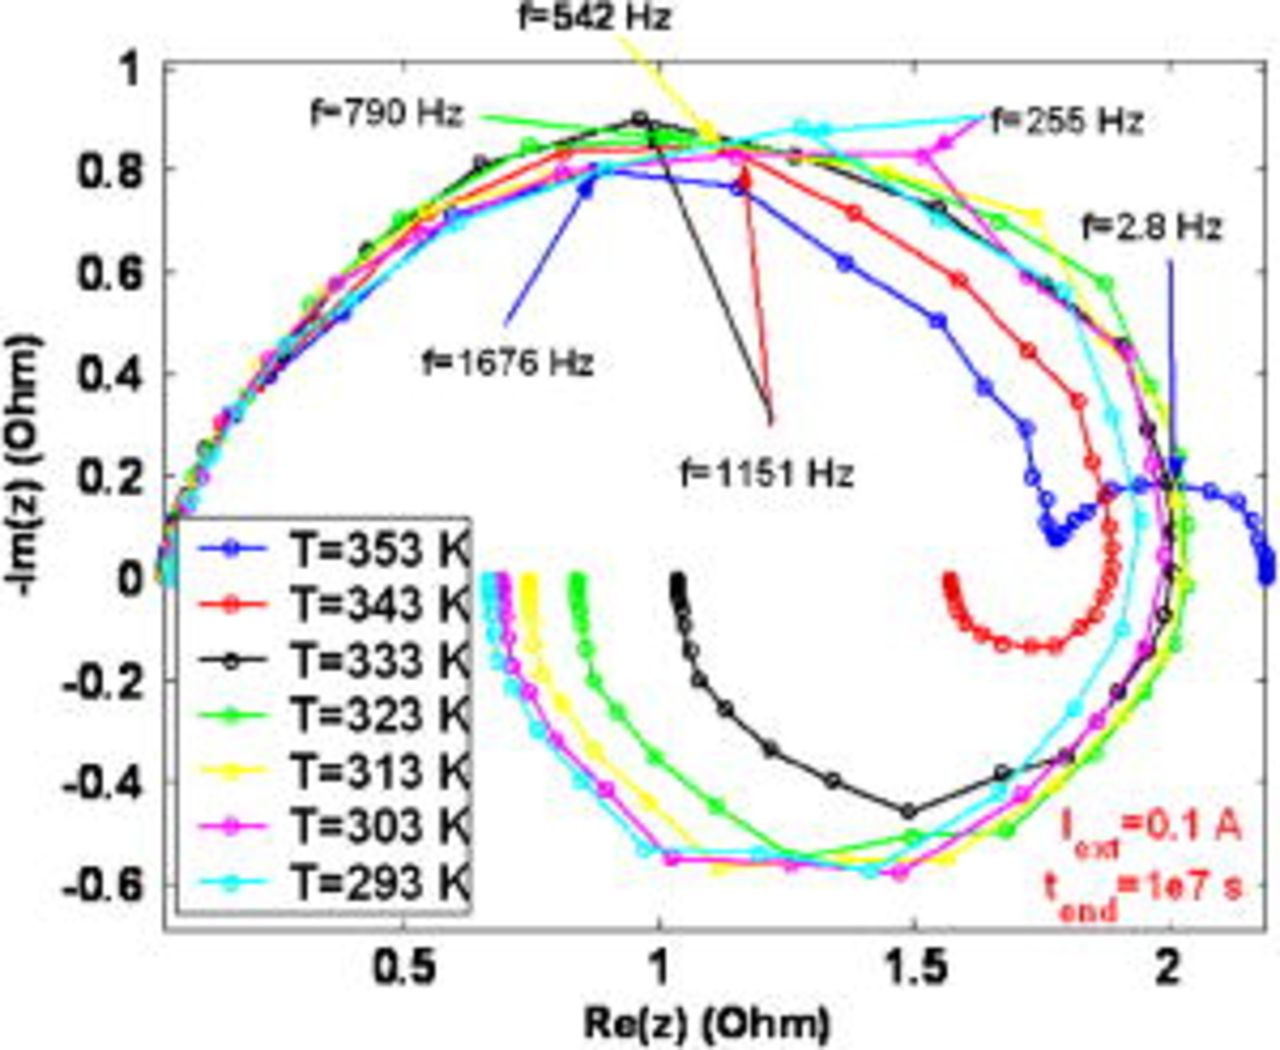
Figure 21. Simulated impact of the temperature on the EIS pattern at  .
.
In Fig. 22, we focus on the reactant pressures impact on the cumulated lost carbon mass at two simulated operation times (we assume  ). The lost carbon mass increases when the anode and cathode pressures are increased together; this is because the increase of the oxygen concentration in the anode side, which improves the cathode COR mechanism, as shown in Fig. 23a. As expected, the cell potential decreases when the oxygen concentration in the anode increases, as shown in Fig. 23b.
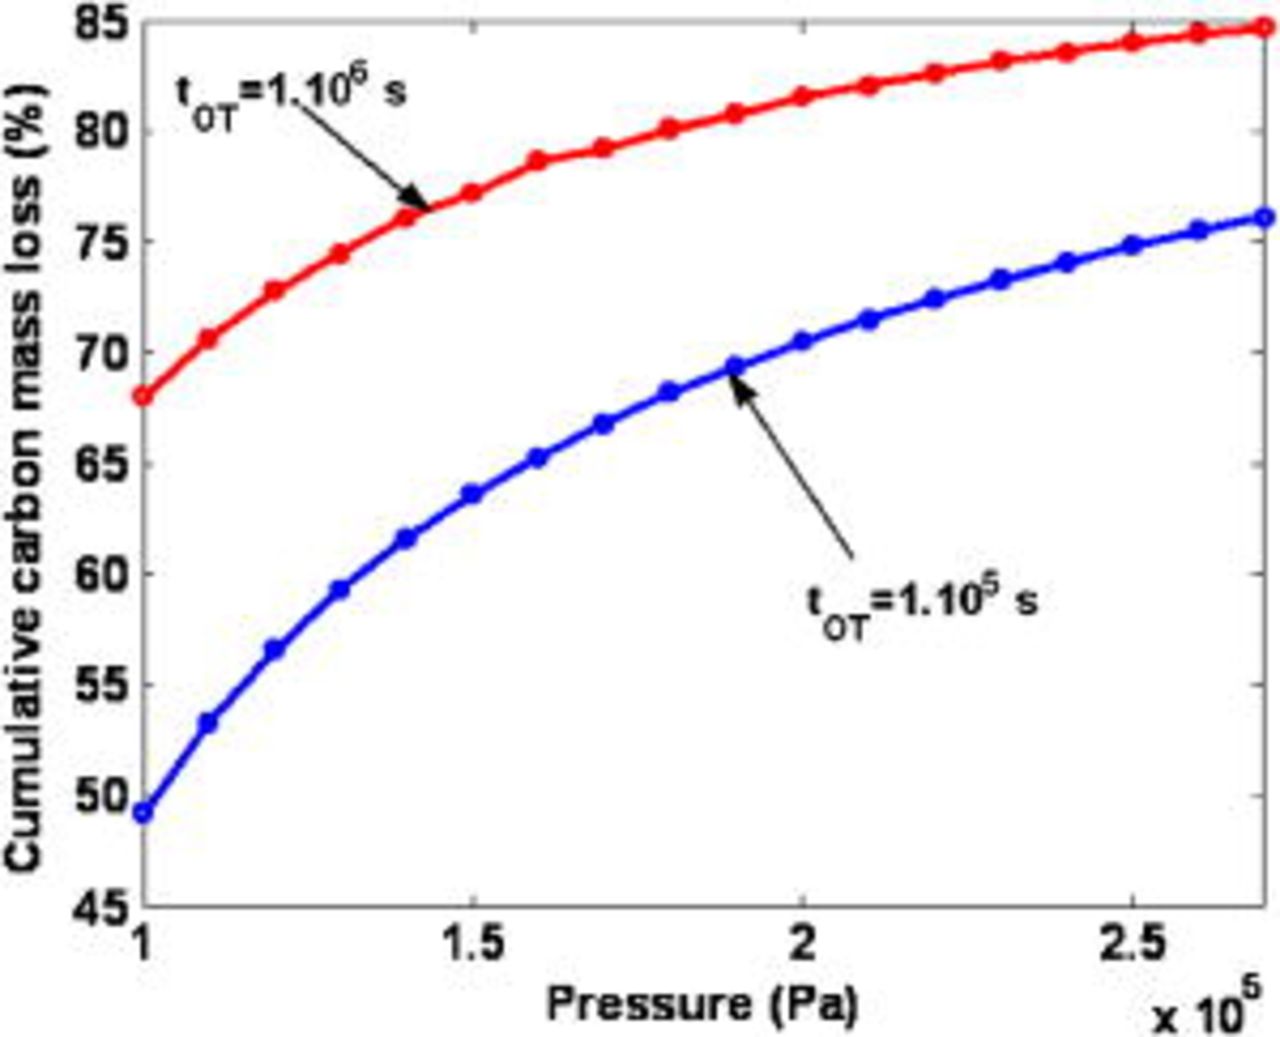
Figure 22. Simulated impact of the reactant pressure on the cumulative carbon mass loss (anode and cathode pressures assumed to be the same).
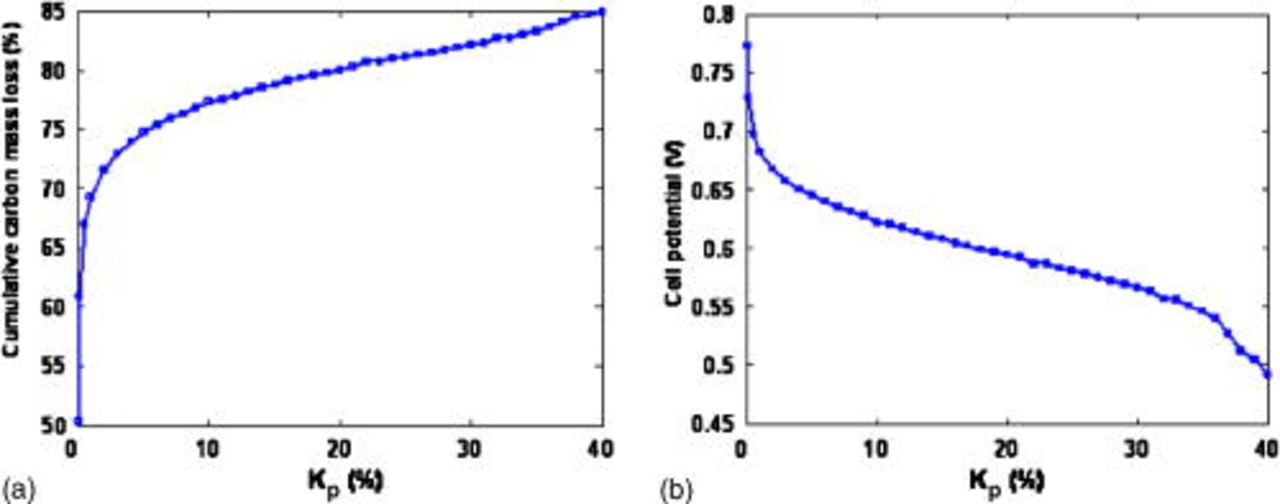
Figure 23. (a) Simulated impact of the percentage of oxygen in the anode on the cumulative carbon mass loss and (b) simulated impact of the percentage of oxygen in the anode on the cell potential.
Impact of initial  loadings and cathode structural properties on COR degradation

As shown in Fig. 24, the model captures the impact of the initial cathodic platinum mass ratio  on the cumulated carbon mass loss, for two simulated operation times. Increasing the platinum mass in the cathode considerably increases the carbon support damage, in agreement with some experimental results.30 Hence, it is clear that the cathodic ORR (cathode 1) plays a major role on the COR (cathode 2), by directly consuming the electrons produced by the last reaction (the cathode platinum "catalyzes" the carbon corrosion).
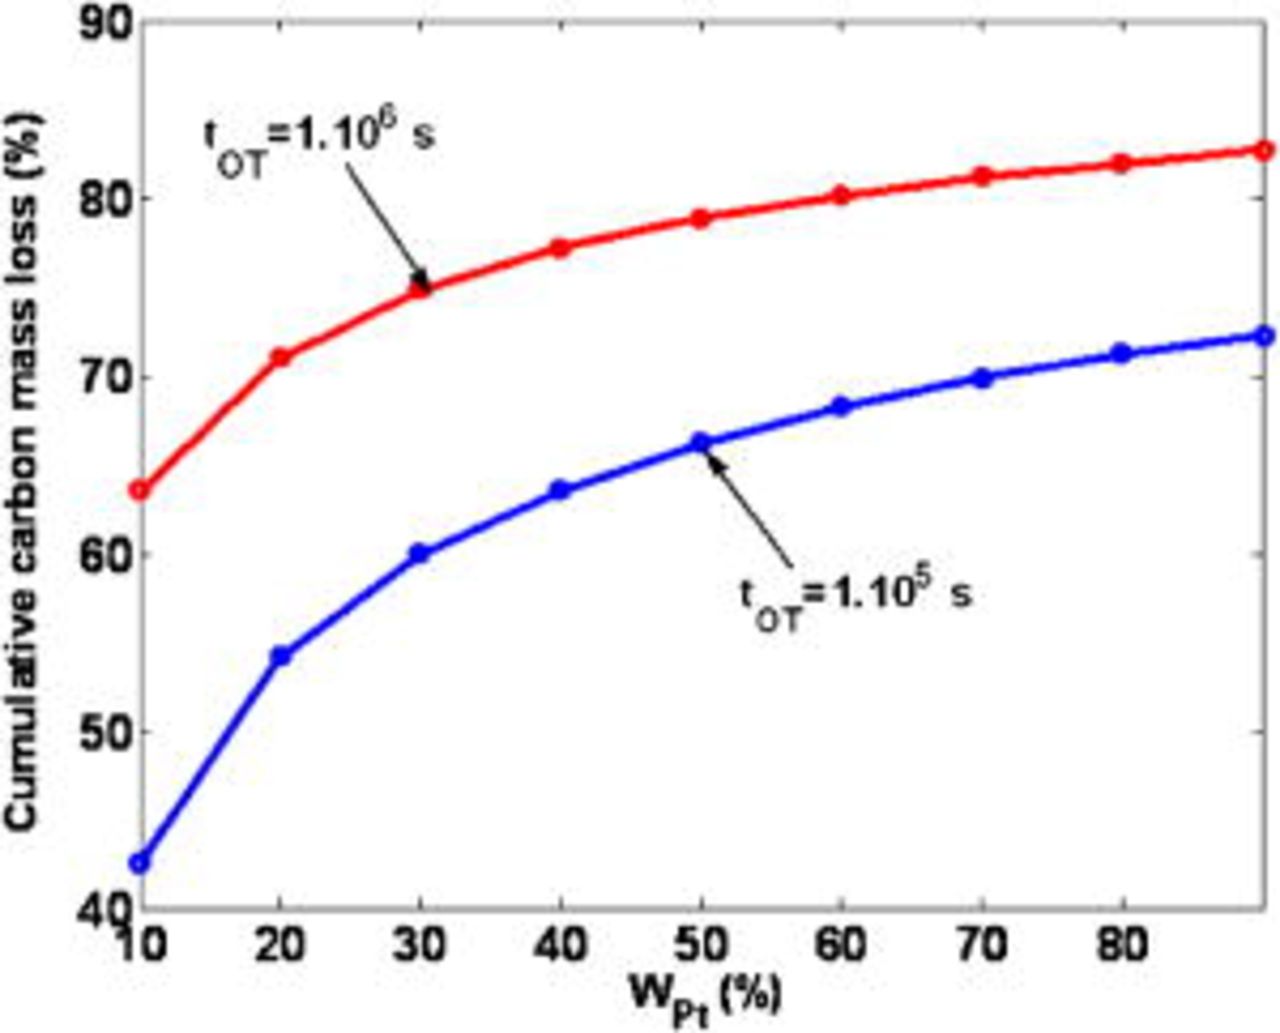
Figure 24. Simulated impact of the cathode Pt mass ratio on the cumulative carbon mass loss for two simulated operation times.
The slopes of these curves decrease as the initial  increases; this is because
  decreases during the simulated PEFC operation, and then, COR is slowed down (cf. Fig. 28).
The impact of  on EIS is provided at two simulated operation times in Fig. 25a and 25b. At
  , the impact of platinum loading reveals small (EIS shapes are similar for the three platinum loadings). For
  , the increase of the initial platinum loading accelerates the carbon damage (low-frequency capacitive arcs increase with the initial platinum loading). In fact, the decrease of the platinum loading delays the COR impact on the PEFC MEA performances.
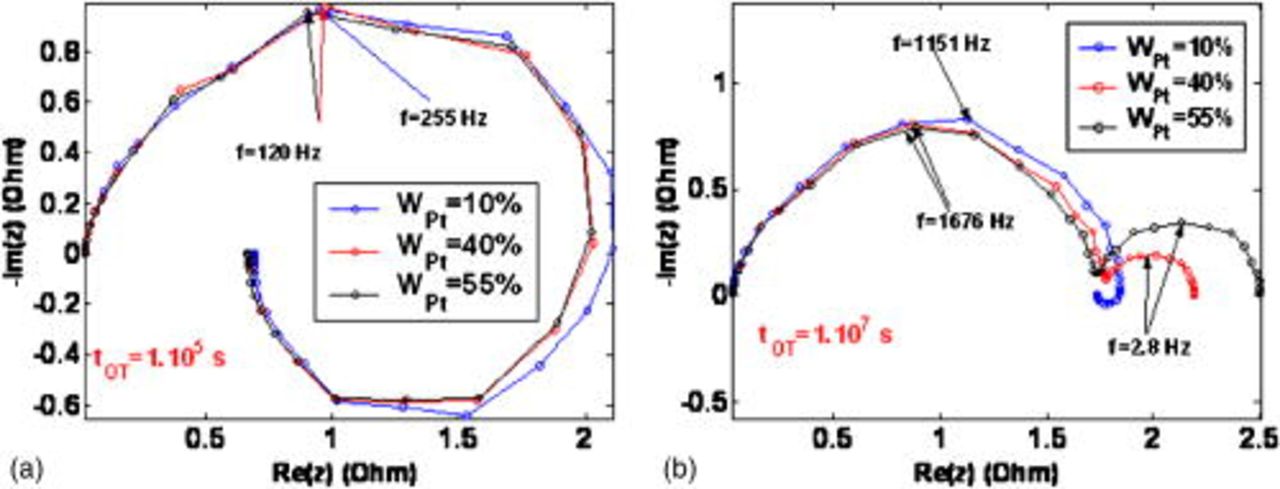
Figure 25. Simulated impact of the cathode Pt mass ratio on the EIS shape for two simulated operation times.
In Fig. 26, we show the influence of the initial carbon mass on the cumulated carbon mass loss at  , for three cathodic platinum mass ratios. It is not surprising to observe that the increase of the initial carbon mass leads to the increase of the cathode damage, because of the increase of the platinum loading (platinum mass ratio
  kept constant).
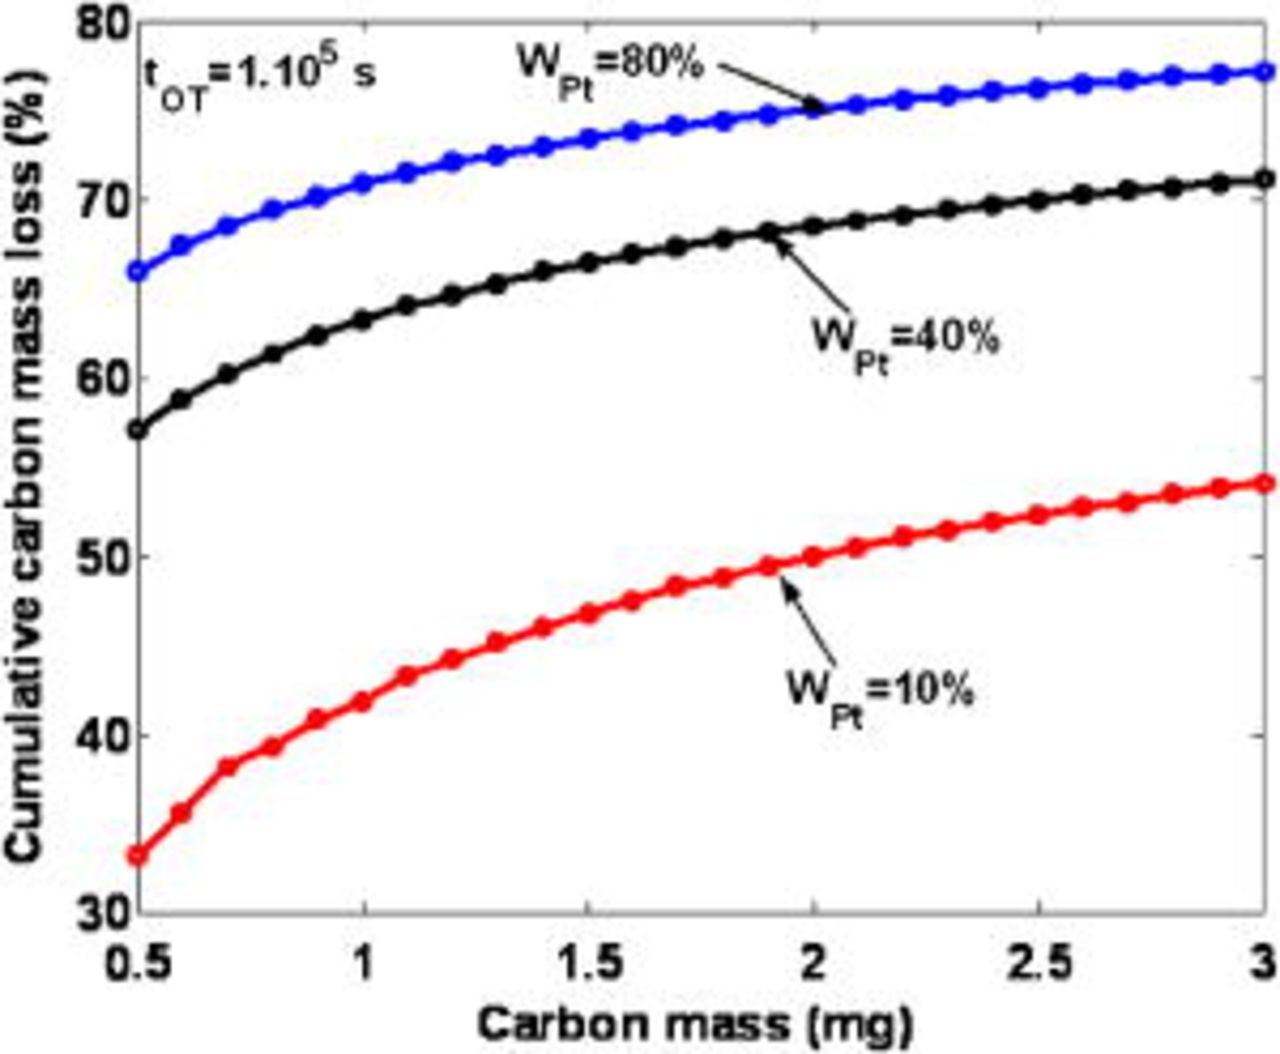
Figure 26. Simulated impact of the initial cathode carbon mass on the cumulative carbon loss for three Pt mass ratios  .
.
In contrast to this, in Fig. 27 we show that if we keep constant the initial platinum loading when the carbon mass is increased, then the cathode carbon damage appears to be decreased.
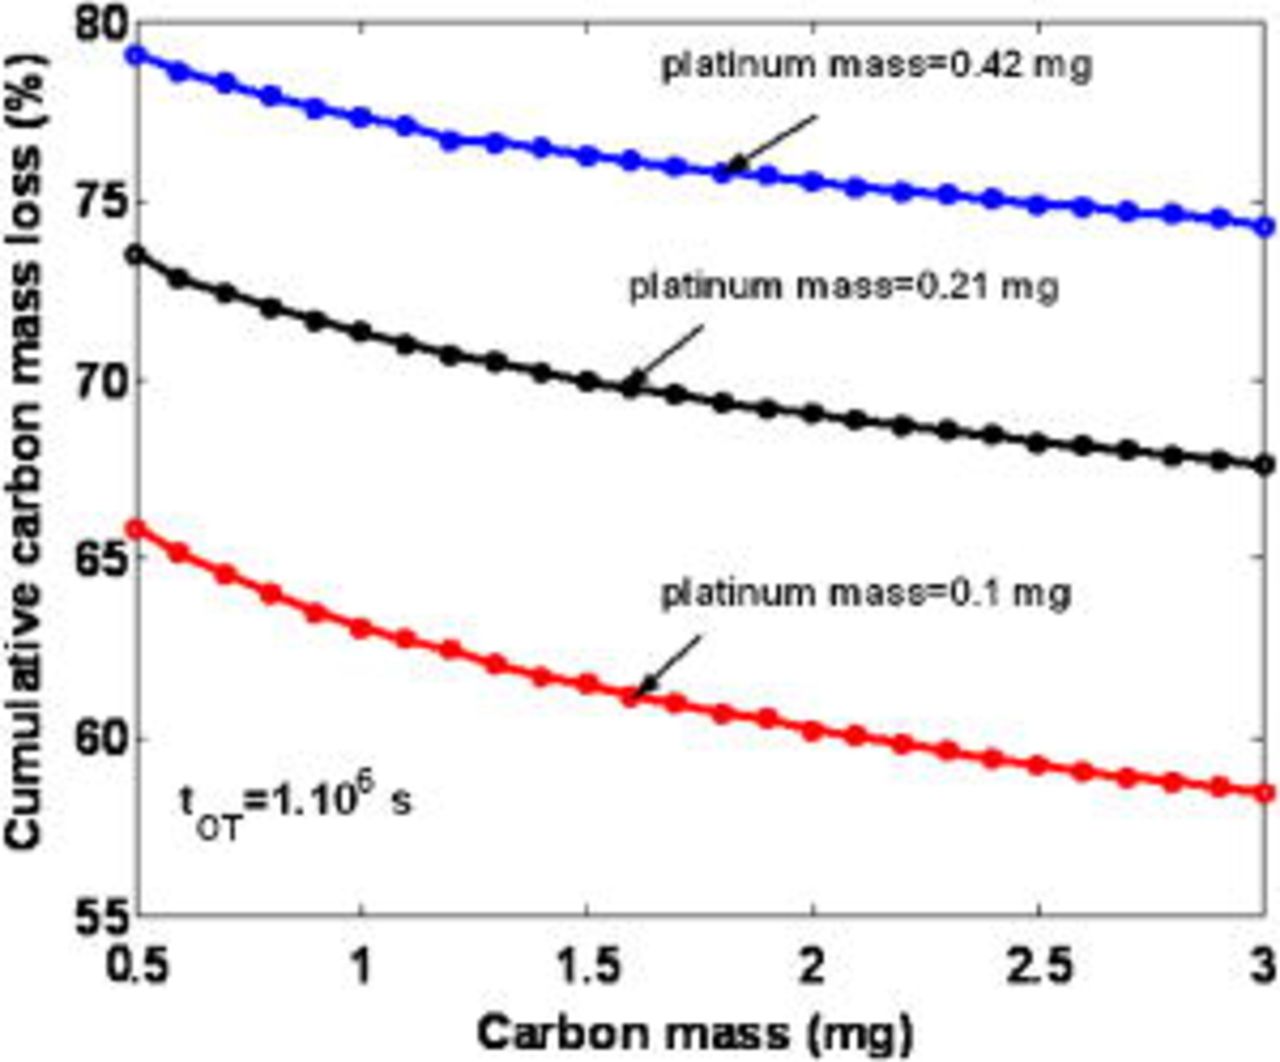
Figure 27. Simulated impact of the initial cathode carbon mass on the cumulative carbon loss for three initial Pt loadings  .
.
Figure 28 illustrates the calculated impact of the platinum nanoparticle radius on the cumulative carbon mass loss for two simulated operation times (in contrast to our previous model in Ref. 5–7, this radius is time invariant here). It can be observed that increasing the radius (decreasing  ) reduces the cumulative carbon mass loss. This is because
  decreases as the radius increases, and then the COR appears to be less catalyzed by the platinum. This theoretical behavior is in agreement with the experimental tendencies provided by Stevens et al.29 and by Adjemian.51
The above analysis means that a mechanism such as the electrochemical Ostwald's ripening [contributing to the mean radius increase with time (cf. Fig. 3 and 10 in Ref. 5)] will contribute to slowing down the COR process.
Figure 29 shows the simulated EIS sensitivity to the platinum nanoparticle radius for two simulated operation times. We emphasize that for the shorter operation time  , the radius does not considerably impact the EIS pattern. At
  , a low-frequency capacitive arc associated with the increase of
  and the oxygen transport limitation appears for the smaller radius considered in the calculations. This also illustrates that performance degradation is faster for small catalyst nanoparticle radius, in agreement with results discussed in Fig. 28.
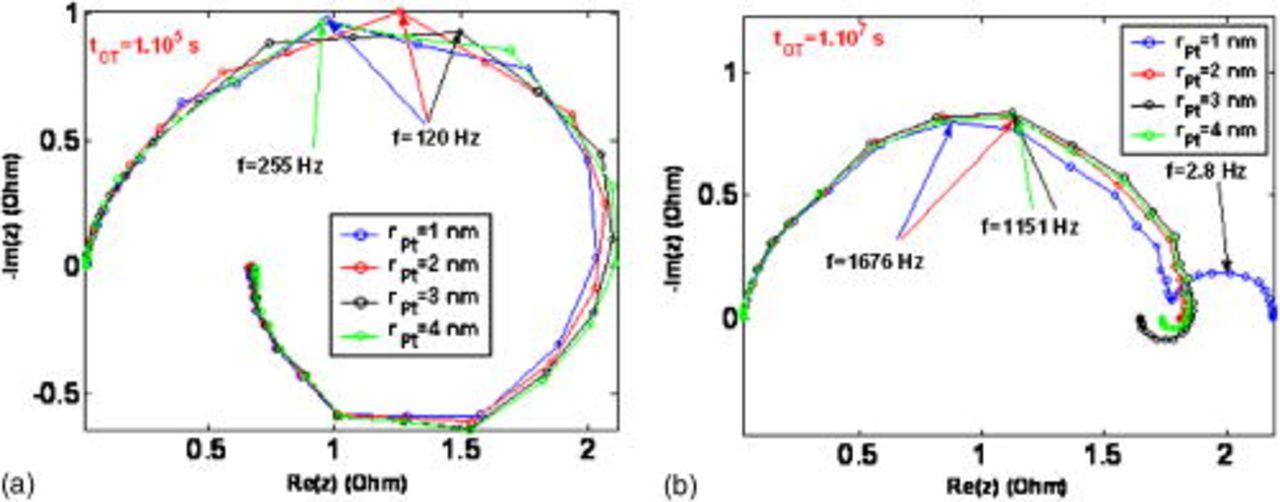
Figure 29. Simulated impact of the Pt grain radius on the EIS pattern for two operation times.
Conclusion
In this work, we have proposed a first-step model describing the coupling between the cathode carbon catalyst-support corrosion and the electrocatalysis phenomena taking place in a PEFC MEA, operating with fully hydrated reactant gases. The electrocatalysis description includes our previously introduced irreversible thermodynamics models of the electrochemical reactions on Pt (HOR/ORR) coupled with the Pt/ionomer interface double-layer structure.
The proposed model describes, mechanistically, the feedback between the instantaneous MEA performance and the intrinsic cathode carbon oxidation process. In each time step, both the effect of the performance on aging and the effect of aging on the performance are described.
Because of its continuum character, the model could be easily integrated into a more global multiscale model of PEFC response; in our opinion, this is interesting for PEFC engineering practice. The proposed model explicitly represents the different physicochemical phenomena as nonlinear submodels in interaction (modular character) and allows one to study the impact of the operating conditions (nominal current, reactant gas pressures, temperature, etc.) and the initial electrode compositions (carbon and platinum loadings) on the PEFC MEA instantaneous performance and durability.
Numerical simulations have been performed in an in-house computational code (Matlab/Simulink), showing qualitative agreement with already reported experimental behaviors and allowing one to gain a deeper understanding of the governing processes. In particular, the model captures the impact of the simulated operation time on the EIS patterns (temporal multiscale character). The simulations also suggest some other interesting features not yet observed experimentally, such as the existence of an "optimal" external current inducing a maximal durability. Dedicated ex situ (half cells) and in situ (monocells) experiments are now occurring in our group in order to validate these model predictions.
Moreover, further theoretical developments are necessary to improve our model. Ab initio quantum-chemical electronic structure calculations are envisaged in order to better understand the carbon oxidation mechanisms (more thermodynamically favorable pathways, oxidative species, etc.) and to estimate the electrokinetic parameter values with atomistic resolution. We emphasize that we are describing here the electrochemical reactions taking place at the compact-layer level. Thus, our kinetic parameter values cannot be directly compared to the values reported in current mechanistic models, where the electrostatic correction of the activation energy in an electrochemical reaction step is assumed to be given by the electrode potential (defined as  ). Furthermore, from its modular character, the model could be easily coupled with a mechanistic description of the other competing aging phenomena (e.g., coupled oxidation, dissolution, and ripening, taken into account elsewhere,5–7 or the ionomer chemical degradation).
Additionally, water transfer is a major task in low-temperature PEFCs operating without fully hydrated reactants. It has been demonstrated in particular that the rate of cathode carbon corrosion during cold-start/hot-stop cycling of a PEFC, is strongly influenced by reactants relative humidity.52 In order to extend our model application domain, we plan to couple this model with an irreversible thermodynamics description of the water transfer through the MEA thickness.53, 54
At the present state, the model is supported on spatial averages of microstructural transport properties (e.g., diffusion coefficient of reactants through the ionomer phase) and on mathematical relations describing cathode/GDL contact resistance evolution and COR-driven Pt coarsening. However, cathode mass transport properties are expected to change during the MEA degradation. In the future, we plan to support the transport phenomenological relations and the COR-driven aging descriptions assumed in the model with microscale resolved mechanisms accounting for the aging-induced morphological structure changes.
Commissariat à l'Energie Atomique (CEA) assisted in meeting the publication costs of this article.
List of Symbols

| proton concentration, 
|

| hydrogen or oxygen concentration, 
|

| charged fixed sites concentration (sulfonates of Nafion), 
|

| compact layer thickness, m |

| diffusion coefficient of  in the GDL, in the GDL, 
|

| diffusion coefficient of hydrogen or oxygen in hydrated Nafion, 
|

| diffusion coefficient of protons in hydrated Nafion, 
|

| cathode layer thickness, m |

| gas diffusion layer thickness, m |

| channel thickness, m |

| impregnated hydrated Nafion layer thickness, m |

| membrane thickness, m |

| electric field, 
|

|
|

| Faraday's constant, 
|

| protonic conductivity, 
|

| current demanded by the external load, A |

| reverse current produced by the carbon oxidation reaction, A |

| total current crossing the direct fuel cell, A |

| local electronic current density at the electrochemical interface ( /electrolyte -anodes 1 and 2-, Pt/electrolyte -cathode 1-, C/electrolyte -cathode 2-), /electrolyte -anodes 1 and 2-, Pt/electrolyte -cathode 1-, C/electrolyte -cathode 2-), 
|

| hydrogen or oxygen molar flux in hydrated Nafion, 
|

| proton molar flux in hydrated Nafion, 
|

|
 molar flux in the cathode or in the gas diffusion layer, molar flux in the cathode or in the gas diffusion layer, 
|

| electronic standard rate constant, 
|

| fraction of the total anode platinum surface area exposed to hydrogen (anode 1) |

| contact resistance constant (cathode), Ω |

| diffuse layer thickness, m |

| cathode carbon mass, kg |

| carbon molar mass, 
|

| anode or cathode platinum mass, kg |

| fractal order |

| maximal quantity of free sites per unit of area of electroactive phase, 
|

| Avogadro's number, 
|

| water saturation pressure, Pa |

| cathode total pressure, Pa |

| anode total pressure, Pa |

| hydrogen or oxygen partial pressure in the pore phase, Pa |

| inlet or outlet gas flow in the cathode channel, 
|

| ideal gas constant, 
|

| cathode/gas diffusion layer contact resistance, Ω |

| platinum nanoparticle radius, m |

| geometric surface of the membrane-electrodes assembly, 
|

| specific platinum or carbon surface area, 
|

| absolute temperature, K |

| simulated operation time, s |

| total volume occupied by carbon in the cathode, 
|

| electrochemical reaction rate, 
|

| cathode platinum mass ratio, % 
|
Greek Symbols
| α | elementary reaction step electronic transfer coefficient |
| β | cathode thickness evolution law constant |

| platinum or carbon surface area, 
|

| dipolar chemical adsorption energy, 
|

| carbon oxidation reaction chemical activation energy, 
|

| electric permittivity of vacuum, 
|

| electric permittivity in the inner layer, 
|

| electric permittivity in the diffuse layer (electrolyte phase), 
|
| η | electrostatic potential difference between the electro-active and the electrolyte phases (through the compact layer), V |
| covering fraction of dipoles opposed to the electroactive phase |
| θ⃖ | covering fraction of dipoles oriented toward the electroactive phase |

| covering fraction of free sites |

| covering fraction of the intermediate reaction specie Hs |

| covering fraction of the intermediate reaction specie OHs |

| covering fraction of the intermediate reaction specie 
|

| covering fraction of the intermediate reaction specie O |

| water surface fraction on the electroactive catalyst surface |
| λ | number of water molecules per sulfonate site |
| μ | dipolar moment of a water molecule, 
|

| platinum or carbon density, 
|
| σ | electronic surface density, 
|
| ϕ | electrostatic potential in the electrolyte phase, V |
| ψ | electrostatic potential in the electroactive phase (Pt and C), V |
: Appendix A: Diffuse Layer Ionic Transport Approximation
For the calculations shown in this paper, in a first approximation, we assume that proton transfer occurring in the nanoscale diffuse layer is quasistationary. By neglecting the temporal term in Eq. 36, we obtain

with  for the anode and
  for the cathode (
 being the surface normal to the catalyst).
In the cathode, we have at 

and by rearranging terms

The proton concentration at  is given by

with

where  is the electrostatic potential in the electrolyte that can be calculated by the Poisson's equation (Eq. 37). This potential can be approximated by
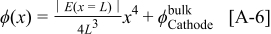
which reproduces, quite well, the numerical solution of coupled partial differential Eq. 36, 37 obtained by the finite element method.5–7, 36–40
Thus,  becomes
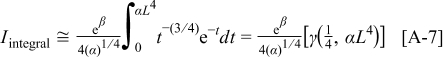
with  and
and  , and where
  is the incomplete gamma function. For the anode case, mathematical expressions are similar and we can show that

with

and

Footnotes
- a
In a more complete model, these pressures could be calculated by describing the transient oxygen permeation through the PEM.
- b
An activity of 1 means that carbon phase is pure, and an activity of 0 means that the carbon phase is not present in any amount. In fact, we imagine carbon as a pure solid phase at
(activity equal to 1). Then, during carbon oxidation, complex surface oxides (impurities, represented in our model with the intermediate specie O) appear, affecting the energetics of the system and the ability of the carbon to react and decreasing its activity with time. Obviously, Eq. 66 constitutes only a first approximation model (activities depend not only on composition, but also on pressure and temperature). - c
