Abstract
 is a promising electrode material for high power density lithium-ion batteries and hybrid supercapacitors, but has the drawback of low electrical conductivity. We report a thermal vapor decomposition method to coat a uniform nanothickness graphitized-carbon on the
  particle surface. The resulting product coated at 800°C has a
  thick carbon layer and a electrical conductivity of
  , which is much higher than that of raw
  . As a result, it shows much better rate capability when used as a negative electrode for electrochemical supercapacitors. AC impedance measurements reveal that the carbon-coated
  has smaller charge-transfer resistance due to large effective interface reaction area.
Export citation and abstract BibTeX RIS
An electric vehicle (EV) powered by a rechargeable lithium-ion battery or a electrochemical supercapacitor with both high power and high energy densities is an ideal solution to reduce environmental pollution.  intercalated compound
  (LTO) has been demonstrated to be one of the most promising electrode materials for such applications, because it has a flat voltage range, high reversible capacity
  , and especially the long cycling performance due to no structural change (zero-strain insertion material) during charge–discharge cycling.1–6 However, the drawback of its poor electrical conductivity
  7 still prohibits it from wide practical application. Two typical approaches have been developed to overcome this problem: one is to develop the nanosized LTO.8, 9 The nanosized particle can reduce the lithium-ion diffusion path, thus improving the rate capability, as well as provide large contact surface area with electrolyte and electronic conductive material. The other way is to reduce the electrode polarization by improving its electrical conductivity, which often modifies
  with noble metal nanoparticles or their oxides such as Ag or
  .10, 11 Although this treatment process really works, the high cost and complicated working procedure can be an obstacle. Until now, no effective way has been developed to achieve a high electrical conductivity LTO. Carbon-coating as one kind of surface treatment method has been managed in several kinds of electrode materials such as
  , natural graphite, etc., because of its low cost and efficiency.12–16
Herein, we report a thermal vapor decomposition (TVD) method to coat a nanothickness graphitized-carbon on the  particle surface. The effects of coated carbon on the electrical conductivity, as well as the electrochemical profile used as the electrode material for hybrid supercapacitors were extensively investigated. The mechanism responsible for the improved rate capability was also studied.
Experimental
 (anatase,
  ) and
) and  were mixed by the molar ratio of 2.5, and then heated at 800°C for
  to obtain well-crystallized
  (raw LTO). The
  powder was transferred into a reaction tube to make a fluid-bed layer for a reaction where a toluene vapor was carried by nitrogen gas through the reaction tube at a flow rate of
  . The reaction temperature was maintained at 650, 700, 750, 800, 850, and 900°C, respectively, for
  to prepare a series of samples designated as LTO/C for characterization.
The morphologies of the LTO/C particles were characterized with a Joel JEM2010 transmission electron microscopy (TEM). The XRD patterns of these samples were recorded by a Bruker Advance 8 X-ray diffractometor. The thermogravimetric (TG) of the LTO/C sample was measured by a Perkin-Elmer TGA 7 thermal analyzer. Raman measurement was taken by a Dilor Labram-1B spectrograph.
The dc electrical conductivity was measured by a direct volt-ampere method on disk samples prepared by pressing the powder up to  , which ensures that the conductivity reaches a stable value. Their diameter and thickness were
  and
and  , respectively. Electrical conductivity measurement was carried on Solartron Instruments model 1287 electrochemical interface controlled by a computer.
The raw LTO electrode was prepared by mixing  active material,
  carbon black, and
  poly(tetrafluoroethylene) (PTFE) dispersed in isopropanol. For the LTO/C electrode,
  carbon black was added to keep the same carbon content in the composite electrode as the carbon coated LTO contains about
  carbon. The slurry was cast on a steel current collector, and dried at 80°C for
  to remove the solvent before pressing. The electrodes were punched to be a disk with a diameter of
  for the half-cell test. The activated carbon (AC) electrode was prepared by the same process except that the slurry was made of
  activated carbon,
  carbon black, and
  PTFE dispersed in isopropanol. The LTO (both of the raw and the carbon-coated LTO) and the AC electrodes were dried in a vacuum oven at 80°C for
  before assembling. The typical active material mass load of LTO is
  and
and  of activated carbon for the AC electrode.
For the half-cell test, the  electrode was assembled with lithium metal negative electrode. The electrochemical tests were carried on coin-type cells (CR2016) which were assembled with positive electrode/separator/negative electrode in an argon filled glove box. As for the hybrid supercapacitor assembling, the AC electrode was used as the positive electrode and LTO electrode was used as the negative electrode; the electrode area of both electrodes was
  and used a glass cell. The electrolyte solution was
  /ethlylene carbonate (EC)/dimethyl carbonate (DMC)/ethyl methyl carbonate (EMC) (1:1:1 by volume).
The electrochemical performance of the half cells and supercapacitors were evaluated using a battery test system LAND CT2001A model (Wuhan Jinnuo Electronics Co., Ltd.). The changes in the electrolyte/LTO interface resistances were also evaluated by monitoring the dependence of the impedance response on the carbon contents at the discharge states. The experiments were carried out using a three-electrode cell, in which the lithium metal was used as both the counter and reference electrodes, and it was performed using a Solartron Instruments model 1287 electrochemical interface and 1255B frequency response analyzer controlled by a computer. The frequency limits were typically set between  to
to  . The ac oscillation was
  .
.
Results and Discussion
Characterizations of carbon-coated 

Figure 1 compares the powder X-ray diffraction pattern of the raw LTO and carbon coated LTO (LTO/C) obtained at the temperature of 800 and 900°C. The results in Fig. 1 reveal that all resulting products show the same XRD patterns. The major diffraction peaks at  equal 18.4, 35.6, 43.3, 47.4, 57.2, 62.8, 66.1, 74.3, 75.4, and 79.4° were found. Neither the new lithium titanium oxide phase nor carbons were detected. The product can be indexed to spinel structure
  . The absence of carbon in XRD patterns is most likely due to the low content or amorphism. The absence of new lithium titanium phase even at the coating temperature of 900°C suggests that
  is stable under a reduction atmosphere up to 900°C or the new phase with low Ti valence was formed but its XRD intensity is too weak (very low content) to be detected in the XRD.
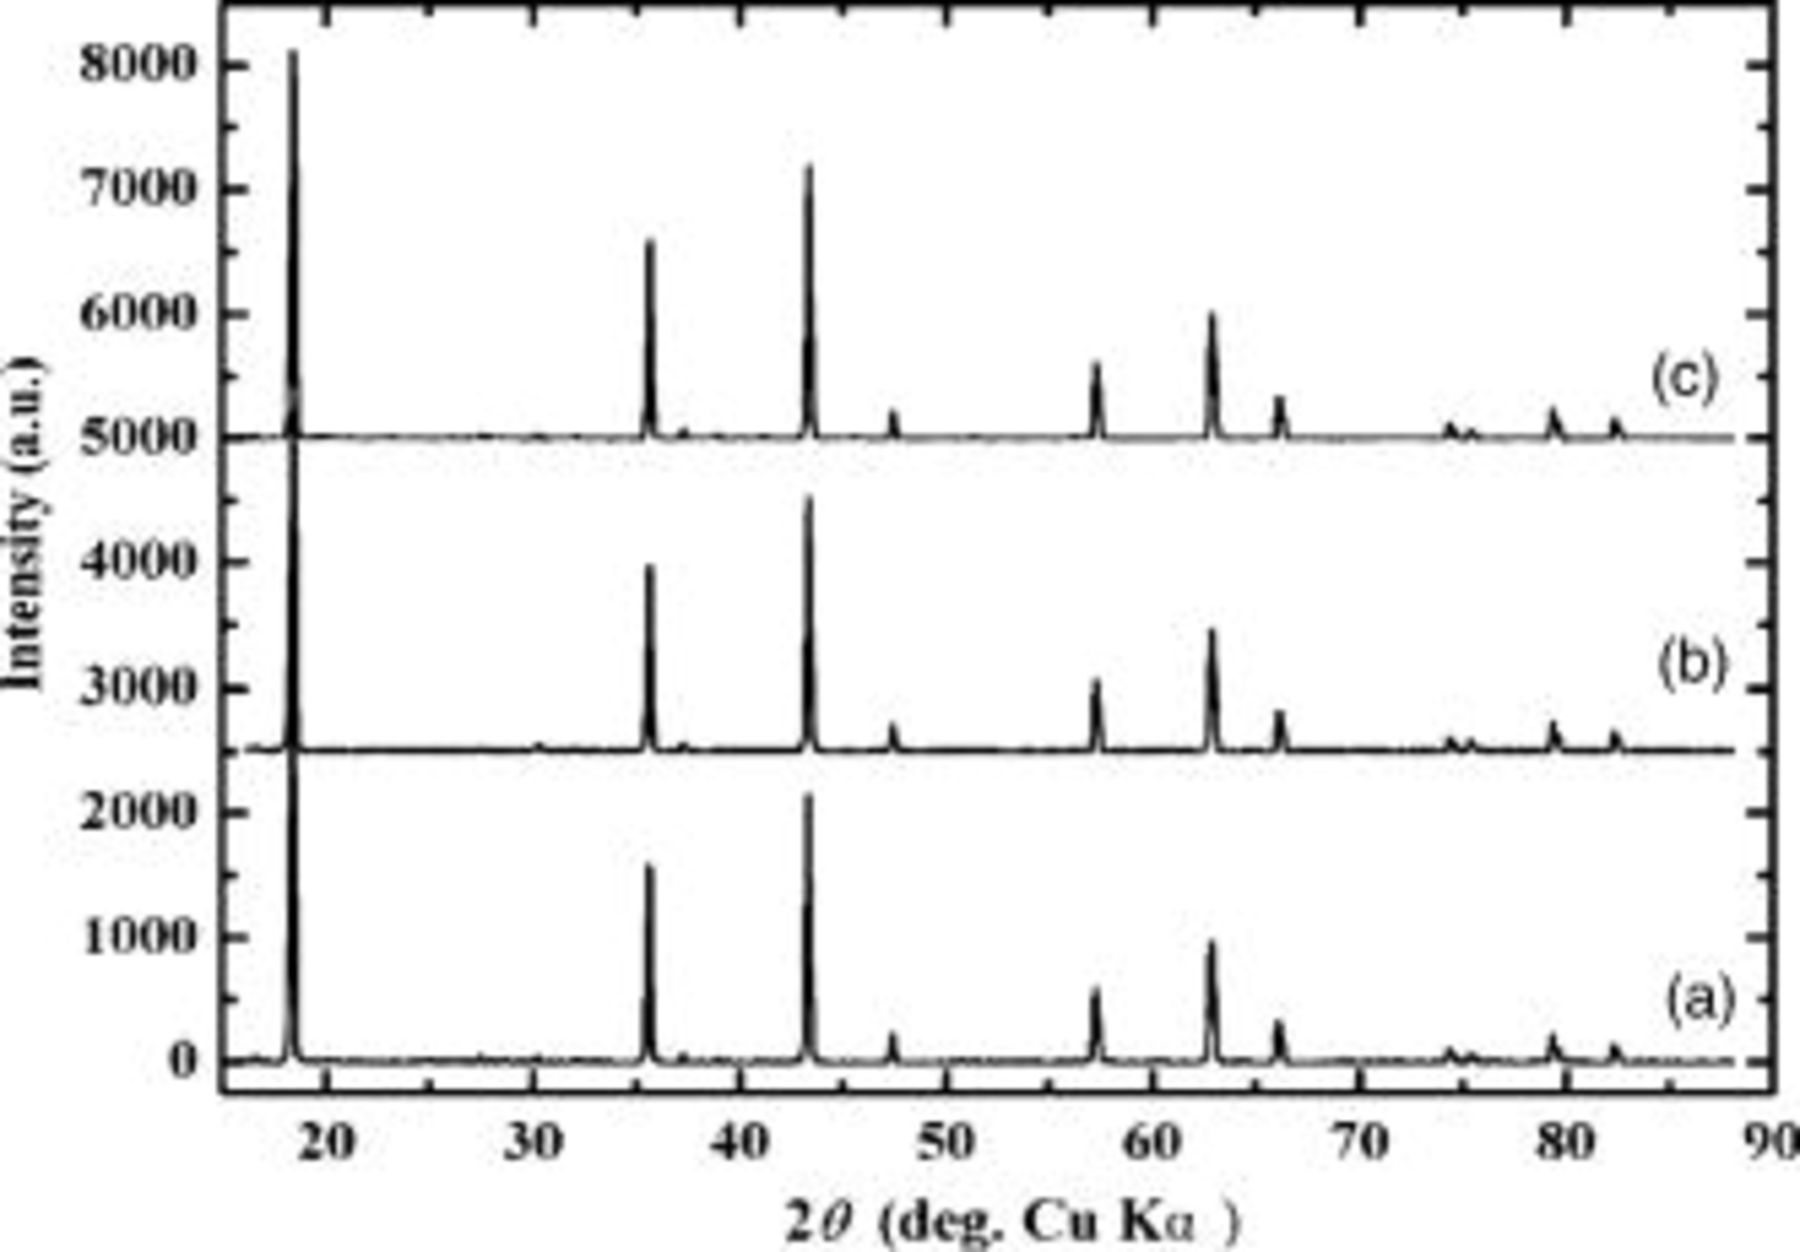
Figure 1. XRD patterns of raw and carbon-coated  (a) raw LTO, (b) LTO/C 800°C,
  , and (c) LTO/C 900°C,
  .
.
A series of carbon coated LTOs were prepared under different treating temperatures, varying from 650 to 900°C by steps of 50°C. The TG analysis shows the carbon contents of all samples were about  (Fig. 2), and color distribution changed from gray to black with the increase of treating temperatures, suggesting that the electrical conductivity increases as coating temperature increases. The electrical conductivity was measured by a direct volt-ampere method on disk samples. Figure 3 shows the electrical conductivity of a series of carbon-coated
  samples. The conductivity increases nonlinearly, and increases fast at temperature over 800°C. The conductivities of the LTO/C are 2.05 and
  at coating temperature of 800 and 900°C, respectively, which is much higher than that of the raw LTO
  . In other words, the LTO has been transferred from an insulator to an electronic conductor with the coating carbon by the TVD process.
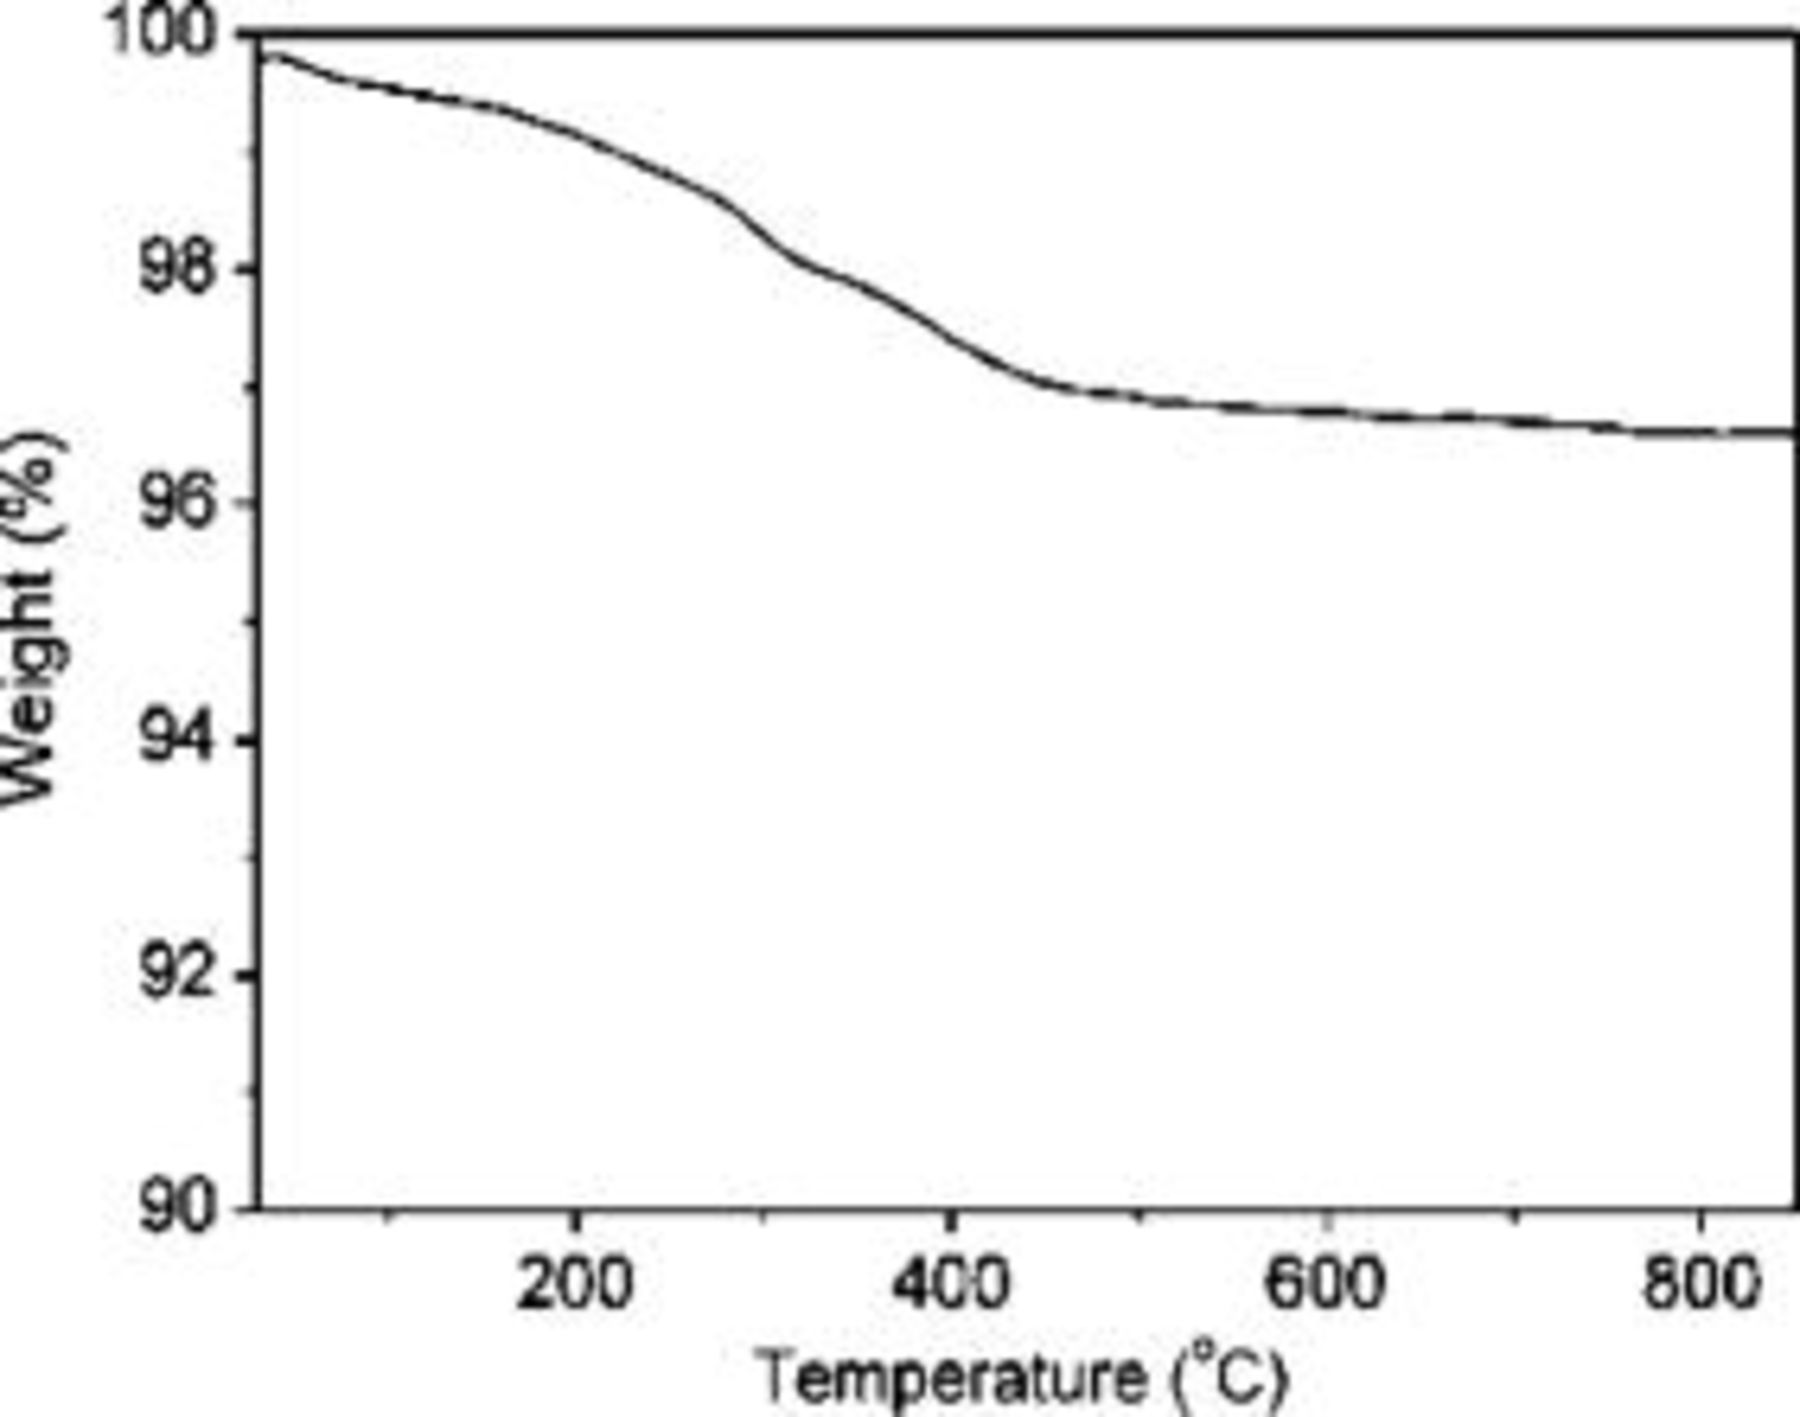
Figure 2. TG curves of 800°C LTO/C sample measured in air with a heating rate of 10°C per min.
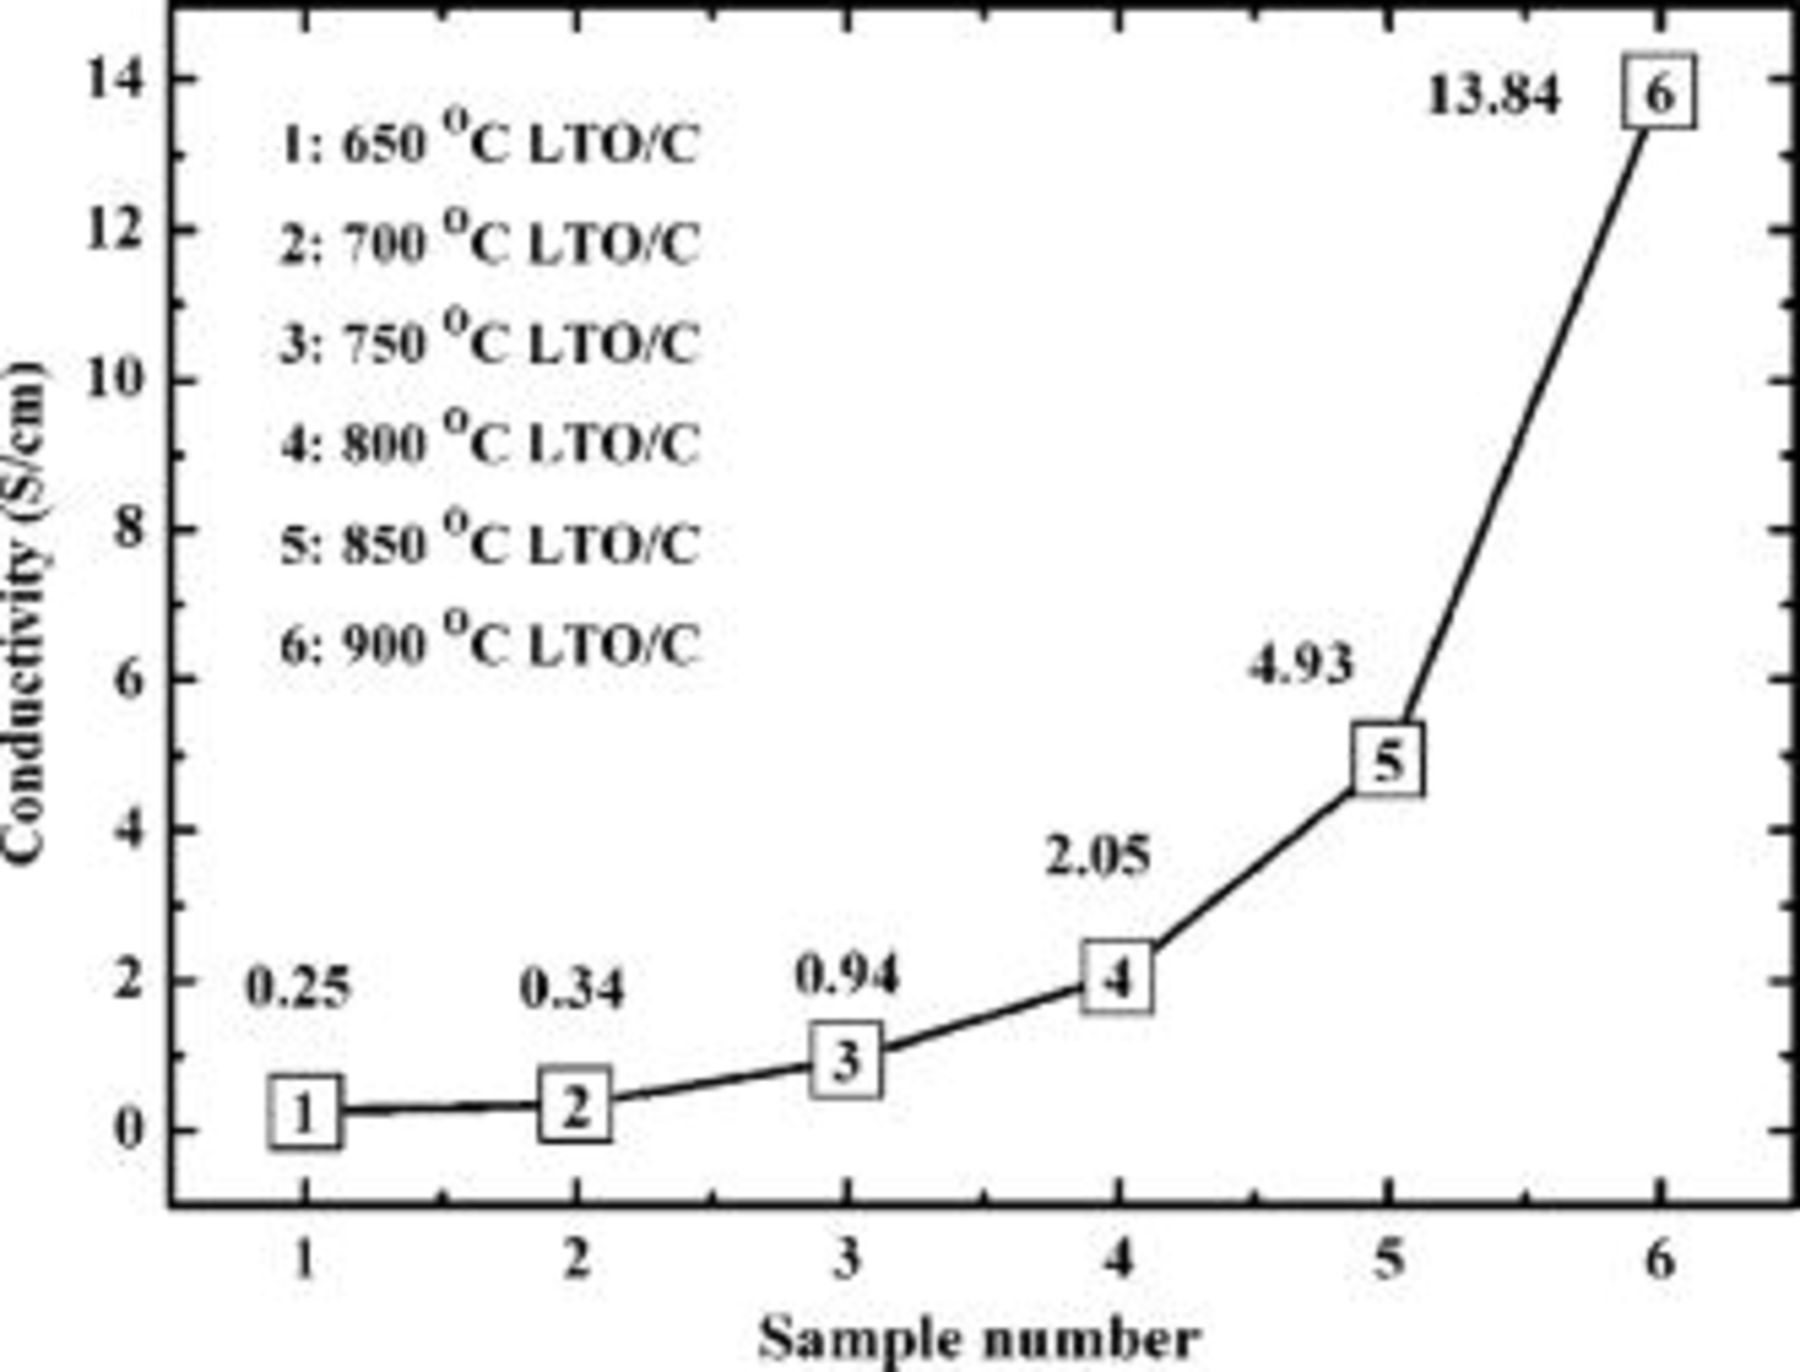
Figure 3. Electrical conductivity of carbon-coated  (LTO/C) prepared under different conditions.
Figure 4 shows the TEM views of LTO/C samples obtained at coating temperature 650, 800, and  . The TEM images show that all of the samples have been coated with a uniform carbon layer connecting tightly with the LTO particle. The TEM images indicate that the thickness of the carbon layer is about
  . When the treating temperature increases, the graphitization of coated carbon increases: the layer structure was much more clearly seen in the sample obtained at high coating temperature, suggesting that the carbon has been transferred to graphite at a certain extent, and has a high electrical conductivity. The result agrees well with the conductivity data. It can be expected that the much higher electrical conductivity can be achieved when the coating temperature is further increased. However, it results in the LTO structure change, as shown in the electrochemical test blow. Unfortunately, little difference in the LTO/carbon interface was observed between the samples at 800 and 900°C by TEM observation, even the sample obtained at 900°C shows a nonuniform discharge curve as shown below. It is highly possible that
  may lose oxygen, giving rise to an oxygen-defect LTO according to the following reaction

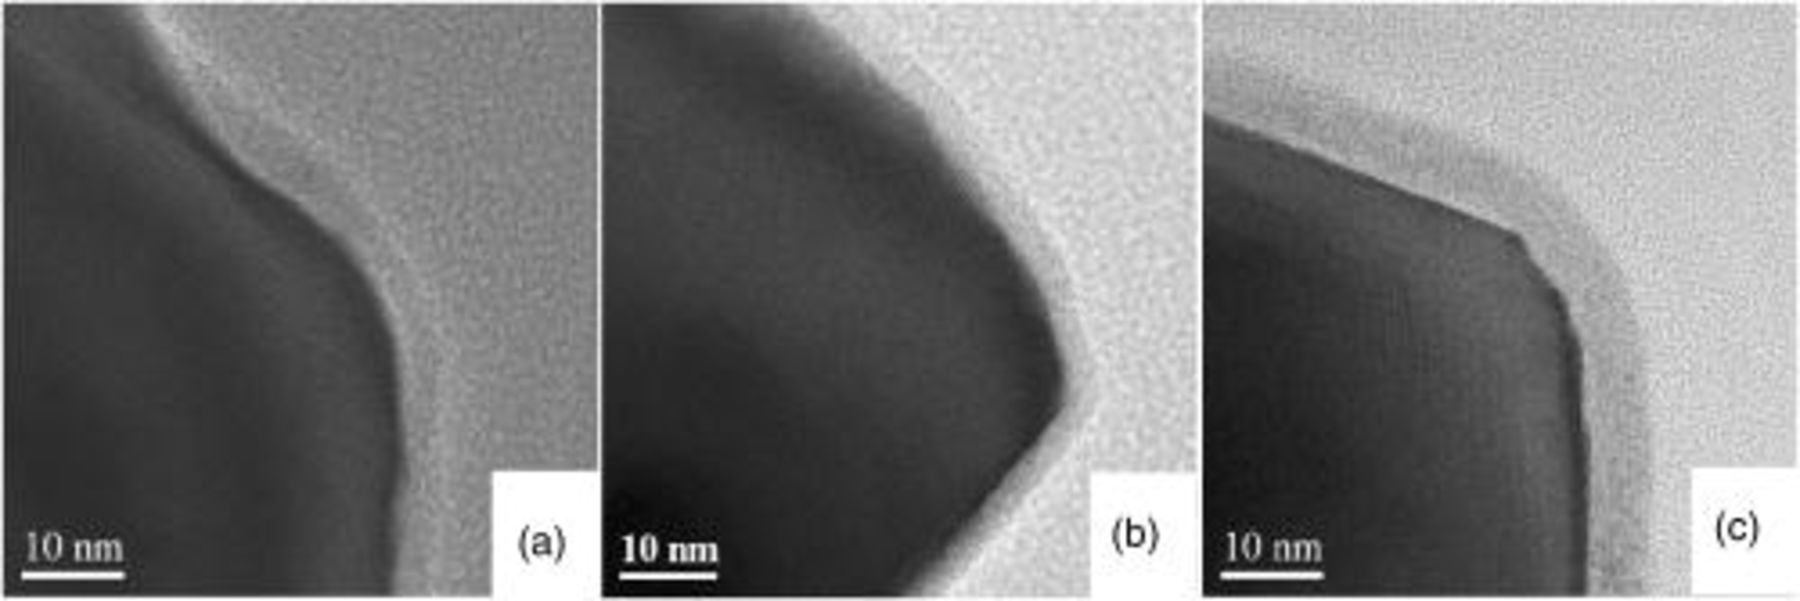
Figure 4. TEM images of carbon-coated  under different temperatures. (a) 650, (b) 800, and (c) 900°C.
It is well known that the electrical conductivity of carbon material is critically dependent on its graphitization. To examine the graphitization of carbon layer, Raman spectroscopy was employed. The Raman spectra of three selected representational samples of LTO/C obtained at coating temperature 650, 800, and 900°C are shown in Fig. 5. All of the Raman spectra consisted of intense broad bands at 1350 and  that can be assigned to the D and G bands of the disordered and graphitized carbons, respectively. The relative intensity of the D band vs G
  band is attributed to increased carbon disorder.17 For the samples 650, 800, and 900°C LTO/C, the
  numerical values are 1.47, 1.30, and 1.17, respectively. It can be concluded that the graphitization of the carbon layer improves with the increasing of heat-treating temperature. This result agrees well with the conductivity data and the TEM graphs. Note that, according to the work of Wolfenstine,18
  with mixed valence
  material (oxygen-defect) which was obtained by heating under the
  atmosphere (800°C for
  ) shows an increased electronic conductivity of
  and good rate-capability. As demonstrated above, the electronic conductivity of the carbon coated LTO is 2.05 and
  for the samples coated at 800 and 900°C, respectively, which is much higher than that of
  for the raw
  . From all of the above results, we conclude that the increased electronic conductivity of the carbon coated samples mainly results from the coated carbon layer, rather than the oxygen-deficiency in the LTO.
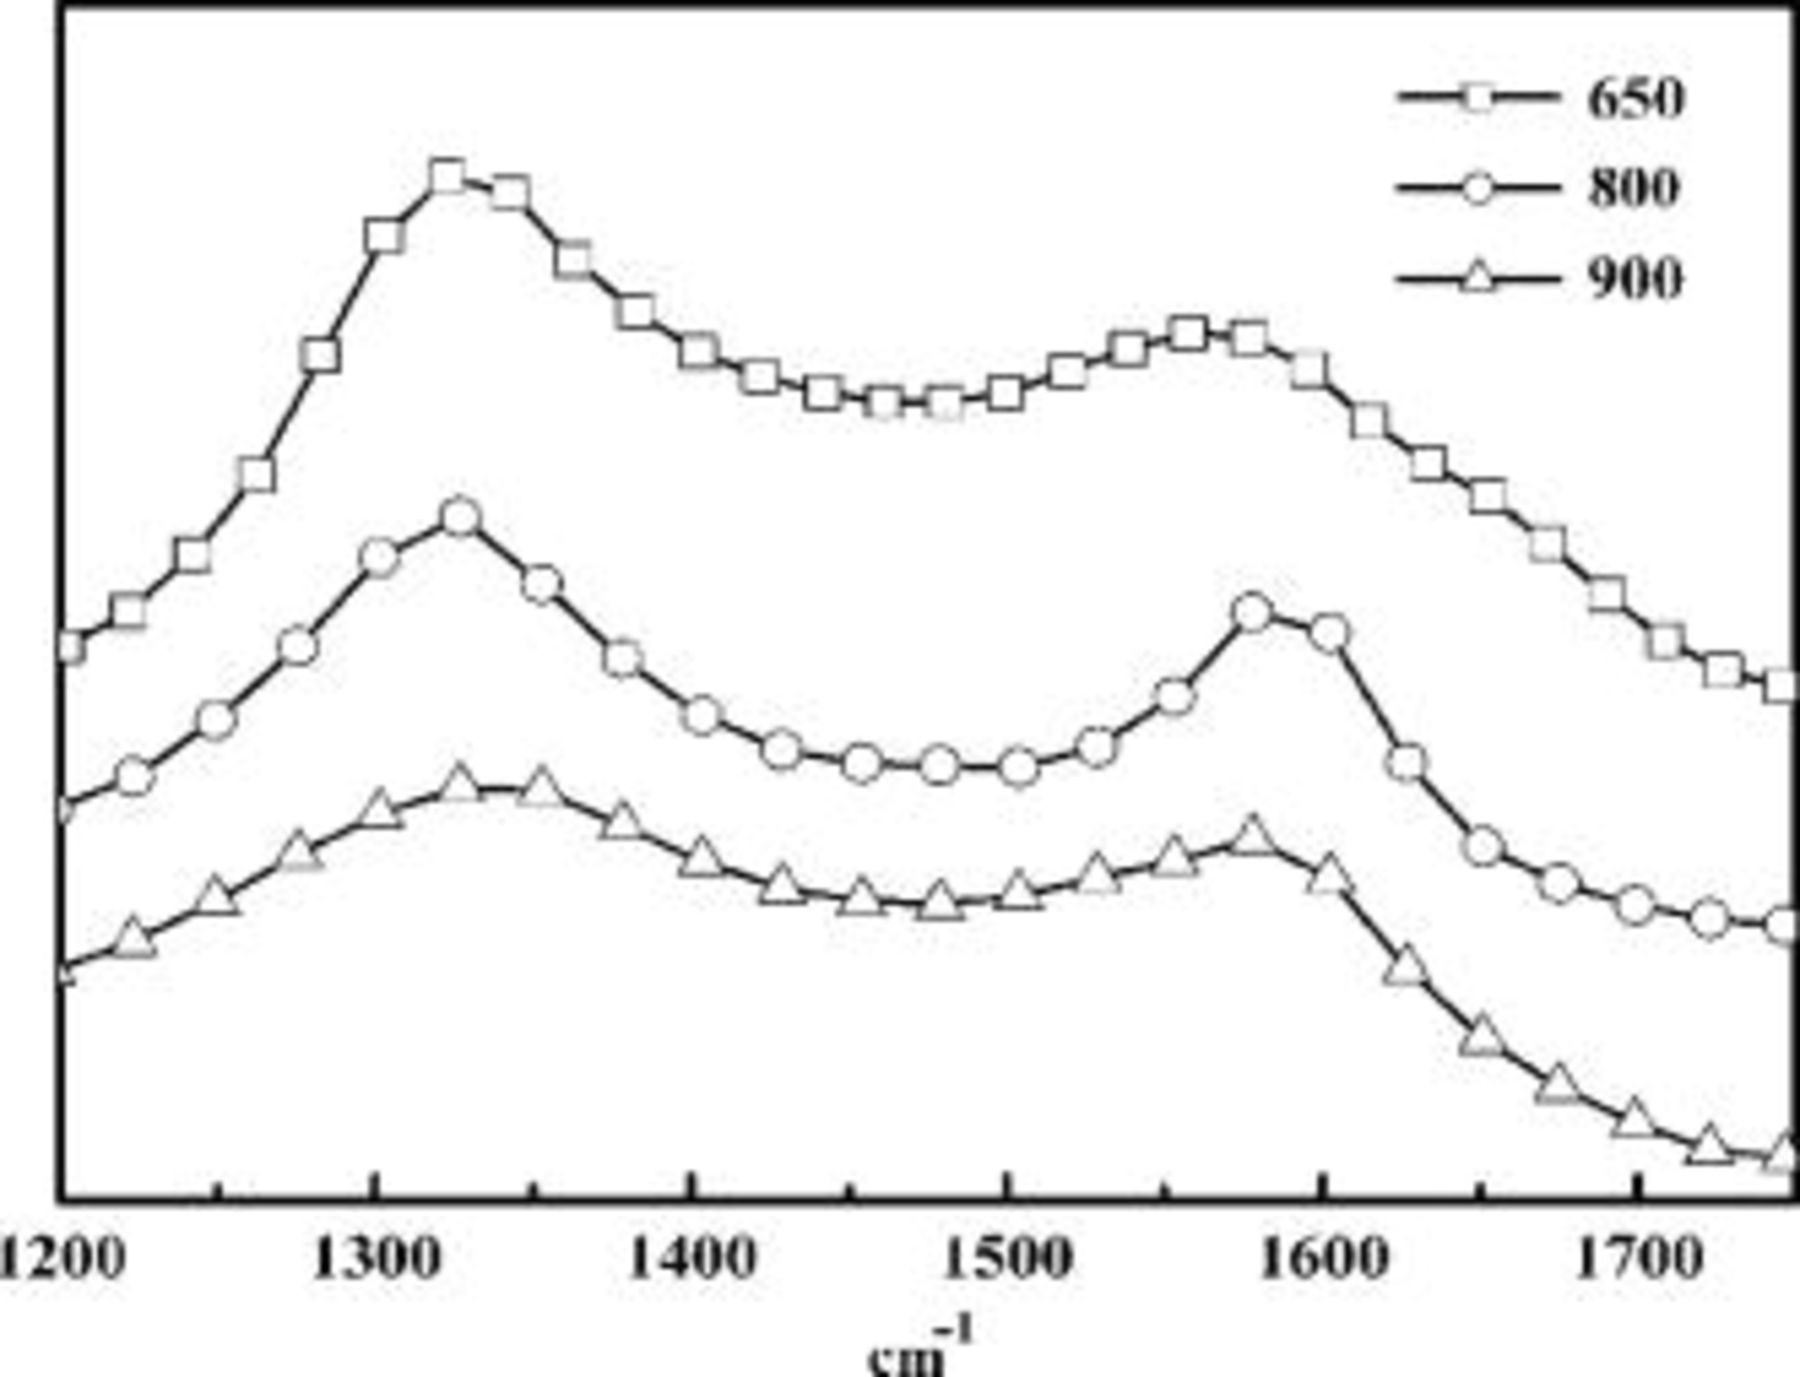
Figure 5. Raman spectroscopy of carbon-coated  powders. From top to bottom Samples
  ,
,  ;
;  ,
,  ; and
; and  ,
,  .
.
Electrochemical performance of the carbon-coated

Figure 6 compares the charge/discharge curves of LTO/C samples obtained at coating temperature at 800, 850, and 900°C with that of the raw LTO sample at a constant current  . The pure LTO has a flat charge/discharge plateau at the voltage about
  (vs
(vs  ), while the charge/discharge plateau departs from the standard potential bit by bit and happens to be gradient when the treating temperature is 850°C or higher. This makes it clear that the samples prepared over 800°C have been partially reduced or deoxidized. The capacity of LTO/C obtained at 800°C is
  based on the weight of composite material, including LTO and carbon (
 based on the sole weight of LTO), which is a slightly lower than
  of the raw LTO. In the case of carbon-coated graphite, it is typically discharged to several mV vs
  ,
,  can intercalate into the coated carbon, and the coated carbon also contributes the capacity together with the bulk graphite.13 In the current instance, the cycle voltage window was controlled from 3.0 to
  vs
vs  , the
, the  almost cannot intercalate into the carbon, and the coated carbon does not contribute the capacity to LTO/C material, while it greatly improves the electrical conductivity of LTO.
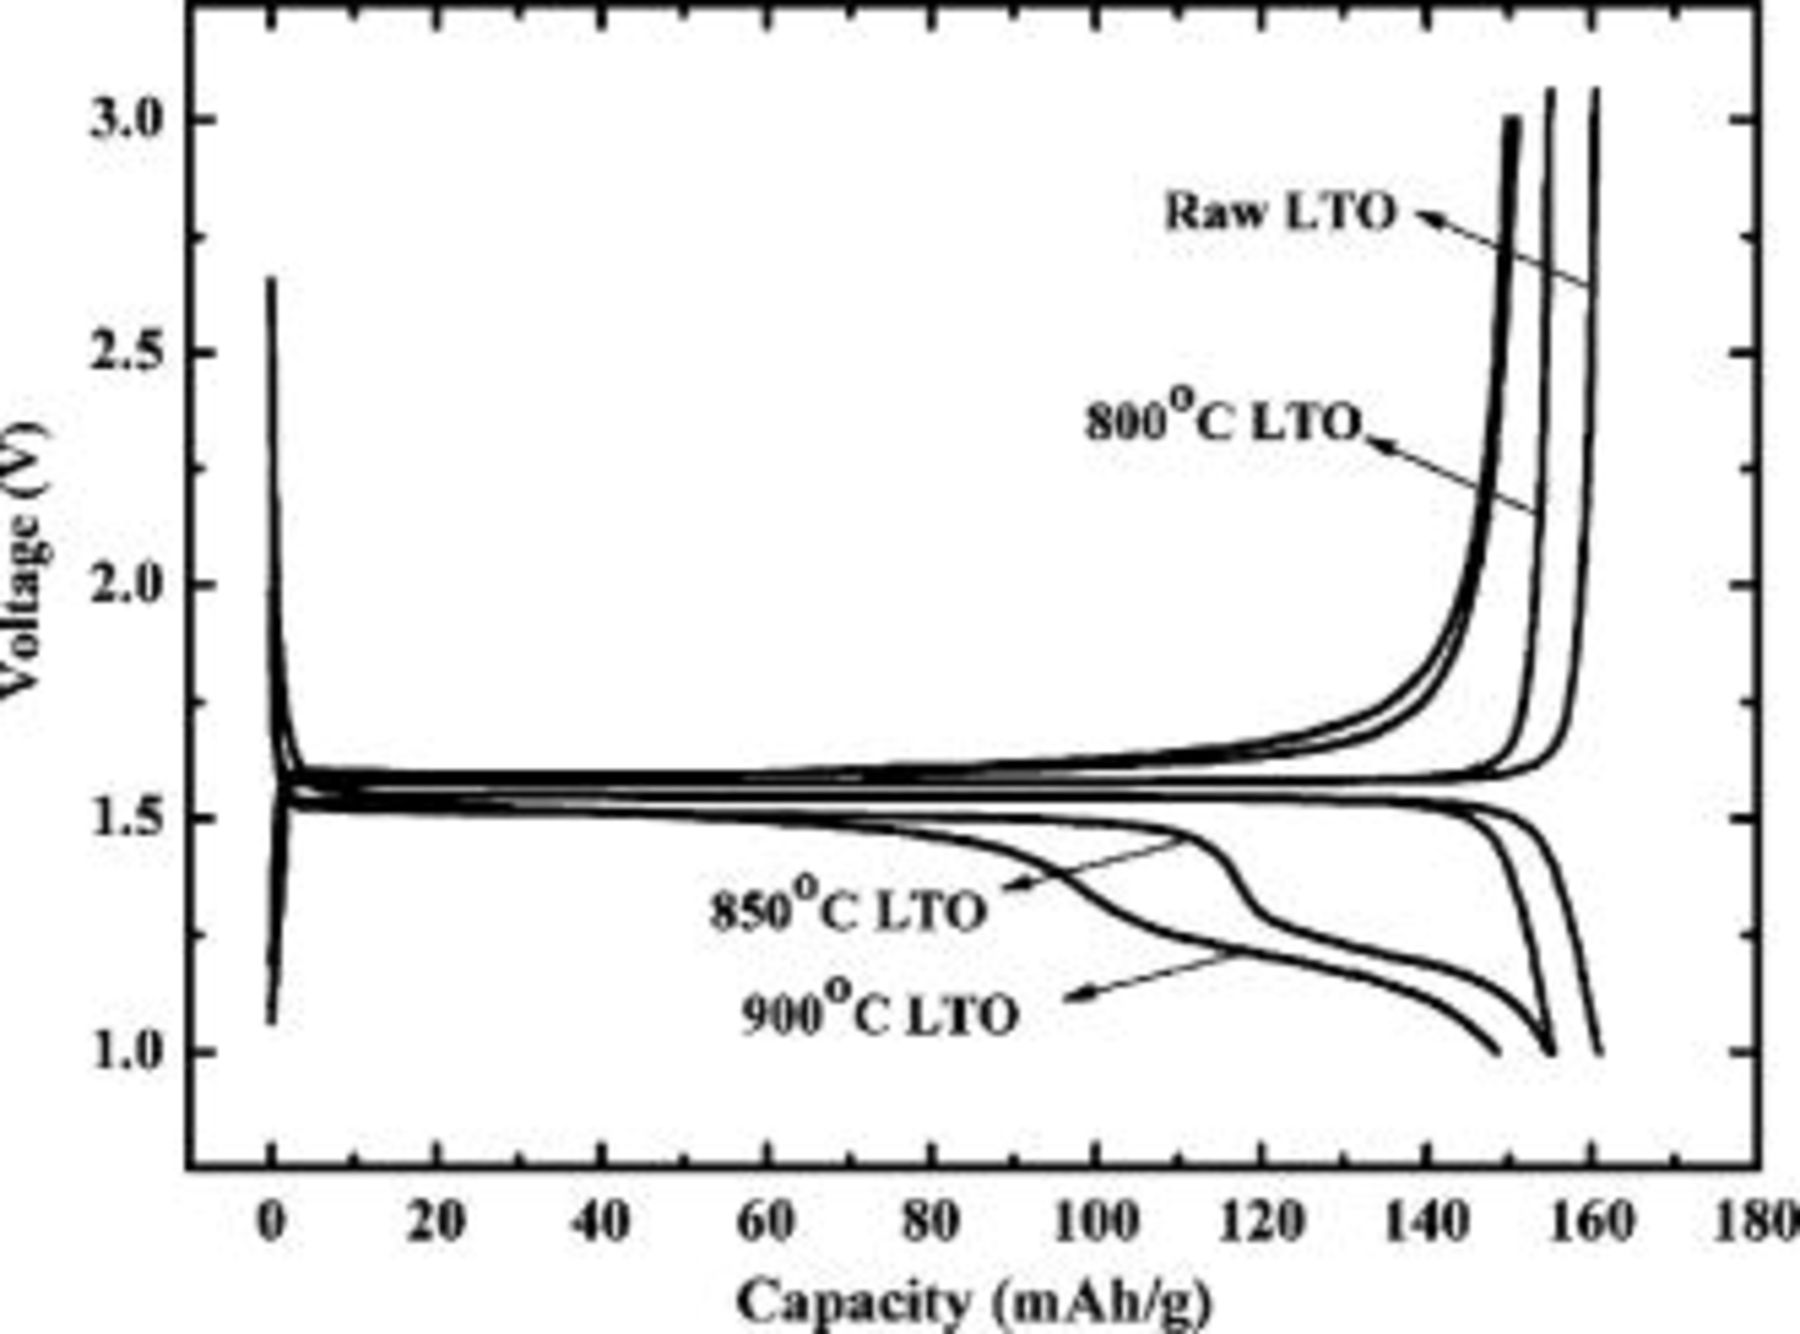
Figure 6. Typical charge/discharge curve of carbon-coated  prepared under 800, 850, and 900°C, and the raw
  . The cell was charge/discharged at a current rate of
  between 1.0 and
  .
.
The rate capability of the raw LTO and 800°C LTO/C was further examined in a hybrid cell in combination with an activated carbon positive electrode at various current rates. The discharge current rates vary from 
 to
to 
 . Figure 7a gives the charge/discharge curves of a hybrid cell containing the carbon-coated sample between 1.5 and
  at a selected current rate of
  . The capacity of the hybrid cell in Fig. 7 was calculated by the total weight of active materials including both electrodes. The results in Fig. 7b clearly show that the 800°C LTO/C sample shows much better rate capability, even at the discharge rate of
  , the hybrid capacitor also retains 50% of capacity compared with
  discharge rate. As to the raw LTO sample, it only retains 29% of capacity. As noted above, for the hybrid supercapacitors, the rate capability is determined by that of
  intercalated compound. The conductivity of
  has a direct influence on the electrochemical performance of the cell. As a result, the 800°C LTO/C shows smaller electrode polarization due to its high electrical conductivity, thus resulting in a better rate capability.
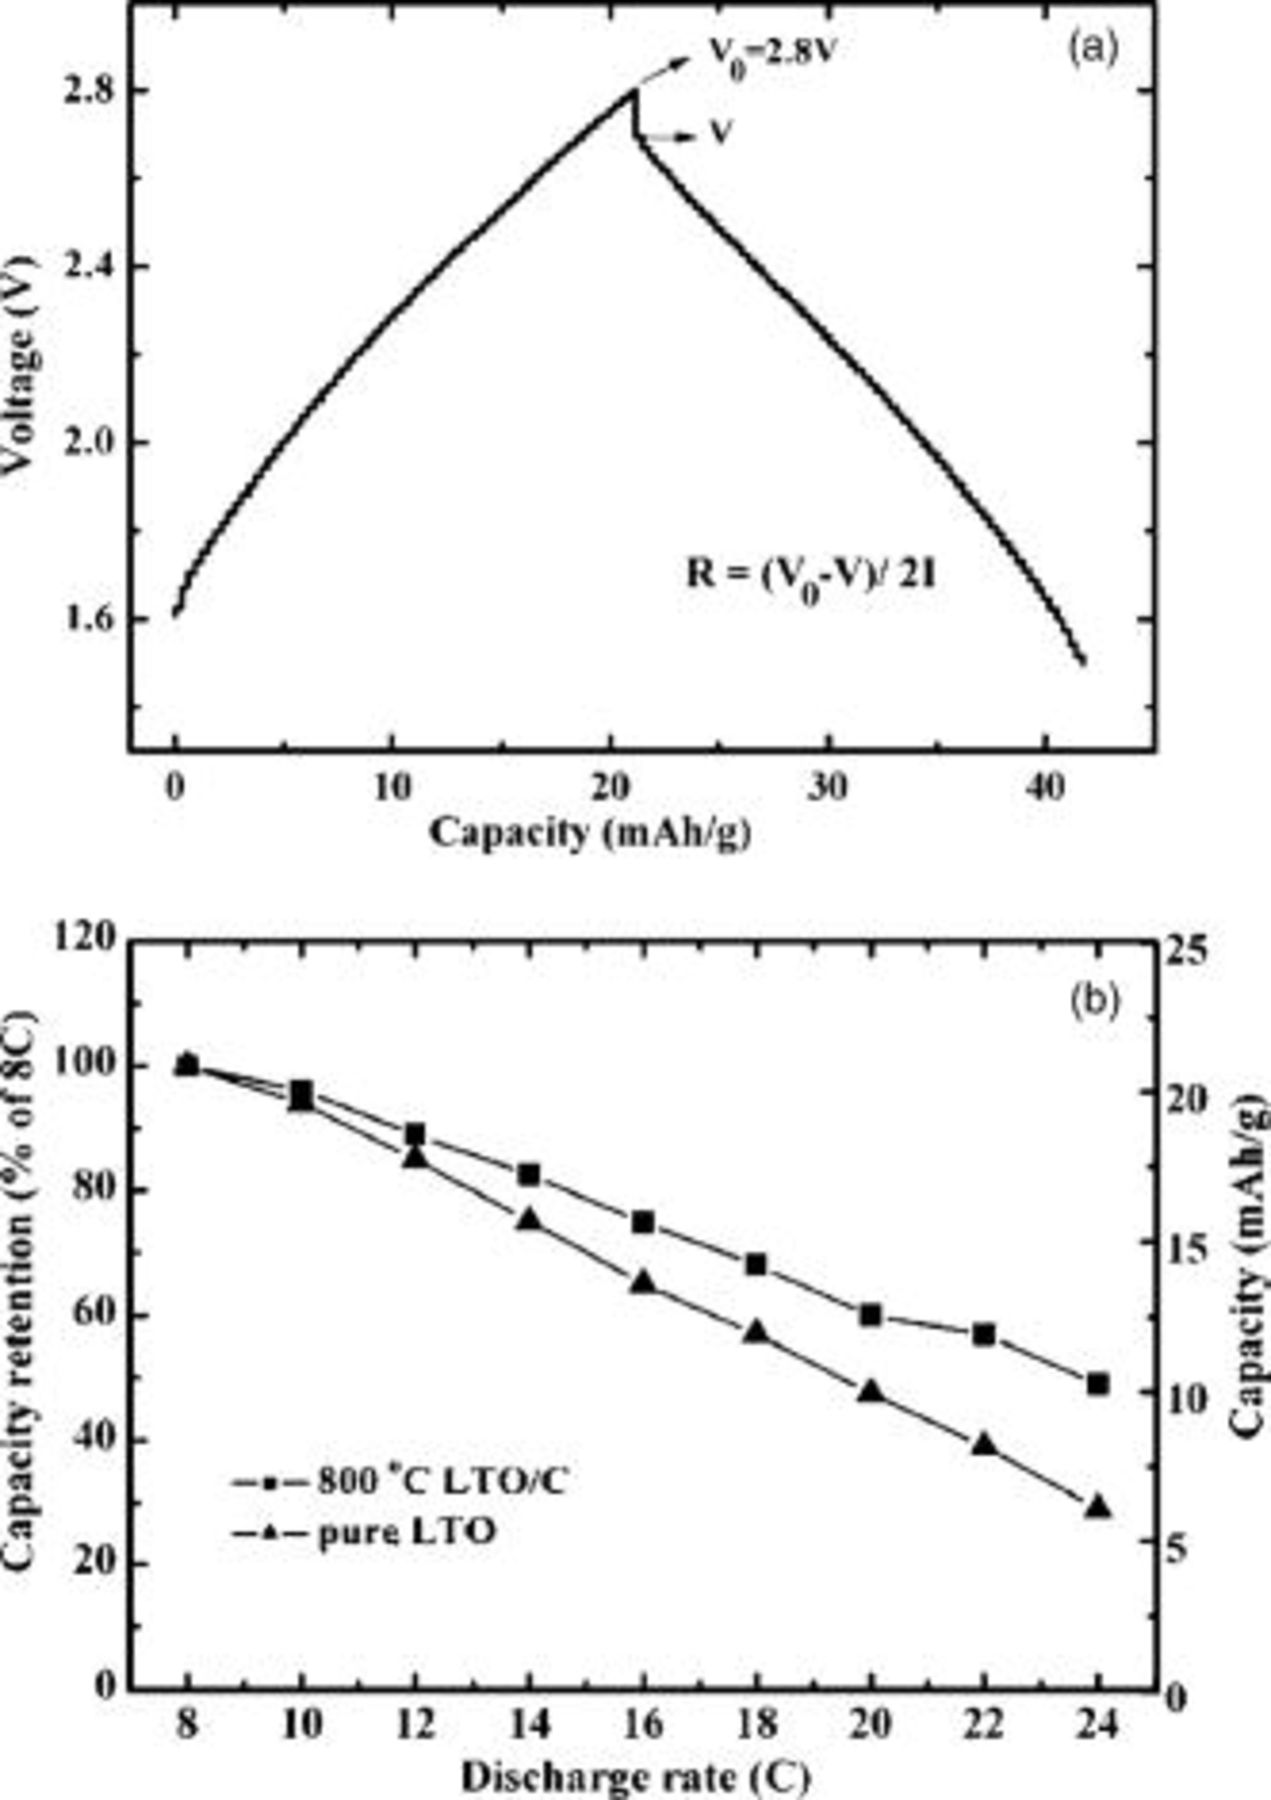
Figure 7. (a) Typical charge/discharge curves of hybrid cell containing carbon coated sample between 1.5 and  at a selected current rate of
  (8C). (b) Rate capabilities of
  hybrid cells:
  carbon-coated
  prepared under
  ,
,  raw
raw  . The current densities vary from
  to
to  , which was calculated by the total weight of active materials including both electrodes. (The results of electrochemical tests are based on a series of cells.)
It is well-known that the electrode polarization typically results from the ohmic polarization, the concentration polarization, and the electrochemical polarization. Apparently, the difference in the concentration polarization between the carbon mixed and carbon-coated samples can be negated. The electrode resistances can be estimated from the charge/discharge curves as shown in Fig. 7a by
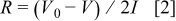
where  is the charge cutoff voltage. In our work, the value of
  is
is  . The symbol
  means the initial discharge voltage at different current rates,
  . The electrode electric resistances are estimated to be 22 and
  for the electrodes containing
  mixed carbon black and carbon-coated sample containing
  carbon black, respectively. These findings suggest that the difference in the electrode polarization mainly results from the electrochemical polarization.
Electrochemical impedance spectra at discharge state
To clarify the issue why the carbon-coated LTO delivers small electrochemical polarization, we applied the ac impedance technique to monitor changes in electrolyte/LTO interface resistance at the discharge state of  electrode containing the different carbon contents. Figure 8 gives the impedance spectra of raw LTO and the LTO/C (sample 800°C,
  ) electrodes mixed with different weight ratios of carbon black at half-discharged states of the first cycle
  . For the raw LTO, the weight ratio of carbon black was 0, 5, and 10%, respectively, and for the LTO/C, it was 0, 2, and 7% to keep the same carbon content.
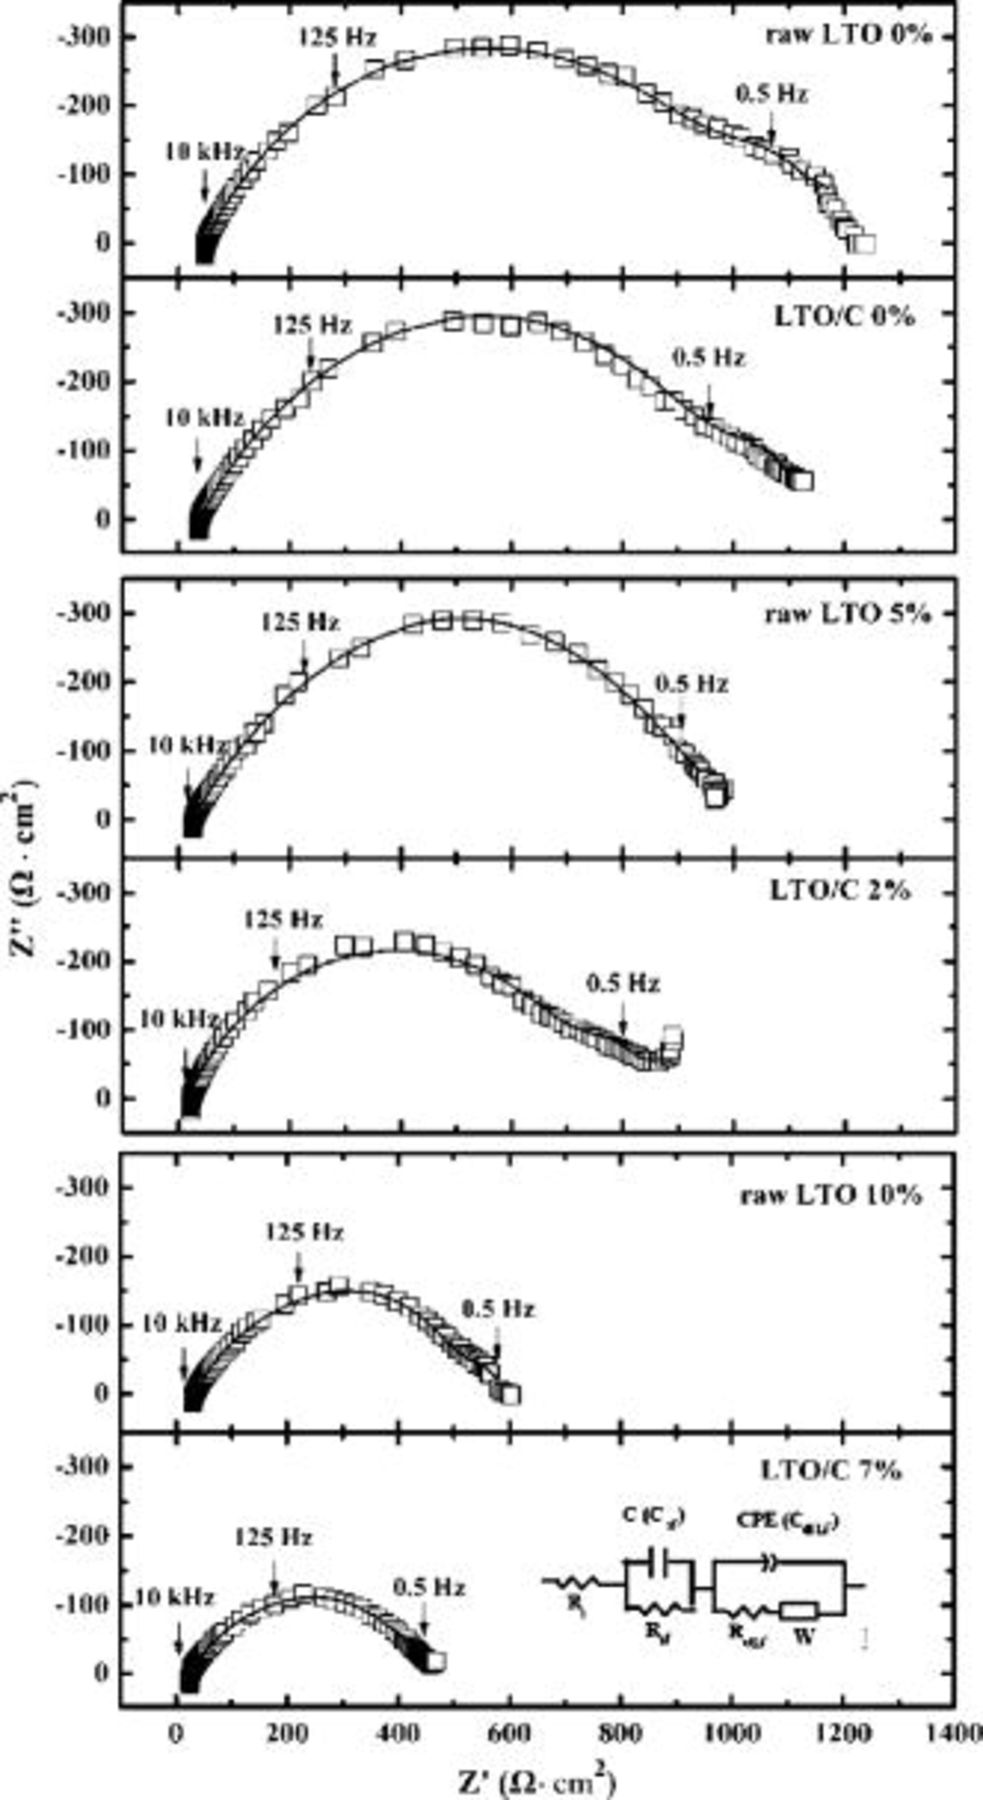
Figure 8. AC impedance plots of raw  and LTO/C electrodes mixed with different weight ratio of carbon black (CB) at half discharge state. The equivalent circuits are given in the insert (white rectangular: experimental data; black line: fitting results). From top to bottom, raw LTO with
  CB, LTO/C
  with CB, raw LTO with
  CB, LTO/C with
  CB, raw LTO with
  CB, and LTO/C with
  CB.
CB.
To study the change in the AC spectra of  during the discharge process in detail, we employed equivalent circuits to analyze the impedance spectra data shown above. For the
  at discharge state (
 vs
vs  ,
,  ), typically one dispersed semicircle within the frequency range (
 to
to  ) was observed. The dispersed semicircle includes two overlapped semicircles. According to Ref. 18, the total impedance could be considered the surface film impedance in the high frequency which can be represented by a surface film resistance,
  in parallel with a capacitance,
  , and the impedance in the medium frequency contributed from the charge-transfer process, which can be characterized by
  combination, where
  is charge-transfer resistance, and CPE can be considered as the double-layer capacitance,
  . The equivalent circuits are given in Fig. 8, and the fitting goodness between the experimental (white rectangular) and calculated is also shown in Fig. 8 (the black-line curves). The fitting results including internal resistance,
  , surface film resistance,
  , lithium-ion intercalation charge-transfer resistance and
  are summarized in Table I. As shown in Table I, the surface film resistances
  and charge-transfer resistance for lithium-ion intercalation
  decreased slowly with the weight growth of the carbon black. The carbon-coated LTO shows the smaller interfacial charge-transfer resistance than that of the carbon solely mechanically mixed electrode by comparing the each group with the same carbon content.
Table I. Summaries of the fitting results of internal resistances  , surface film resistances
  , and charge-transfer resistances for
  intercalation
  based on a series of experimental results.
| Electrodes |
 Ω Ω |
 Ω Ω |
 Ω Ω |
|---|---|---|---|
| Pure LTO | 55.4 | 133.5 | 993.9 |
| LTO/C | 48.1 | 108.6 | 856.3 |
Pure  C C | 43.6 | 118.3 | 749.1 |
 C C | 37.9 | 83.8 | 693.6 |
Pure  C C | 32.3 | 81.9 | 457.6 |
 C C | 25.1 | 30.0 | 392.4 |
No general consensus on the interpretation of the impedance response measured with the porous intercalated compound electrodes has yet been reached, and the results vary from group to group and from sample to sample. Sometimes, conflicting models have been discussed and used in the literature. As pointed by Wang et al. , the voltage of  is around
  vs
vs  , and the decomposition of electrolyte is thermodynamically prohibited, the
  cannot be attributed to the formation of surface layer from electrolyte directly. A possible reason for this is that the presence of the trace of
  may attribute to this process.19 On the other hand, Lindbergh et al. demonstrated that, for a porous intercalated electrode, the impedance response is strongly dependent on the current collector. The high-to-medium frequency semicircle can be attributed to the contact resistance between the collector and the active electrode material.20 In the present study, we speculated that the decreasing of surface film resistance may be associated with the increased contact between current collector and active electrode material as the content of coated carbon and/or mixed carbon increase. The coated carbon layer may also prevent the trace of
  from reaction with
  .
.
It is most interesting to study why the high carbon mixed and/or carbon-coated LTO electrode shows a smaller interface charge-transfer resistance. When  is discharged, it undergoes the reaction

For the above reaction, the following process is involved: the solvated  diffuses from the bulk electrolyte solution, then a charge-transfer reaction occurs in the LTO particle surface/electrolyte interface accompanied by accepting an electron, then
  diffuses into the bulk LTO. The difference in the reaction pathway between the carbon simply mixed and carbon-coated LTO electrode can be attributed the charge-transfer interface reaction, and explained by a simple model shown in Fig. 9.
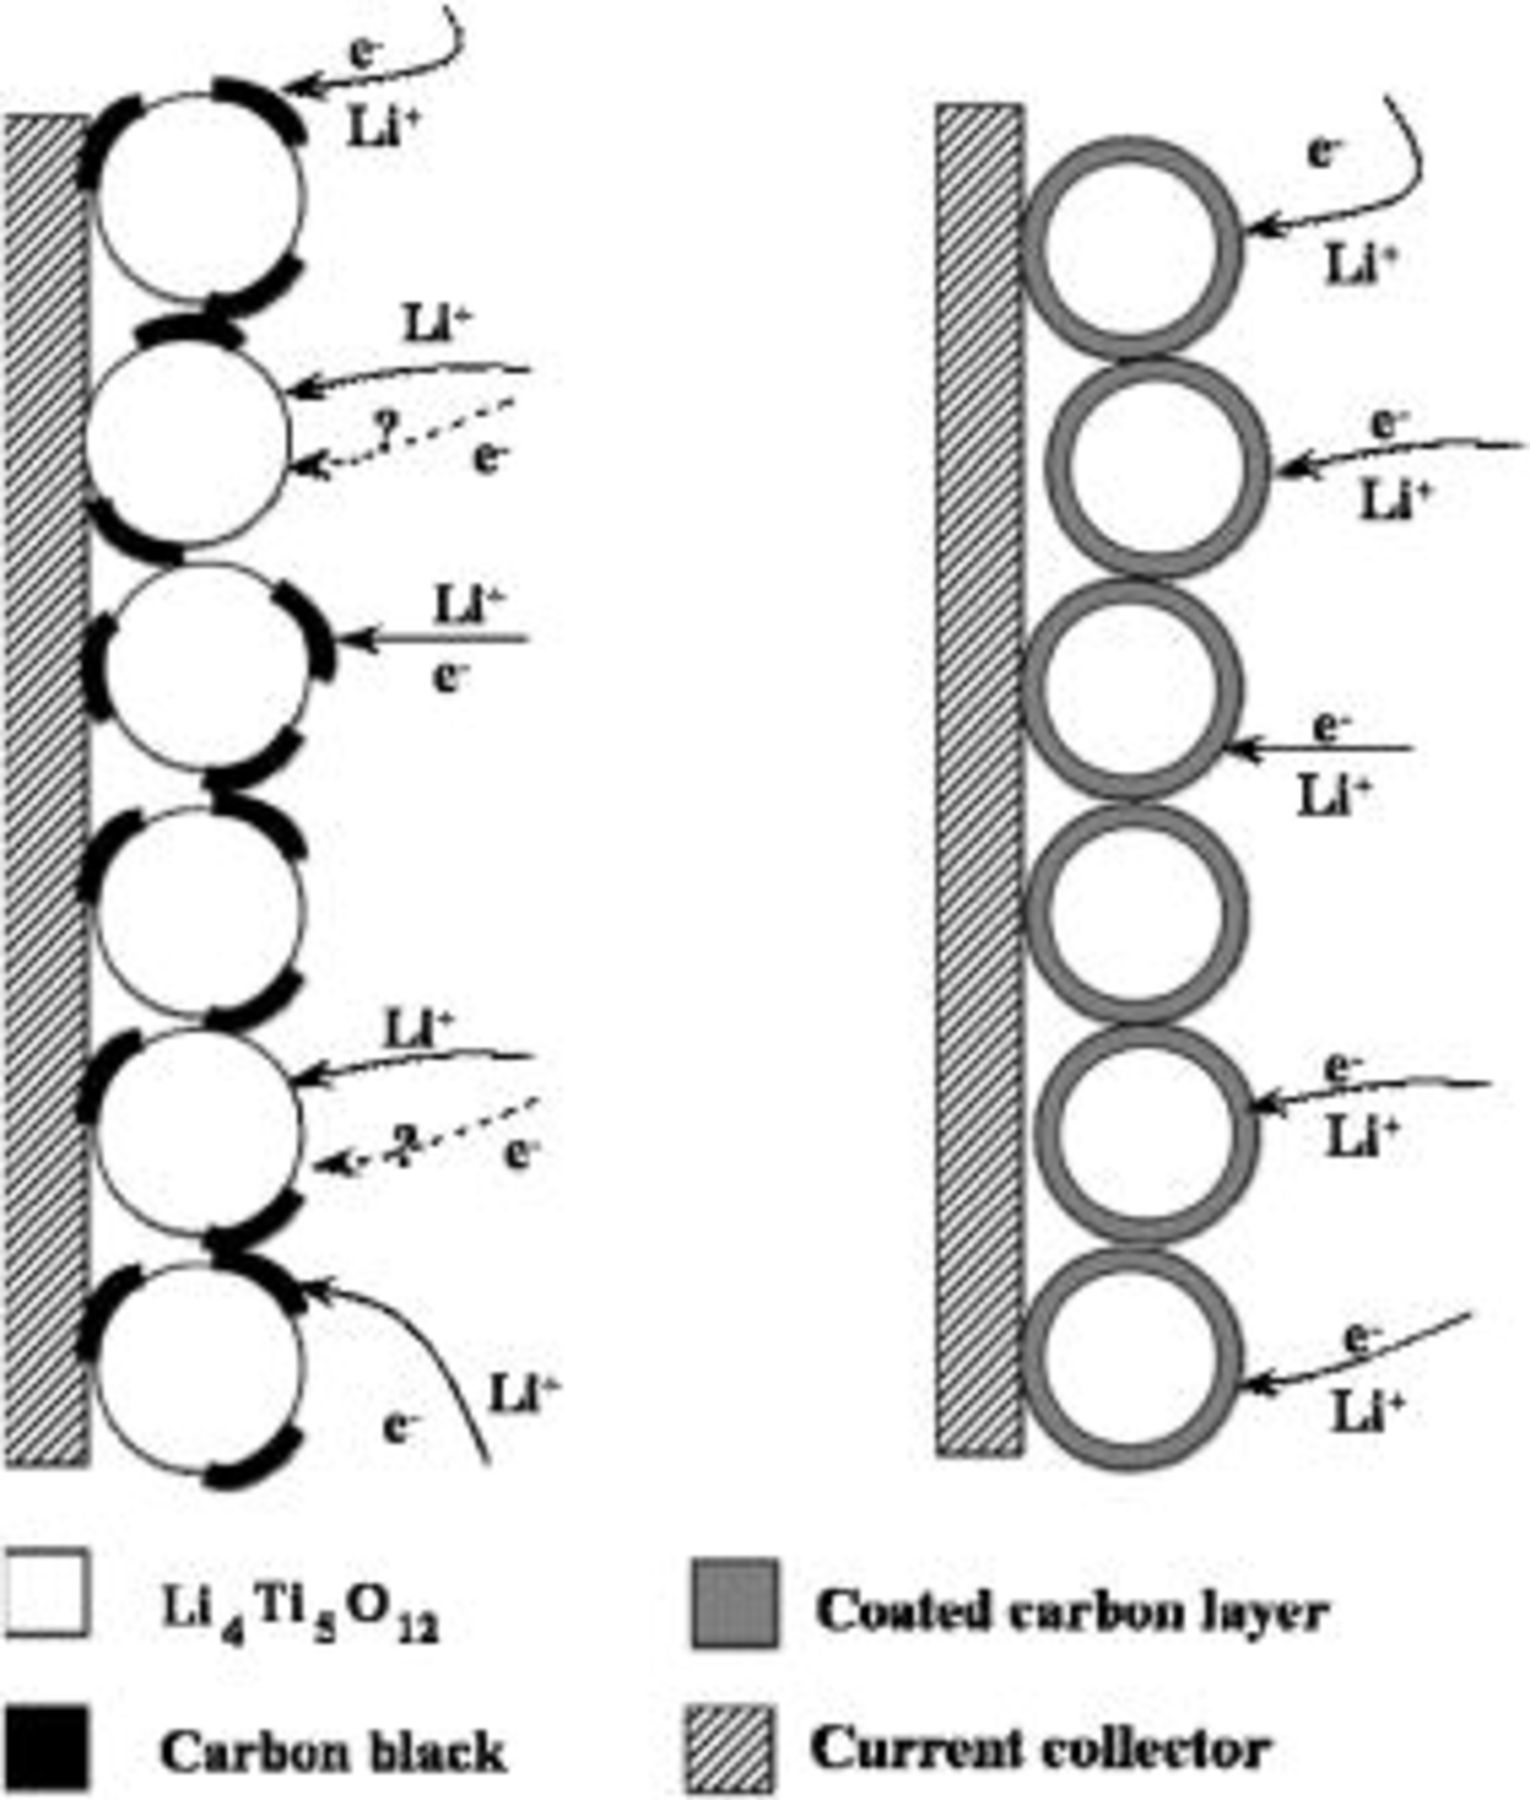
Figure 9. Schematic presentation of electrochemical reaction path on a carbon conductive additive mixed (left) and a carbon-coated LTO electrodes: (left) The case where the most places on a particle surface contact directly with the electrolyte which allows the  transfer from the electrolyte to the LTO particle surface, but the reaction can only occur on the selected spots in which the electronic conductive path is built, the effective reaction area is limited. (right) An electronic conductive phase forms a coating layer around each active particle, each spot on a particle surface is able to accept the electron, and crystal defects present in the coated carbon layer which allow the
  s pass through the carbon layer to provide enough effective reaction areas.
For the low carbon content mixed LTO electrode, most places on a particle surface which contact directly with the electrolyte allow the  transfer from the electrolyte to the LTO particle surface, but the reaction can only occur on the selected spots in which the electrical conductive path is built, the effective reaction area is limited. For a carbon-coated LTO electrode, the electronic conductive phase forms the coating around each active particle; each spot on a particle surface is able to accept the electron. Simultaneously, the coating layer must be permeable for the
  accessibility. However, as demonstrated above (TEM observations), the coated carbon by TVD process spreads over the entire particle surface to form a nano thickness film, which is different from the conventional coating method using metal oxide, polymer, and carbon material, in which some cracks or pores exist in the layer providing the ion accessibility pathway. This raises an interesting issue as to how the
  can reach the LTO particle surface. Apparently, it is different from the case of carbon-coated graphite,
  can first intercalate into the coated-carbon, then diffuse to bulk graphite. In the current case,
  intercalation cannot occur at the examined potential (
 vs
vs  ) for coated carbon. Until now, the mechanism responsible for the ionic transport in the impact coatings still remains unclear. Recently Suzuki et al. reported that the lithium ion can diffuse through the copper thin film.21 This was further confirmed by ab initio density-functional calculation contributed by Chen et al.22 They demonstrated that when an ion concentration difference exists between two phases, and some crystal defect or vacancy in the bulk substance, the ion can pass through the film. As shown in the TEM observation and Raman spectra, the coated layer is low crystalline carbon, rather than a perfect graphitized one. There are many defects present in the coated carbon layer. We speculate that these defects allow the Li-ions to pass through the carbon layer to provide enough effective reaction areas. From all of the above results, we conclude that the coated carbon layer can reduce both the electrode conductive resistance and charge-transfer resistance for lithium-ionintercalation due to the good electrical conductivity.
Conclusions
We obtained the carbon-coated  through a TVD process. The electrical conductivity increased as coating temperature increased, but it resulted in a poor electrochemical profile over 800°C. The optimal condition for LTO coating should be performed at 800°C. The graphitized carbon layer of
  obtained at optimal condition is about
  thick. The carbon-coated LTO shows a much higher electrical conductivity
  than the raw LTO
  . As a negative electrode for the AC/LTO hybrid supercapcitor, it shows much better rate capability compared with that of the raw LTO, and keeps 50% of initial capacity at the rate of
 compared with 29% of the raw LTO. We speculate that the good rate capability can be ascribed to the fact that both the electrode conductive resistance and charge-transfer resistance for lithium-ion intercalation are reduced as the coated carbon layer can provide large effective interface reaction area. The results also demonstrate that the thermal vapor decomposition is a promising approach for carbon coating to improve the electrical conductivity of the
  , and this technology can also be expected to apply for other battery/supercapacitor electrode materials.
Acknowledgments
This work was partially supported by the National Natural Science Foundation of China (no. 20633040) and the New Century Excellent Talents program at the University of China (2005)
Fudan University assisted in meeting the publication costs of this article.