Abstract
Chemical mechanical planarization (CMP) has emerged as the most viable method to planarize copper thin films during fabrication of integrated circuits. The final stage of copper CMP requires the simultaneous polishing of copper and the barrier metal, where the metals are prone to galvanic corrosion due to exposure to slurry. In this study, the extent of galvanic corrosion between copper and tantalum was estimated using electrochemical polarization measurements. A novel setup was designed to make direct measurement of the galvanic current between copper and tantalum and was successfully used to measure galvanic current in two different chemical systems. Galvanic corrosion current values obtained from polarization and direct measurements are compared and their implications during barrier polishing are discussed.
Export citation and abstract BibTeX RIS
Chemical mechanical planarization or polishing (CMP) of copper is now routinely used for the formation of copper interconnect structures. In a CMP process, planarization of metal and dielectric areas is achieved by polishing a wafer with uneven topography on a polymeric pad held by a rotating platen using a colloidal slurry consisting of submicrometer-sized abrasive particles. Chemicals in the slurry, depending on their nature, play the role of oxidizer, slurry stabilizer, metal ion complexant, or corrosion inhibitor. In the abrasive-free polishing (AFP) process, the polishing medium consists of only chemicals and no particles.1, 2
A typical copper deposition and CMP process involves various stages. Initially, copper is electrodeposited in vias and trenches created in a dielectric layer such as  . Prior to electrodeposition, a thin diffusion barrier layer such as Ta and a copper seed layer are deposited in the trenches and vias. Copper electrodeposition fills the trenches and vias and leaves an overabundance of copper. The excess copper is first removed by CMP process. The next step is to remove the barrier layer and stop on the dielectric layer. An additional overpolish step is often included to ensure all the copper and barrier metal is cleared from the dielectric surface. During the removal of the barrier layer it is important that the removal rate of copper is significantly reduced. When all steps are successfully completed, the resulting structure would contain copper vias or lines in a dielectric matrix.
During the polishing of the bulk copper, removal rates as high as  have been obtained using various chemistries. The removal of the bulk copper exposes the underlying tantalum barrier in the field areas. In the second polishing step, copper and tantalum have to be ideally removed at 1:1 selectivity to obtain a planarized surface at the end of the CMP process. Because copper and tantalum are in direct electrical contact during the second polishing step, galvanic corrosion between these materials is likely. The nature and extent of such galvanic corrosion is a strong function of the slurry chemistry.
Hydrogen peroxide is the most common oxidant in slurries used for copper CMP. Copper removal rate in these slurries depends on the peroxide level,3–5 and removal rates as high as  have been reported. One disadvantage of using hydrogen peroxide is its tendency to decompose, resulting in lower oxidizing strength. In order to maintain the peroxide concentration, titration of additional hydrogen peroxide is often required, which leads to increased process costs. Hydroxylammonium salts are being considered as alternatives to hydrogen peroxide because of their higher pot life.6–8 Hydroxylamine salts are stable for as long as several months with less than 1% degradation.9 Several studies have shown that the removal rates of copper in hydroxylamine-based slurries show a maximum at a pH in the neighborhood of 6.9, 10 In the hydroxylamine system, the redox potential can be controlled by varying the free amine to salt ratio.
The literature contains several reports on galvanic corrosion in copper CMP. Brusic et al. have predicted the likelihood of galvanic corrosion between Ta and Cu immersed in aqueous solutions at different pH values, under static conditions, using polarization curves.11 Tai et al. investigated the extent of galvanic corrosion between Cu and four different barrier materials, Ta, W, WN, and TaN.12 The galvanic corrosion density followed the order  and were in the range
  . Unfortunately, this reference does not provide any details on the chemistry and pH of the system. Direct measurement of galvanic corrosion current density between copper and various barrier metals, including Ta, in a variety of chemical systems has been reported in literature.13, 14 In all the above cases the extent of galvanic corrosion was either estimated from electrochemical polarization of individual metals or measured directly under static (non abrasion) conditions. Because Ta passivates rapidly in many chemistries, direct measurement must be carried out during simultaneous abrasion of samples.
The objective of the study reported in this paper was to develop a method to measure the galvanic corrosion between copper and tantalum while both materials are under abrasion by a pad in the presence of peroxide or hydroxylamine-based slurry. The measured galvanic corrosion rates have been compared to those estimated from polarization curves.
Materials and Methods
Electroplated copper films of thickness  were used in the experiments. These films were plated on a stack structure of physical vapor deposited Cu

 . Tantalum samples
  were prepared by physical-vapor deposition on
  wafers. Two different chemical systems were used in the abrasion experiments. The first type contained
  hydroxylamine and the pH of this chemical system was varied by adding sulfuric acid. The second type contained
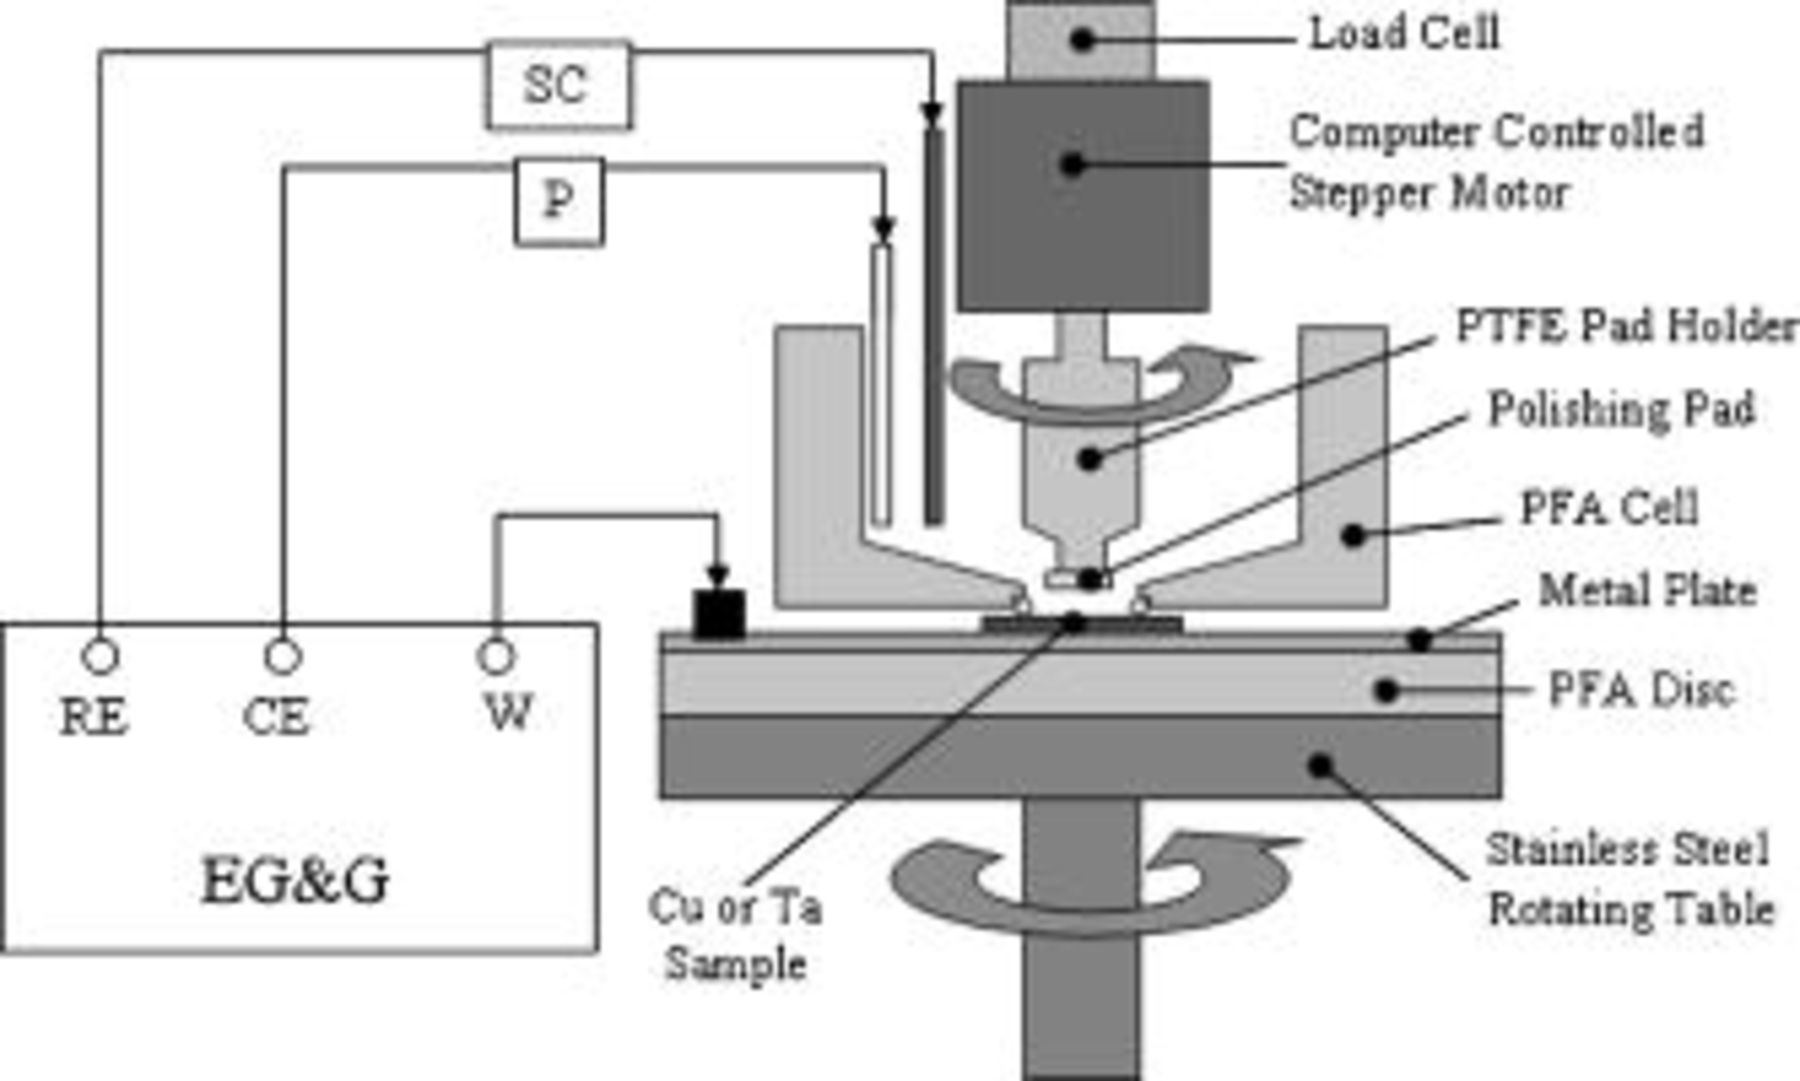
  hydrogen peroxide; potassium hydroxide was used to adjust the pH of this chemistry. All chemicals used in the experiments were of microelectronic grade. All abrasion experiments were performed on a specially designed laboratory-scale electrochemical polisher (EC-AC tool) diagrammed in Fig. 1. The electrochemical polisher is designed to polish or abrade metal films and at the same time perform electrochemical experiments on those films.
Figure 1. Schematic setup of the electrochemical polishing cell.
A typical abrasion experiment was conducted as follows. A diced copper-plated wafer sample  was placed on a circular copper plate as shown in Fig. 1. The sample was initially spin-coated with photoresist to prevent static etching of the unabraded area of the sample during abrasion experiments. In cases where electrochemical measurements were required, an electrical contact was made between the copper film on the wafer and the copper plate using aluminum film. The copper plate was then placed over the base of the polisher, which can be rotated at programmed speeds by a stepper motor attached to the base. The stainless steel base was electrically insulated from the copper plate by a Teflon disk. The Teflon vessel (a container with a hole at the bottom) was assembled on top of the wafer sample as shown in Fig. 1. A Viton O-ring was used to prevent liquid leaking out of the vessel. A small section
  of a fixed abrasive pad was attached to the bottom of the Teflon rod, which was then attached to the top stepper motor. After the abrasion cell was assembled, solution
  was poured into the Teflon vessel. The pad and the sample were rotated at 240 and
  , respectively, without any contact. Abrasion started when the pad was lowered to contact the sample at a pressure of
  . A polish pressure of
  was chosen due to the small sample area. Approximately
  of the sample was subjected to abrasion. The abraded samples were retained to calculate the removal rate under each condition. The thickness of films removed during abrasion was measured using either a KLA-Tencor α-step 200 or a P2 profiler. Solution was collected at the end of the abrasion experiment (
 , depending on chemistry and pH) for analysis of copper by atomic absorption spectrophotometry. Only a profilometry method was used in the case of tantalum samples
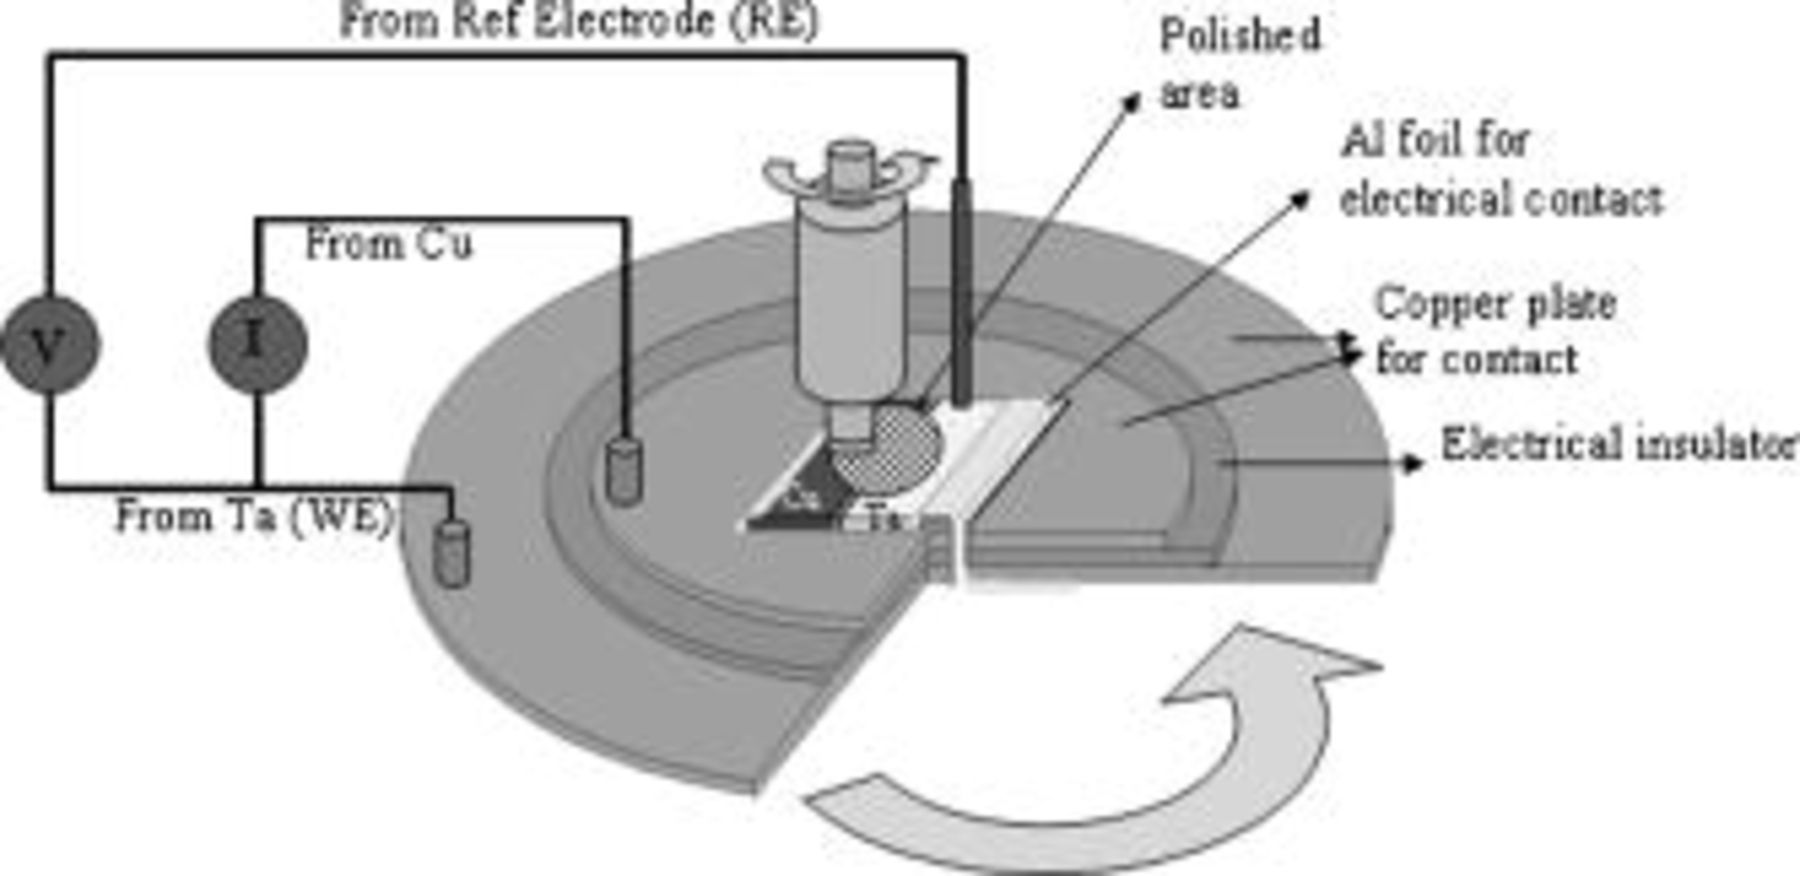
Galvanic corrosion experiments were carried out on the same polishing tool with slight modifications, as shown in Fig. 2. Copper and tantalum samples  were placed side by side with a thin
  insulating silicone layer between their edges. The copper–tantalum sample was placed on a stack of two copper foils separated by an insulating material. A thin aluminum foil was used to make electrical contact between the Ta portion of the sample and one of the circular copper foils. The Cu part of the sample was connected to the other copper foil at the bottom through the window in the copper foil on top. Connections to the EG&G PARC 263A potentiostat were achieved via carbon brushes pressing against the rotating copper foils. Tantalum was made as the working electrode and copper was made the ground in all these experiments. During a galvanic corrosion experiment, the potentiostat does not apply any potential or current waveform to the sample. Instead, it behaves as zero resistance ammeter and measures the current characteristics (as a function of time) of the system consisting of the two metals (working and ground electrode). The potentiostat was configured to record the flow of electrons from tantalum (working electrode) to copper (ground electrode) as positive current. A silver/silver chloride electrode reference electrode was used to monitor the potential characteristics of the working electrode. The setup thus allowed the monitoring of both current and potential characteristics simultaneously.
Figure 2. Modified electrochemical polishing cell for measuring galvanic corrosion potential and current during abrasion.
Results and Discussion
Removal rates of copper and tantalum
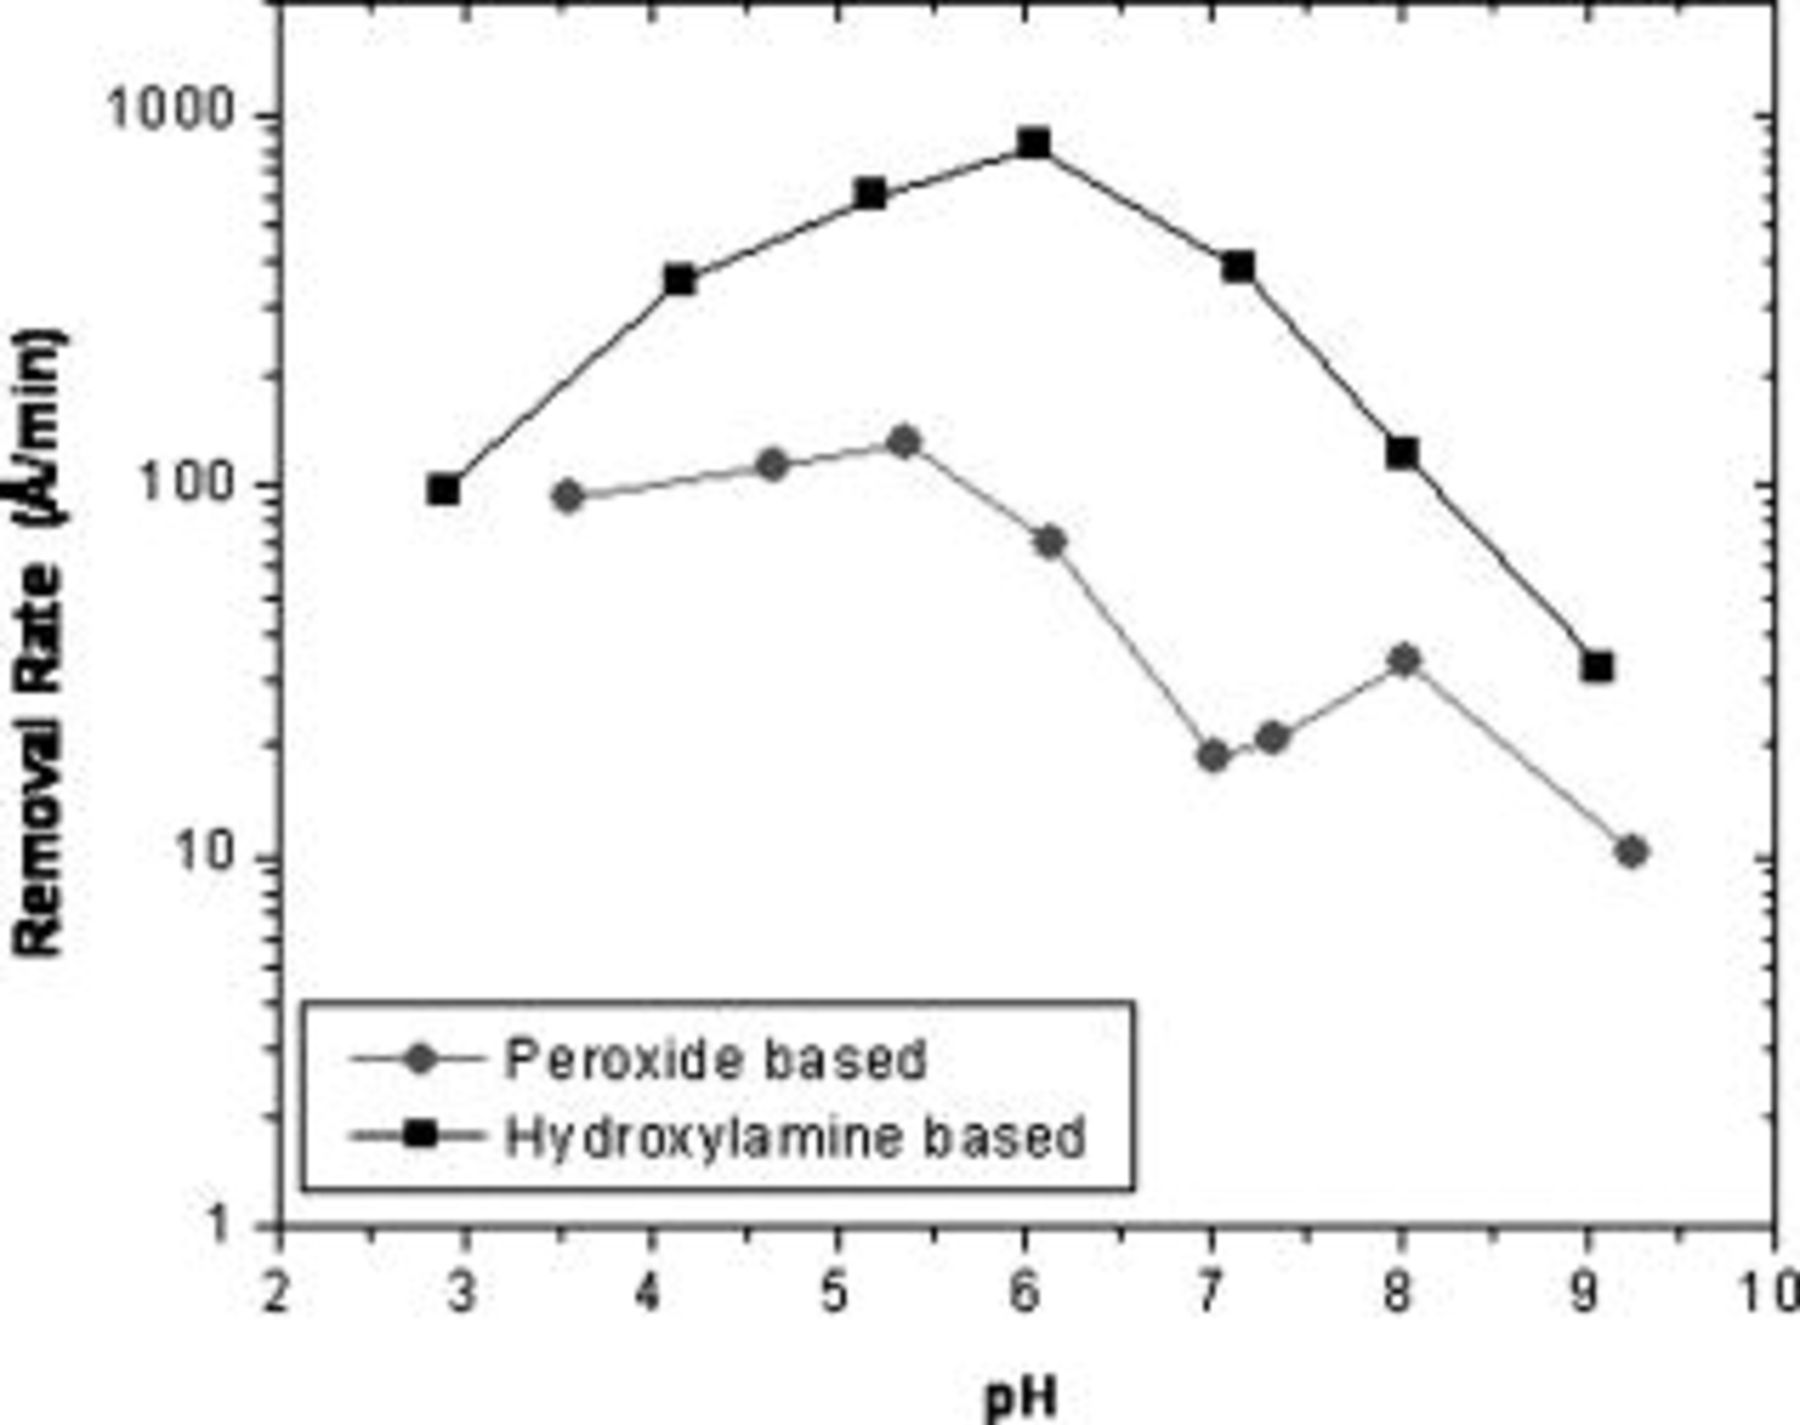
The removal (abrasion) rates of copper in  hydroxylamine and
  (3.6%) hydrogen peroxide solutions were obtained at various pH values using the EC-AC tool. Both copper and tantalum samples were abraded with a fixed abrasive pad at a downforce of
  . Figure 3 shows that removal rate in hydroxylamine solutions exhibits a maximum at a pH close to 6. Based on the Pourbaix diagram for the copper–hydroxylamine system,15 copper removal in the pH range of 4–7 is likely to occur through the formation of soluble copper hydroxylamine complexes. In hydrogen peroxide solutions, the removal rate is almost independent of pH in the range 3–5 but falls off at higher pH values. Copper is known to form a passive oxide surface when exposed to hydrogen peroxide solutions in near-neutral and alkaline pH conditions. Therefore the removal rate in neutral and alkaline pH conditions is perhaps limited (controlled) by the abrasion of the oxide layer. Properties like the hardness, porosity, and thickness of the oxide are pH and chemistry-dependent and hence, the removal rate of copper indirectly depends on the above factors. At acidic pH conditions, the abrasion of copper is accompanied by the active dissolution of copper to copper ions, thereby resulting in a higher removal rate.
Figure 3. Removal rates of copper in  hydroxylamine and
  hydrogen peroxide solution at
  using a fixed abrasive pad.
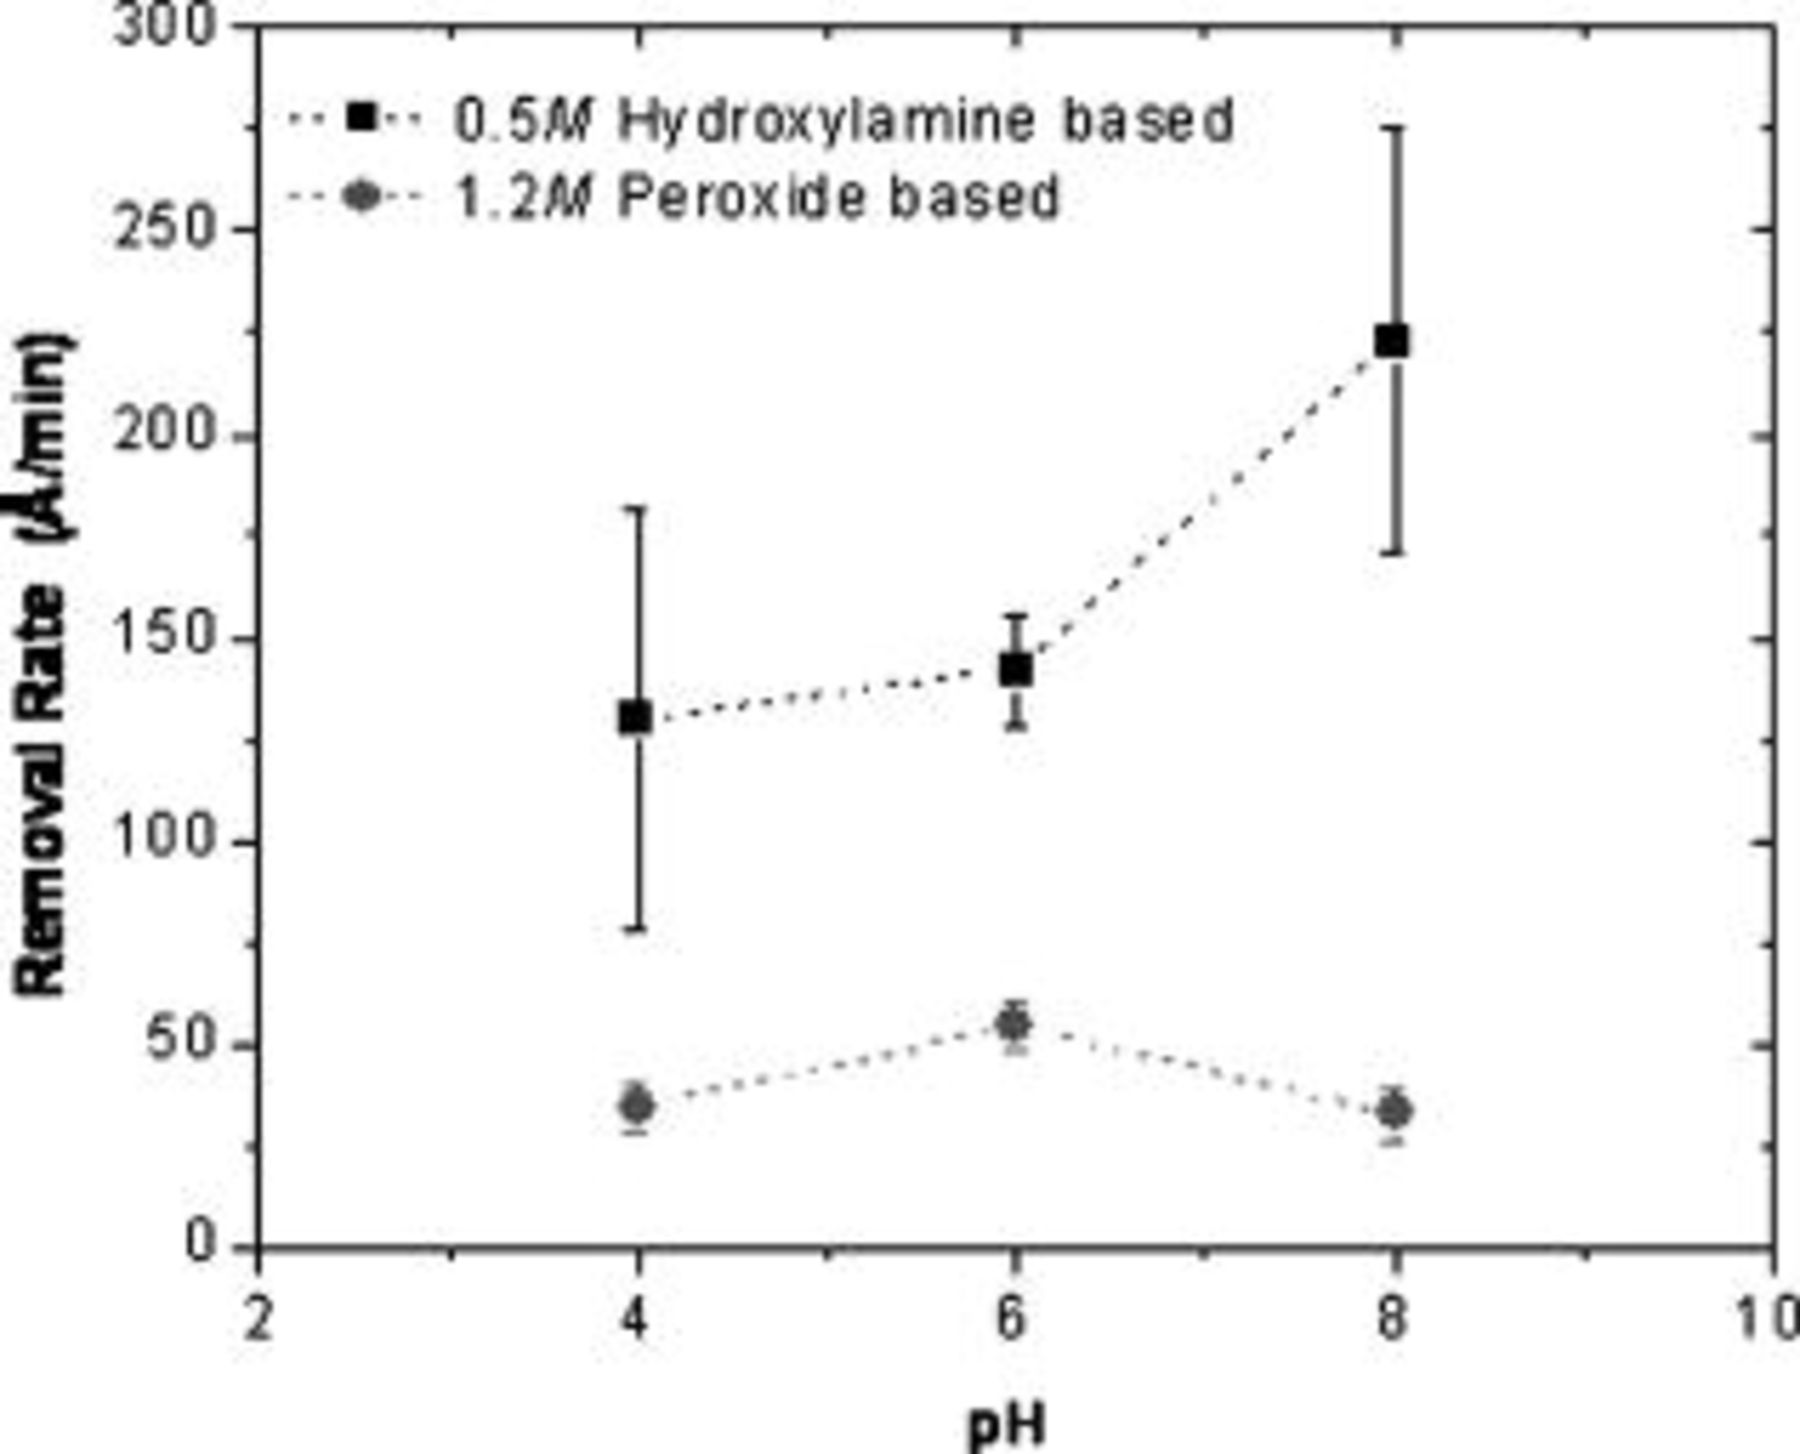
The removal rates of tantalum in  hydroxylamine and
  (3.6%) hydrogen peroxide solutions at different pH values are shown in Fig. 4. The removal rate of tantalum decreases with decreasing pH in hydroxylamine-based solutions, but in peroxide solution the removal rate is independent of pH in the range of 4–8. Tantalum does not form any known complexes with hydroxylamine. It is generally believed that the surface of Ta immersed in water is covered with a passive layer of
  . Hydroxylamine is a reducing agent at alkaline pH conditions and can reduce tantalum oxide to metallic tantalum. Perhaps this property of hydroxylamine causes a slight increase of tantalum removal rates at alkaline pH. At all pH values investigated, the removal rate of copper and tantalum was higher in hydroxylamine solutions than in hydrogen peroxide solutions. A selectivity of 1:1 between Ta and Cu can be obtained when the polishing is done at a solution pH of 7–8 in both the hydroxylamine and the peroxide systems.
Figure 4. Removal rates of tantalum in  hydroxylamine and
  hydrogen peroxide solution at
  using a fixed abrasive pad.
Estimation of galvanic corrosion from polarization curves
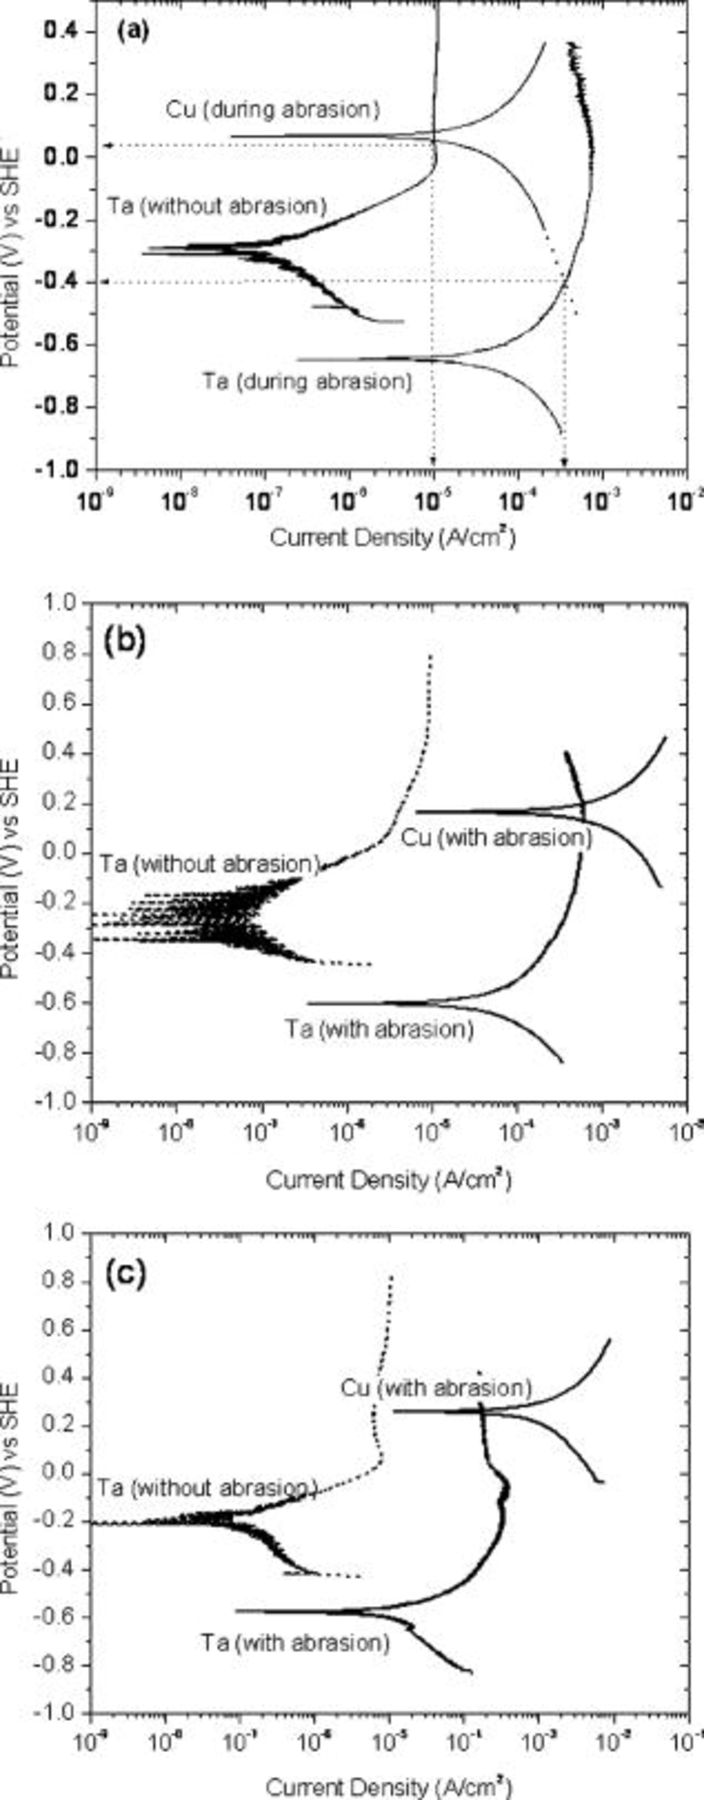
The potentiodynamic polarization curves for Cu and Ta exposed to  hydroxylamine solutions at pH values of 4, 6, and 8 are shown in Fig. 5a, b, and c . Two different curves for Ta, one during polishing and the other after the abrasion was discontinued, are shown in these figures. In the case of copper, only the curves obtained during abrasion are shown because there was little difference between the curves obtained during and after abrasion. Two key points may be noted from these figures: (i) abrasion of Ta markedly increases its corrosion current density and (ii) Cu and Ta are likely to form a galvanic couple because the anodic branch of Ta polarization curve intersects the cathodic branch of Cu. Figure 6a displays the curves obtained at pH 8. The point of intersection of the anodic portion of the tantalum curve and the cathodic portion of the copper curve gives the estimated galvanic potential and galvanic current density
  (marked by arrows). When the samples are not abraded, there is a thin layer of native oxide
  on the tantalum surface and the polarization curve obtained for Ta is representative of the oxide layer; hence, the galvanic current is low, of the order of
  . When the sample is abraded, the surface oxide is constantly removed, exposing the bare Ta metal to the solution. The polarization behavior of Ta under abrasion is markedly different from that of the oxide-covered surface and the estimated galvanic current
  is much higher. Abrasion of tantalum shifts its open-current potential (OCP) from −0.3 to −0.65 V, thereby changing the galvanic potential from 0.05 V under no abrasion to −0.4 V during abrasion.
Figure 5. Potentiodynamic polarization of copper and tantalum in  hydroxylamine solution at different pH values: (a) pH 8, (b) pH 6, and (c) pH 4.
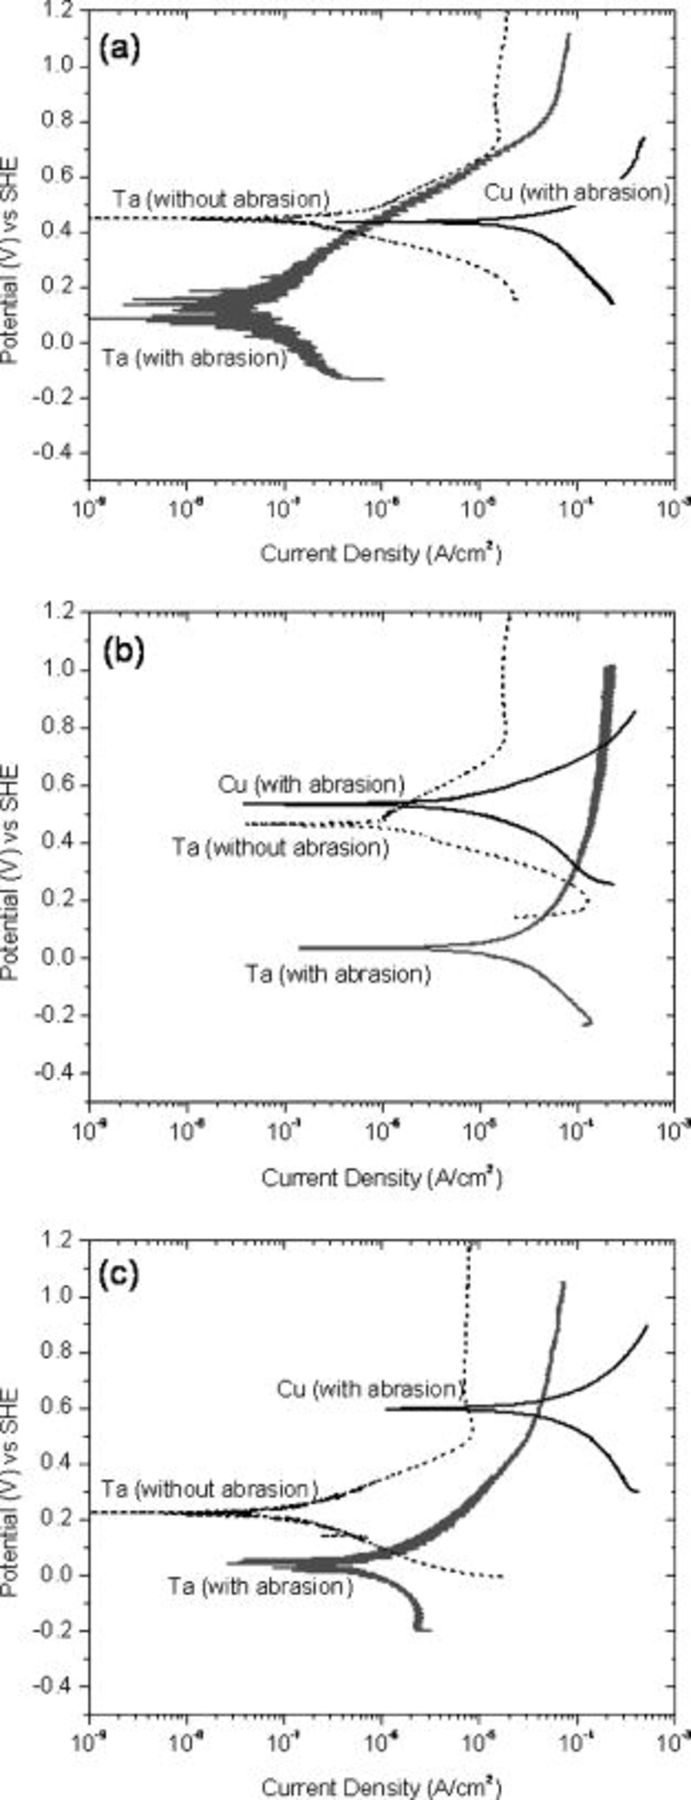
Figure 6. Potentiodynamic polarization of copper and tantalum in  (3.6%) hydrogen peroxide-based solution at different pH values: (a) pH 8, (b) pH 6, and (c) pH 4.
At pH 6, from the data shown in Fig. 5b, the corrosion current density of Cu is the highest. Abrasion of tantalum at this pH shifts its OCP to more negative values (−0.3 V without abrasion and −0.6 V with abrasion), but the galvanic potential value is unaltered as the anodic portion of the tantalum curves (with and without abrasion) intersect the OCP region of the copper polarization curve. The galvanic current density during abrasion is much higher  compared to the no abrasion condition
  . At pH 4 (Fig. 5c), abrasion of tantalum shifts its OCP from −0.2 to −0.6 V, but has no effect on the galvanic potential
  , similar to pH 6. The galvanic corrosion current density at pH 4 is
  without abrasion and
  when both copper and tantalum were abraded.
The experimental polarization data obtained in  hydrogen peroxide system at pH 8, 6, and 4 are shown in Fig 6a, b, and c, respectively. At pH 8 (Fig. 6a), the polarization curves of tantalum, both under abrasion and no abrasion conditions, intersect the copper curve at its OCP
  . A very low galvanic corrosion current density of
  is estimated at this pH. The galvanic behavior at pH 4, displayed in Fig. 6c, yields a galvanic potential and current density of
  and
and  without abrasion and
  and
and  with abrasion. The galvanic behavior at pH 6 (Fig. 6b) is different from that at other pH conditions; a higher galvanic corrosion current density of
  is estimated during abrasion, which drops to only
  when abrasion is stopped.
The estimated galvanic corrosion potential and galvanic corrosion density in both hydroxylamine and hydrogen peroxide-based solutions at different pH values are tabulated in Table I. While the galvanic corrosion density is about the same at pH 4 in both chemical systems, the values are significantly higher at pH values 6 and 8 in the hydroxylamine system. Overall, galvanic corrosion is more likely to occur in hydroxylamine solutions compared to hydrogen peroxide solutions.
Table I. Estimated galvanic corrosion potential and galvanic current density between copper and tantalum in hydrogen peroxide and hydroxylamine solutions.
 Hydroxylamine- based chemistry Hydroxylamine- based chemistry | Polishing conditions | Galvanic potential (V vs SHE | Galvanic current density 
|
|---|---|---|---|
| pH 8 | During abrasion |

| 400 |
| No abrasion | 0.05 | 10 | |
| pH 6 | During abrasion | 0.125 | 700 |
| No abrasion | 0.175 (Cu OCP) | 5 | |
| pH 4 | During abrasion | 0.275 (Cu OCP) | 15 |
| No abrasion | 0.275 (Cu OCP) | 6 | |
 Peroxide-based chemistry Peroxide-based chemistry | Polishing conditions | Galvanic potential (V vs SHE) | Galvanic current density 
|
| pH 8 | During abrasion | 0.45 (Cu OCP) | 1 |
| No abrasion | 0.45 (Cu OCP) | 1 | |
| pH 6 | During abrasion | 0.3 | 100 |
| No abrasion | 0.55 (Cu OCP) | 2 | |
| pH 4 | During abrasion | 0.525 | 30 |
| No abrasion | 0.575 | 10 |
The polarization curves used in the estimation of galvanic corrosion represent the behavior of the metals under uncoupled conditions. The anodic and cathodic portions of the polarization curves are representative of the reactions taking place when copper or tantalum is exposed to the chemistry. It is possible that these behaviors could be altered when the metals are put into galvanic contact.
Direct measurement of galvanic corrosion
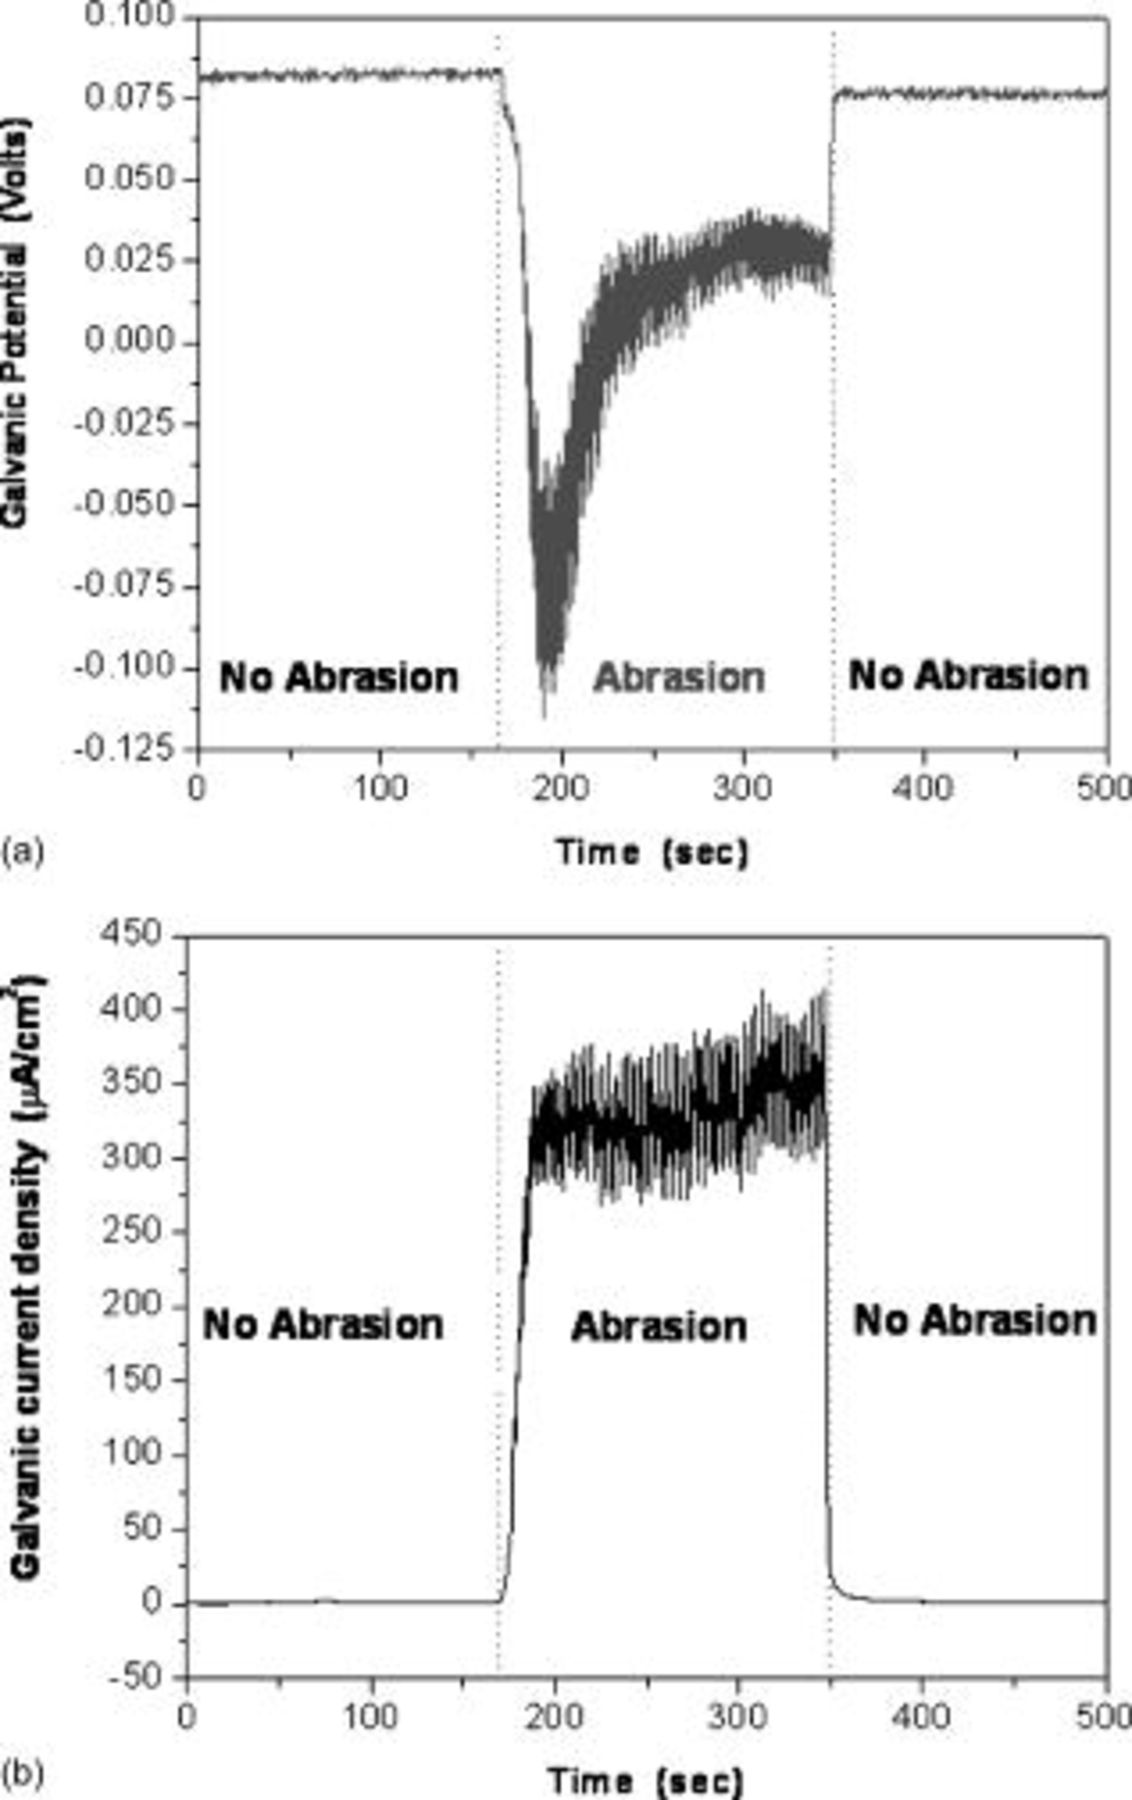
Direct measurement of the galvanic potential and current density between copper and tantalum during abrasion was carried out in a modified EC-AC tool. The sample( couple) described in the Materials section was exposed to the chemistry without any abrasion, and abrasion was started after a predetermined time. The galvanic potential and current measurements done in 0.5 M hydroxylamine based chemistry at pH
  are displayed in Fig. 7a and 7b as a function of time. In Fig. 7a, it may be seen that the galvanic potential was 0.085 V when the sample pair was not abraded. At the beginning of abrasion the galvanic potential shifts to
  and then slowly becomes more positive and fluctuates between roughly 0.015– 0.035 V. The initial drop is most likely due to the removal of the oxide layer from tantalum, exposing the bare metal, and the constant fluctuation is perhaps due to the repeated repassivation and oxide removal on parts of the Ta sample that may occur even during polishing. The galvanic current density,
  (based on equal polished areas of Cu and Ta) during polishing is roughly
  . Galvanic current density and potential were also measured at various pH conditions and the results are listed in Table II.
Figure 7. Measured galvanic (a) potential and (b) current density between copper and tantalum as function of time during abrasion in  hydroxylamine solution at pH 8.
Table II. Measured galvanic corrosion potential and current density between copper and tantalum in hydrogen peroxide and hydroxylamine solutions.
 Hydroxylamine- based chemistry Hydroxylamine- based chemistry | Conditions | Galvanic potential (V vs SHE) | Galvanic current density 
|
|---|---|---|---|
| pH 8 | During abrasion | 0.015–0.035 | 400 |
| No abrasion | 0.085 |

| |
| pH 6 | During abrasion | 0.105–0.08 | 500 |
| No abrasion | 0.155 |

| |
| pH 4 | During abrasion | 0.200 | 350 |
| No abrasion | 0.210 |

| |
 Peroxide-based chemistry Peroxide-based chemistry | Conditions | Galvanic potential (V vs SHE) | Galvanic current density 
|
| pH 8 | During abrasion | 0.350–0.320 | 120 |
| No abrasion | 0.465 |

| |
| pH 6 | During abrasion | 0.380–0.310 | 40 |
| No abrasion | 0.500 | 10 | |
| pH 4 | During abrasion | 0.430–0.390 | 40 |
| No abrasion | 0.470 |

|
The measured and estimated (from polarization) galvanic current density in the hydroxylamine system at pH 8 are nearly equal  . At pH 6 and 4, the measured galvanic current density was 500 and
  , respectively, while the estimated current density was very different (700 and
  ). The reason for this discrepancy can be explained as follows: In the case of galvanic current estimation, the anodic portion of the individual polarization curve represents the metal corrosion reaction. The cathodic portion of the curve represents the reduction reaction (due to the chemistry) responsible for metal corrosion such as nitric oxide reduction in hydroxylamine. So the estimated galvanic current from the intersection of the anodic (active metal, tantalum) and cathodic (noble metal, copper) portions of the curves is based on the current characteristics of the cathodic reaction responsible for copper corrosion. During galvanic corrosion, the anodic reaction is the oxidation (corrosion) of the active metal and the corresponding cathodic reaction is the reduction of the noble metal (copper) ions present in the solution due to abrasion. Hence, the discrepancy in the galvanic current obtained by direct measurement and estimation is most likely due to the different cathodic reactions occurring at the copper surface during copper corrosion under coupled and uncoupled conditions.
In the case of hydrogen peroxide, the maximum galvanic current density was recorded at pH 8  , while the estimated galvanic current density was less than
  at the same condition. The galvanic current density was
  at pH 6 and 8, much closer to the estimated values.
To understand the significance of galvanic corrosion currents, the galvanic current density has to be compared with the corrosion current density of uncoupled tantalum under similar conditions. These values are tabulated in Table III. It is clear that in all but one case, Ta corrosion is enhanced when coupled to copper and abraded. A current density of  is equivalent to a tantalum removal rate of
  and hence, the largest enhancement in Ta corrosion (removal) due to galvanic contact with copper is roughly
  . As shown in Fig. 4, abrasion of Ta in the absence of any coupling to copper in
  hydroxylamine solution at pH 6 yields a removal rate of
  . Hence, galvanic contact with concomitant abrasion may enhance the removal rate under certain conditions.
Table III. Corrosion current density of tantalum in  hydroxylamine and
  hydrogen peroxide during abrasion.
| Chemistry | pH |
 of Ta of Ta 
| |
|---|---|---|---|
| Uncoupled | Coupled (galvanic) | ||
 Hydroxylamine Hydroxylamine | 4 | 43 | 350 |
 Hydroxylamine Hydroxylamine | 6 | 86 | 500 |
 Hydroxylamine Hydroxylamine | 8 | 34 | 400 |
 Peroxide Peroxide | 4 | 5 | 40 |
 Peroxide Peroxide | 6 | 34 | 40 |
 Peroxide Peroxide | 8 |

| 120 |
The galvanic corrosion measurements reported above were obtained when the pad was rotated at  and the sample was rotated at
  . The pad was offset to cover a larger area of the sample. So, as the pad and sample were rotated, the pad abraded the copper and tantalum, alternatively resulting in a steady repassivation rate for tantalum. At
  , a reference point on the sample would come under pad contact every
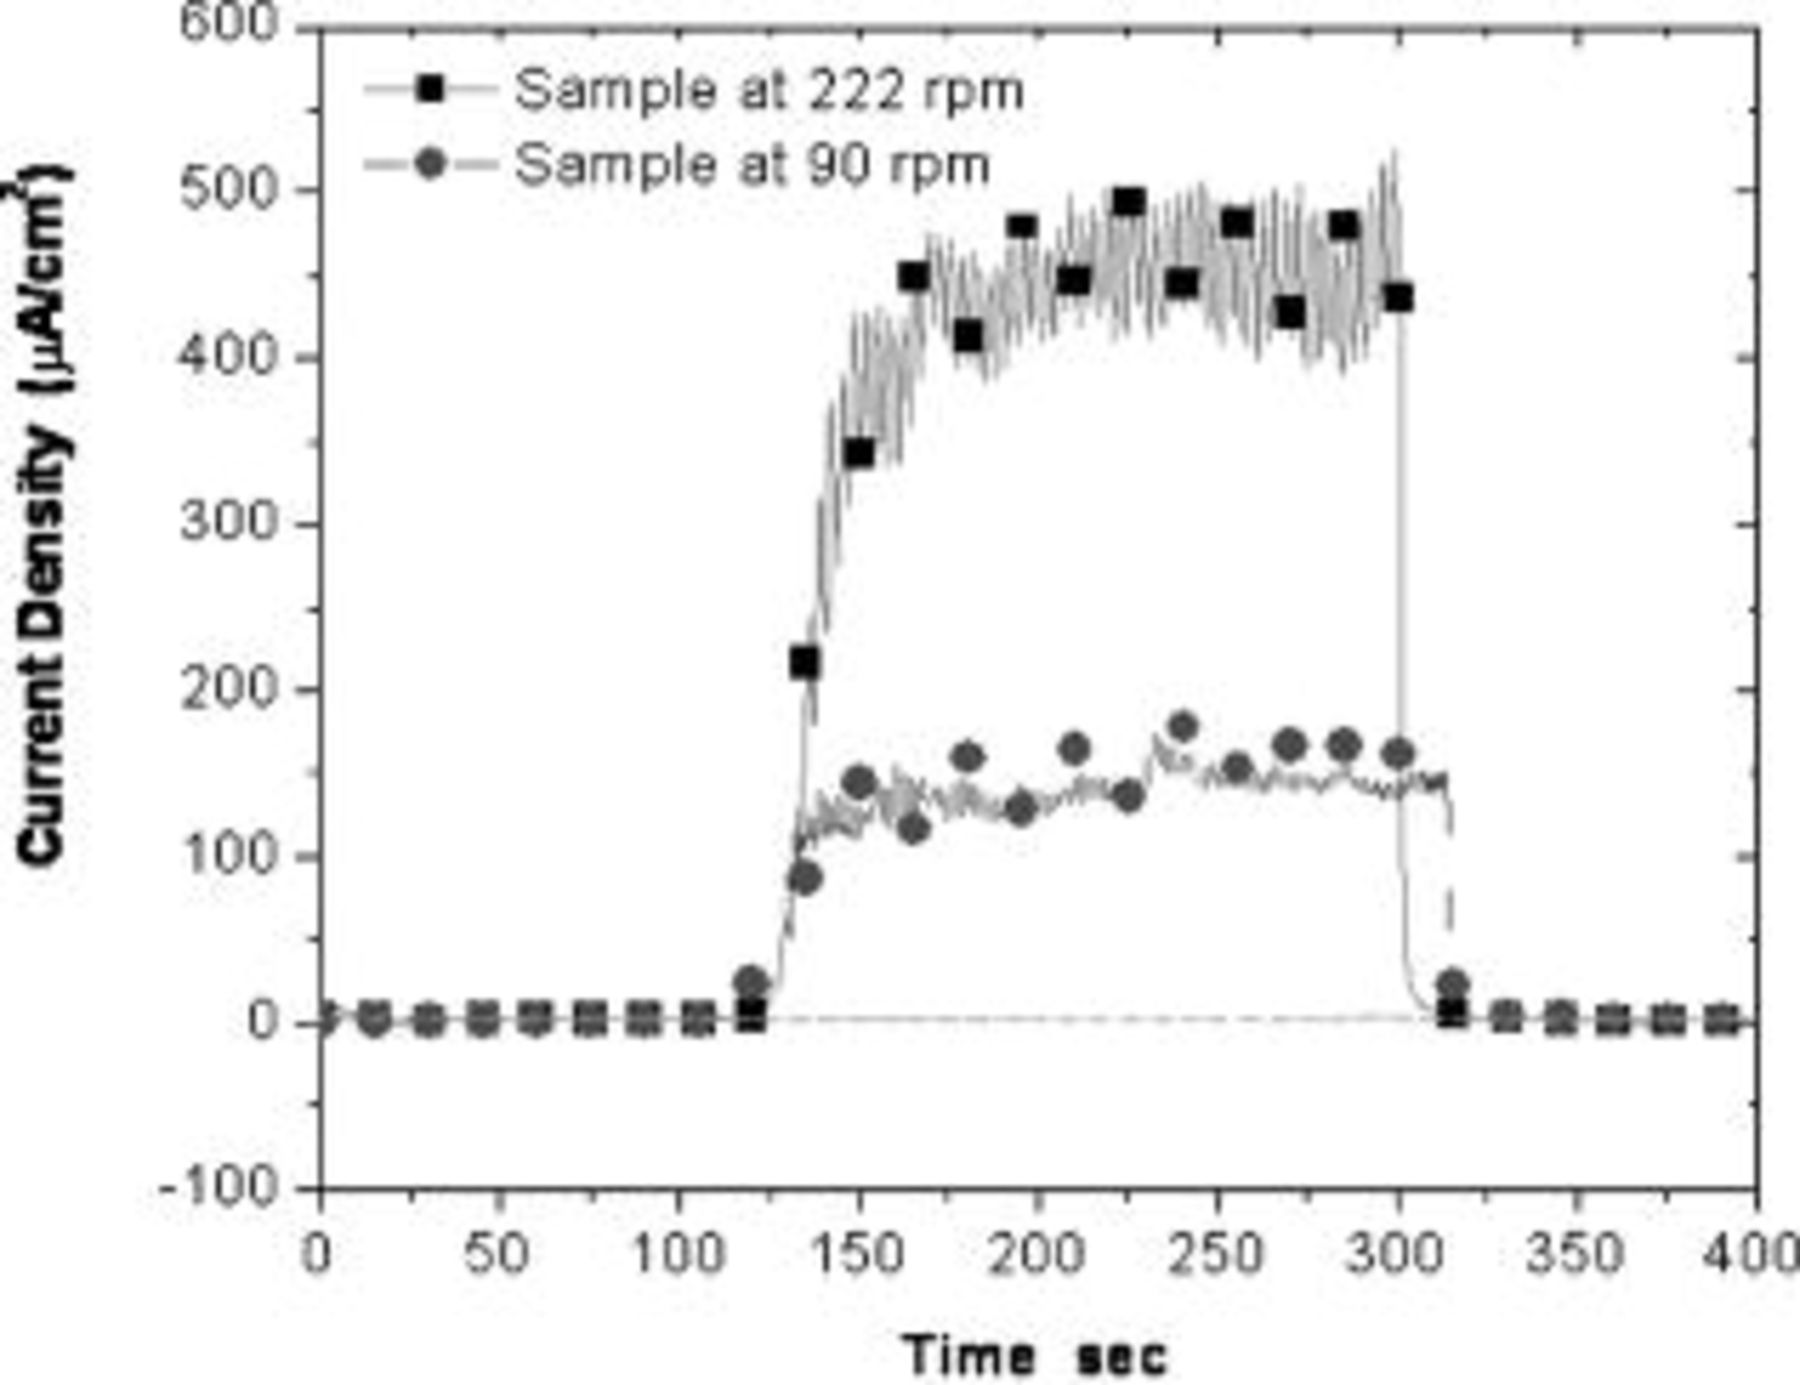
  . Figure 8 shows the galvanic current density of tantalum in
  hydroxylamine chemistry at pH 6 when the sample was rotated at two different speeds. The galvanic current density was
  at
at  and decreased to approximately
  at a lower rotation speed of
  (pad contact every
  ). The rotational speed of the sample affects the extent of galvanic corrosion; faster sample rotation constantly abrades the oxide on the tantalum, exposing fresh tantalum metal, and a higher current is measured. A slower rotational speed allows the abraded tantalum surface to passivate before it is abraded again and the galvanic current density is lowered. The repassivation kinetics of tantalum controlled by the mechanical effects is also critical in determining the extent of galvanic corrosion.
Figure 8. Measured galvanic current of tantalum in  hydroxylamine solution (pH 6) at different rotation speeds of sample.
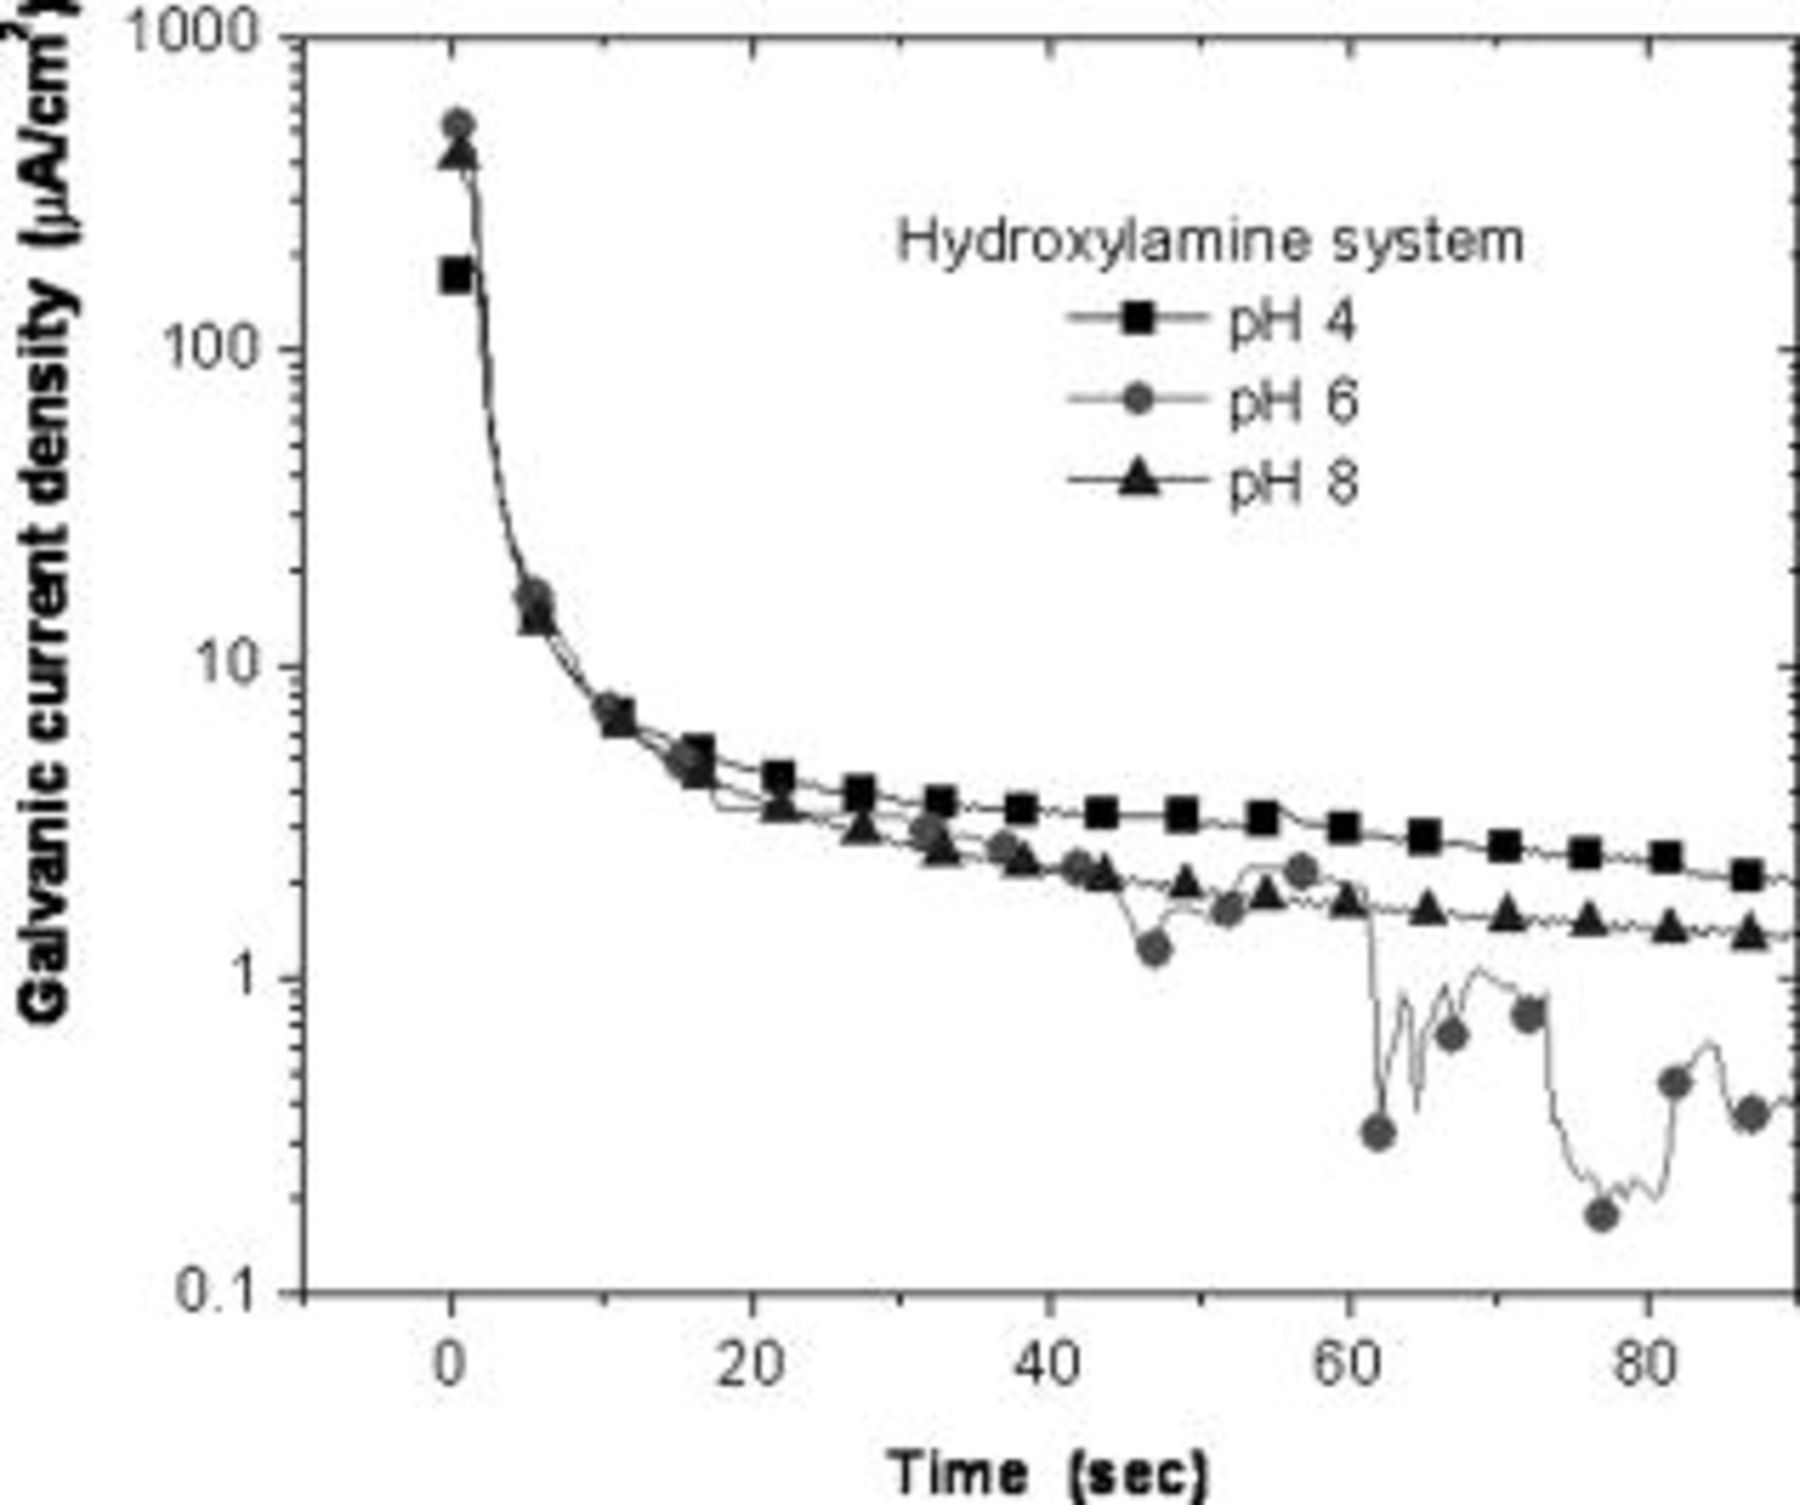
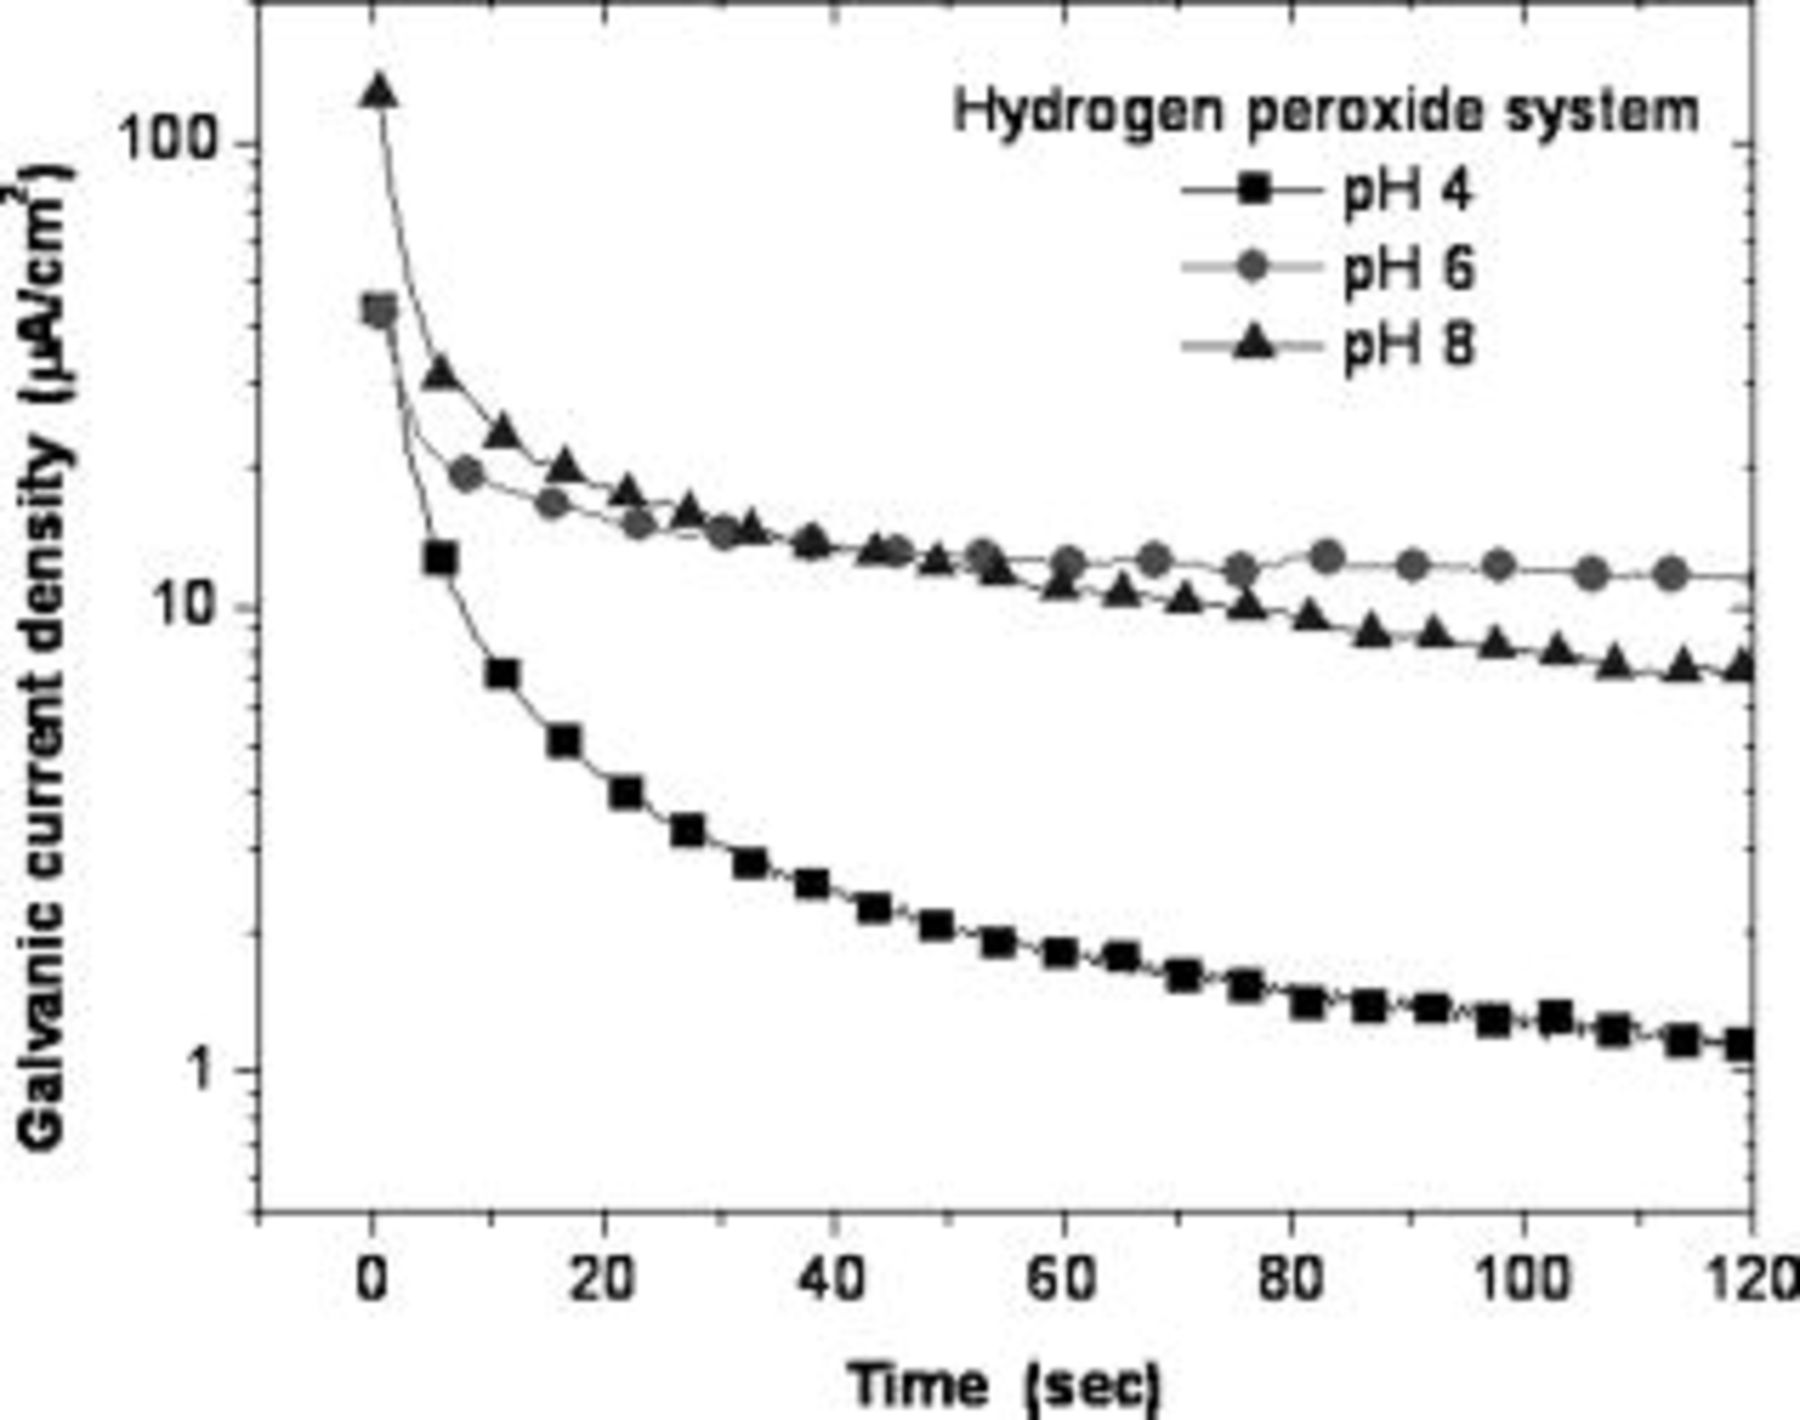
The galvanic current density rapidly drops to lower values when abrasion is stopped. The transients of the decline in galvanic current was monitored (at a time resolution of  ) from the instant abrasion was stopped. Figure 9 shows the galvanic current transients in
  hydroxylamine solution. The galvanic current density falls from values of roughly
  (depending on pH) to below
  within
  from the instant abrasion was stopped under all pH conditions. At
  , galvanic current density is below
  at pH 6 and of the order of 2 and
  at pH 8 and 4. At
  the current falls below
  at all pH conditions. Figure 10 shows the galvanic current transients in
  hydrogen peroxide chemistry. The galvanic current density falls well below
  within
  only at pH 4, while at pH 6 and 8 it is in the order of
  . The current density continues to decay gradually at pH 4 and decreases to
  by
by  . Interestingly, at pH 6 and 8, the current density saturates at about
  and does not fall below that value even after
  . This shows that tantalum is prone to galvanic corrosion in hydrogen peroxide slurries at pH 6 and 8 even after polishing is stopped.
Figure 9. Transients of galvanic current density after abrasion was stopped in  hydroxylamine solution.
Figure 10. Transients of galvanic current density after abrasion was stopped in  hydrogen peroxide solution.
Conclusions
The removal rate of copper and tantalum as well as galvanic corrosion between the two metals, when abraded with a fixed abrasive pad in hydroxylamine and peroxide solutions, was investigated. In hydroxylamine-based solutions, copper removal exhibits a maximum around a pH of 6 while the Ta removal decreases steadily with decreasing pH. In peroxide solutions, Ta removal rates are insensitive to pH in the range of 4–8 but the copper removal rate decreases slightly with increasing pH. Removal rates of both metals are significantly higher in hydroxylamine than in the peroxide solution. Electrochemical polarization measurements indicate that galvanic corrosion between Cu and Ta is a function of pH in both systems and is the lowest at a pH of 4. A novel method has been developed to directly measure galvanic corrosion during abrasion. In all chemistries, the galvanic current density was extremely low in the absence of abrasion but increased when subjected to abrasion. The measured galvanic current density during abrasion was as high as  (pH 6) in hydroxylamine solutions, while the highest galvanic current density in the hydrogen peroxide system was
  (pH 8). When abrasion was stopped the galvanic current decayed at a slower rate in hydrogen peroxide solutions than in hydroxylamine solutions.
Acknowledgments
The authors acknowledge the financial support from EKC Technology (DuPont Electronic Technologies) and NSF/SRC Center for Environmentally Benign Semiconductor Manufacturing.
University of Arizona assisted in meeting the publication costs of this article.


