
Abstract
 was prepared by a two-step solid state reaction and characterized by X-ray diffraction (XRD), infrared (IR)-Raman, and electron diffraction (ED).
  having characteristic eight absorption bands in 400-800 cm−1 in IR spectrum, extra lines in XRD, and extra spots in ED was analyzed in terms of a superlattice structure. Analytical results on the structural data indicated that
  (cubic:
  was a superlattice structure based on a spinel framework structure having a space group of
  (or
(or  in which nickel ions were located at the octahedral 4(b) sites, manganese ions were at the octahedral 12(d) sites, and lithium ions were at the 8(c) sites in a cubic-close packed oxygen array consisting of the 8(c) and 24(e) sites. Well-defined
  was examined in nonaqueous lithium cells and showed that the cell exhibited extremely flat operating voltage of about 4.7 V with rechargeable capacity of 135 mAh/g based on the sample weight. The reaction mechanism of
  was examined and shown that the reaction at ca. 4.7 V consisted of two cubic/cubic two-phase reactions, i.e.,
 was reduced to
 via
via 
 Results on the detailed reversible potential measurements indicated that the flat voltage at ca. 4.7 V consisted of two voltages of 4.718 and 4.739 V. The reaction of
  to
to  is also examined and showed that the reaction proceeded in a cubic
  /tetragonal
  two-phase reaction with the reversible potential of 2.795 V. From these results, characteristic features of topotactic two-phase reactions of
 were discussed by comparing with the results on
 © 2004 The Electrochemical Society. All rights reserved.
Export citation and abstract BibTeX RIS
In a previous paper,1 we have reported a series of 5 V materials having spinel-framework structures consisting of manganese and other 3d transition metal ions. Of these,  is quite different from other materials in its structure and electrochemical behaviors.2
3
4
5
6
7
8 Zhong et al.9 first reported several trials to prepare
is quite different from other materials in its structure and electrochemical behaviors.2
3
4
5
6
7
8 Zhong et al.9 first reported several trials to prepare  and electrochemical reactivity at about 4.7 V in nonaqueous lithium cells. If we applied low-temperature synthesis combined with one of sol-gel methods to prepare
  the samples having quite different signals in X-ray diffraction (XRD) and infrared (IR) among
  (Me: 3d transition metal) were obtained. The electrochemical behaviors of these samples in nonaqueous lithium cells, however, were difficult to measure because of instability of poorly crystallized materials with electrolyte at high voltage above 4.5 V. High-temperature synthesis is necessary to develop crystallite although the chemical composition of
  is difficult to control because of oxygen release above 700°C. After several trials, we have succeeded in preparing battery-active
  by the two-step solid-state reactions,2
3 which can deliver and store electricity more than 135 mAh/g at extremely flat operating voltage of ca. 4.7 V with good cycleability and rate capability. To demonstrate the applicability of thus obtained
by the two-step solid-state reactions,2
3 which can deliver and store electricity more than 135 mAh/g at extremely flat operating voltage of ca. 4.7 V with good cycleability and rate capability. To demonstrate the applicability of thus obtained  to lithium-ion batteries, we have proposed 3 V lithium-ion batteries2
3
10 with
to lithium-ion batteries, we have proposed 3 V lithium-ion batteries2
3
10 with  11 and
  which can cycle more than 1000 times with extremely flat operating voltage of ca. 3.0 V, which is equivalent to a manganese dioxide lithium primary battery or two silver-zinc alkaline primary cells connecting in series. Then, questions arise as to why such extremely flat operating voltage is observed and why longer cycleability of
  than
than  (more properly
  is realized. In order to answer these questions in relation to the crystal structure of
  a series of experimental and analytical studies were undertaken.
In this paper, we report the analytical results on the reaction mechanism of well-defined  in nonaqueous lithium cells, i.e., from
  to
to  via
via  and we show the reactions consist of two-phase reactions in an entire range.
Experimental
The nickel manganese double hydroxides (MX-008-3,  in molar ratio, obtained from Tanaka Chemical Corp. Ltd., Japan) were used as a starting material.
  were prepared by heating a reaction mixture of MX-008-3 and LiOH at 1000°C for 12 h followed by heating at 700°C for 48 h in air. A reaction product was ground using a mortar with a pestle and stored in a desiccator over blue silica gel before use.
The powdered XRD patterns were taken by an X-ray diffractometer (RINT2500V, Rigaku Corp. Ltd., Japan) using Cu Kα radiation with 50 kV of tube voltage and 300 mA of current. Structural analysis was performed using RIETAN2000.12 The samples prepared by an electrochemical method were characterized by XRD using diffractometer (XD-3A, Shimadzu Corp. Ltd., Japan) with Cu Kα radiation. Fourier transform infrared (FTIR) spectra of the samples were obtained by a KBr method using an FTIR spectrometer (FT-IR 8300, Shimadzu Corp. Ltd., Japan). Raman spectra of the samples were collected with a triple monochromator (Ramanor T-64000, Jobin-Yvon) using an excitation light of 5145.12 Å from Ar ion laser. A backscattering geometry was employed and the laser power was kept 20 mW on the samples. Electron diffraction (ED) measurements were performed using a transmission electron microscope (JEOL JEM2010F). Samples were dispersed in ethanol and were collected on a holey microgrid supported on a copper mesh.
Methods to prepare electrodes, electrochemical cells to examine samples and data acquisition system were the same as described previously.10
13 Electrolyte used was 1 M  dissolved in ethylene carbonate (EC)/dimethyl carbonate (DMC) (3/7 by volume) solution (Kishida Chemical Corp. Ltd., Japan). In fabricating the cells, all materials except the electrolyte and lithium metal were dried under vacuum at 60°C for at least 2 h to avoid possible contamination of water. For the electrochemical tests the current applied to the cell was 0.5 mA, which corresponds to the current density of 0.17 mA/cm2 unless otherwise noted. Other sets of experimental conditions are given in the Results section.
Results and Discussion
Characterization of  .—
.—

As were briefly reported previously,2
3 the well-defined diffraction lines from a spinel-framework structure with  and well-defined eight absorption bands in FTIR spectrum are characteristic of
  showing extremely flat operating voltage of ca. 4.7 V against a lithium electrode. To assess whether or not the prepared samples were identical with those reported previously, IR-Raman spectral measurements were carried out. As seen in Fig. 1, the identical samples with those in previous reports2
3 are obtained. In Raman spectrum, five strong lines are observed at 162 (not shown), 401, 491, 587, and 634 cm−1. Several weak lines at about 219, 241, 324 (not shown), and 604 cm−1 are also observed in the spectrum.8 Although assignment of each signal is difficult at present, the number of absorption bands and Raman lines is larger than that for
showing extremely flat operating voltage of ca. 4.7 V against a lithium electrode. To assess whether or not the prepared samples were identical with those reported previously, IR-Raman spectral measurements were carried out. As seen in Fig. 1, the identical samples with those in previous reports2
3 are obtained. In Raman spectrum, five strong lines are observed at 162 (not shown), 401, 491, 587, and 634 cm−1. Several weak lines at about 219, 241, 324 (not shown), and 604 cm−1 are also observed in the spectrum.8 Although assignment of each signal is difficult at present, the number of absorption bands and Raman lines is larger than that for  14
15 which strongly suggests that the symmetry of
14
15 which strongly suggests that the symmetry of  is lower than that of
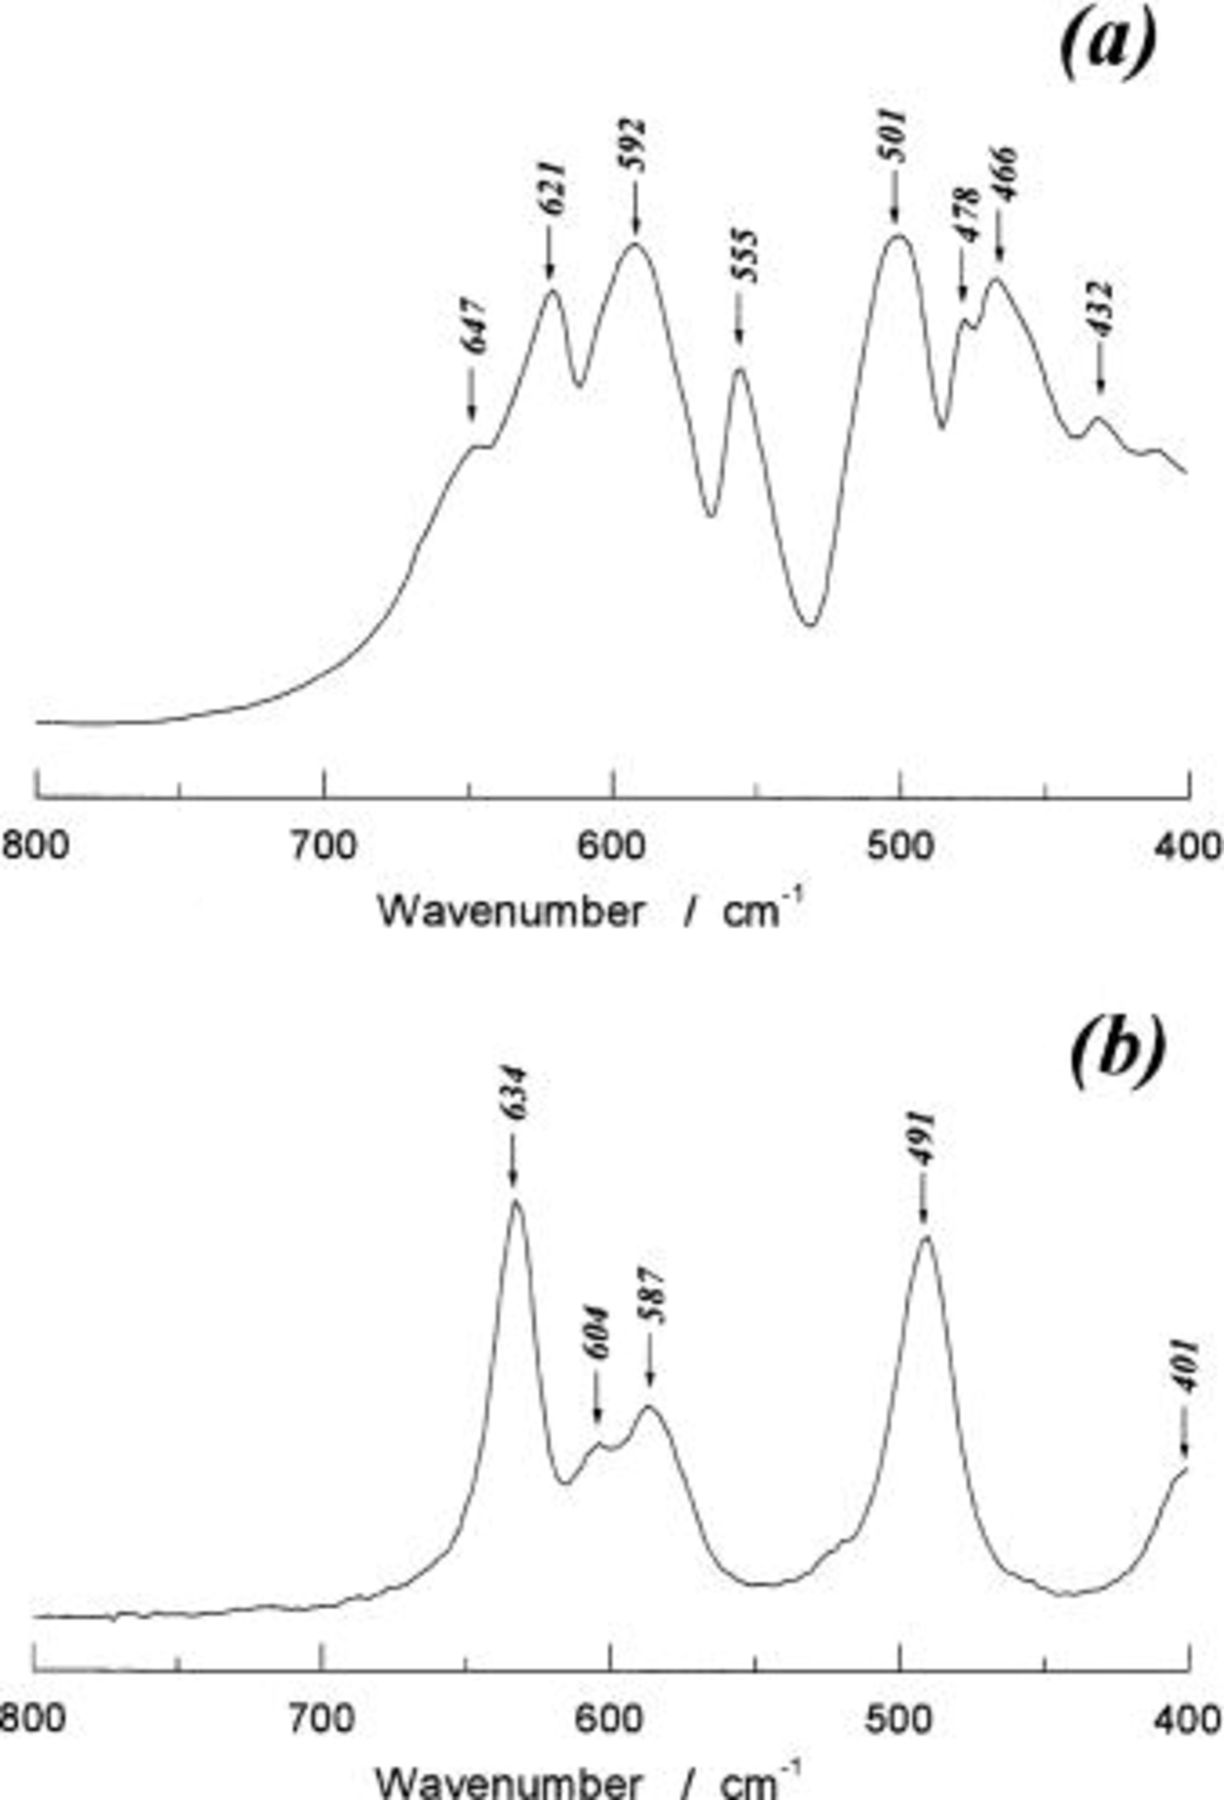
Figure 1. The IR Raman spectra of  prepared by a two-step solid-state reaction, (a) Fourier transform infrared spectrum and (b) Raman scattering spectrum with a 5145.12 Å line of an argon laser at 20 mW power excitation.
Figure 2 shows the [100] zone ED pattern of  The
The  reciprocal lattice plane of
  is illustrated in Fig. 2b. The weak, but clear, extra spots are seen in Fig. 2a in addition to the fundamental spots based on the space group of
  This indicates that nickel and manganese ions are regularly distributed at the octahedral 16(d) sites in a space group of
  In other words,
  adopts a superlattice structure due to the cation ordering at the octahedral 16(d) sites. If we assumed that
  is a spinel-framework structure
  in which nickel and manganese ions are located at the octahedral 16(d) sites and lithium ions are located at the tetrahedral 8(a) sites in a cubic close-packed oxygen array, we cannot explain IR-Raman spectra in Fig. 1 and the superlattice spots in Fig. 2a while a structure of
  is closely related to
  According to neutron diffraction and infrared spectroscopy studies on
 by Gryffroy et al. ,16
17 they described the structure in terms of the 1:3 cation-ordering at the spinel B sites [16(d) sites in
by Gryffroy et al. ,16
17 they described the structure in terms of the 1:3 cation-ordering at the spinel B sites [16(d) sites in  with
with  space group symmetry. The present ED observations agree with their description, although
  spots with
  (n: integer) forbidden for the space group
  are seen in Fig. 2a because of the double diffraction effect. To confirm a cubic symmetry, the [111] zone ED pattern is shown in Fig. 3. There is no doubt about a cubic lattice, i.e., a threefold rotation axis along a [111] direction. Weak, but clear superlattice spots are also seen in Fig. 3. The ED patterns with other zone axes also showed superlattice spots based on the
  space group symmetry, so that we assume a space group of
  in which nickel ions are located at the octahedral 4(b) sites, manganese ions are at the octahedral 12(d) sites, and lithium ions are at the tetrahedral 8(c) sites to illustrate the structure of
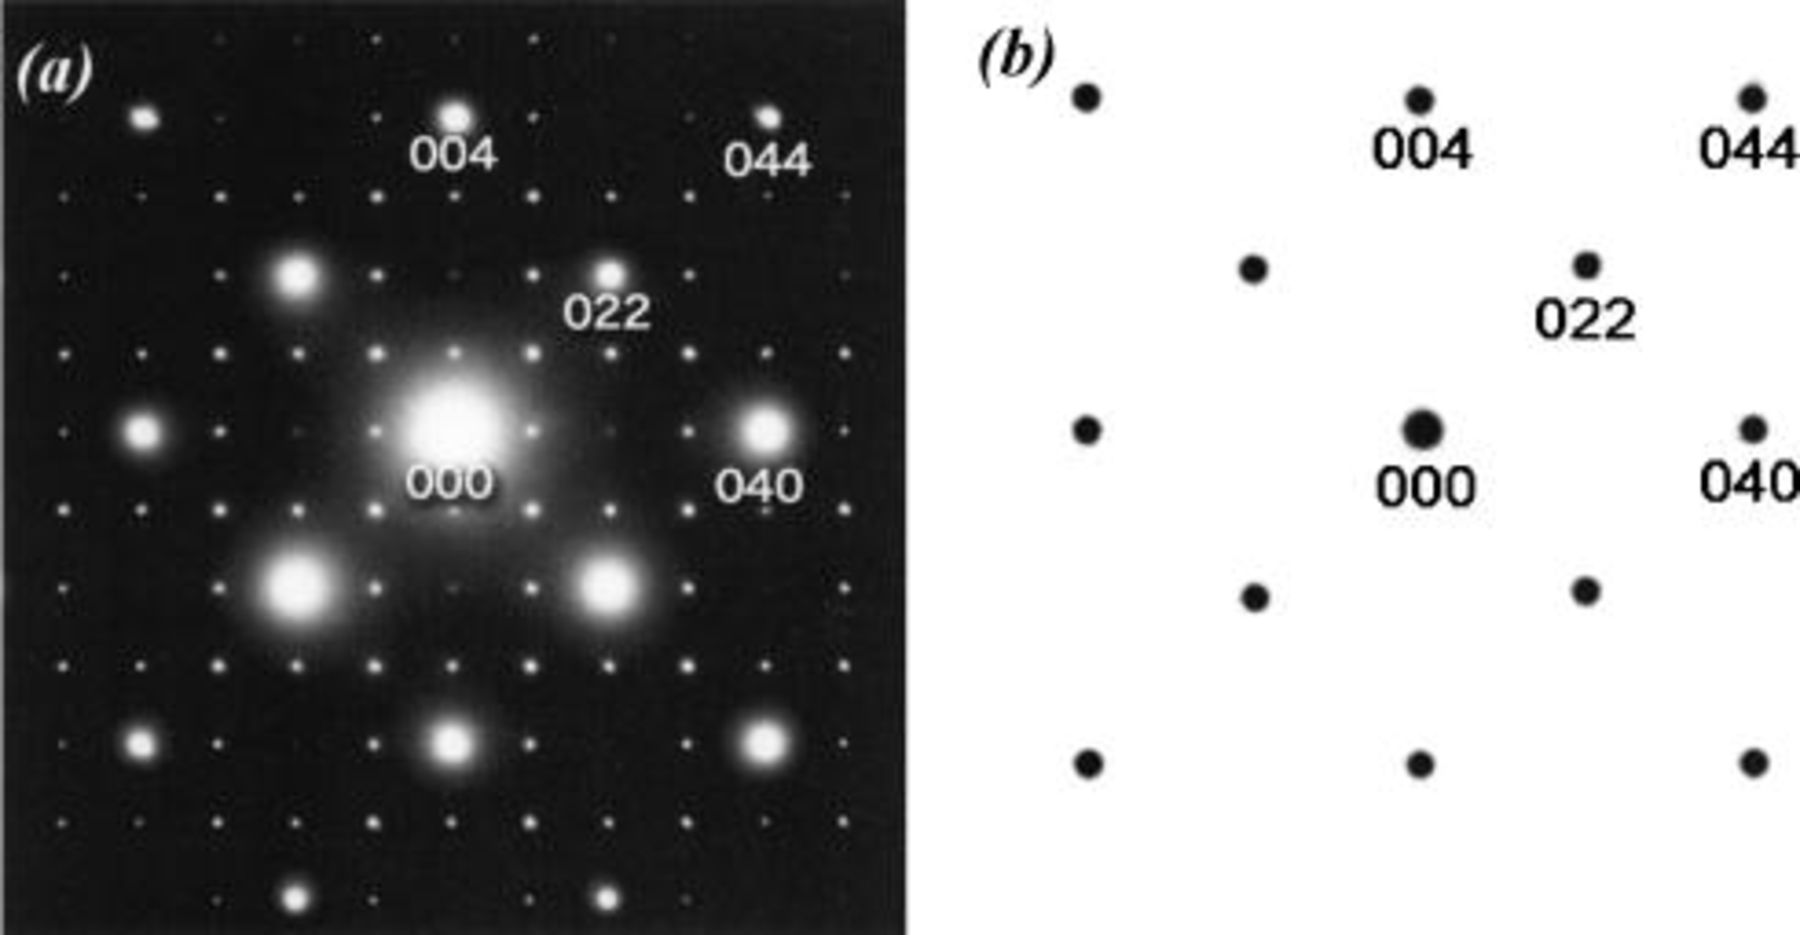
Figure 2. Electron diffraction pattern of  (a) observed [100] zone ED pattern and (b) (100)* reciprocal lattice plane calculated for
 Extra spots can be seen for
  in addition to the fundamental spots for

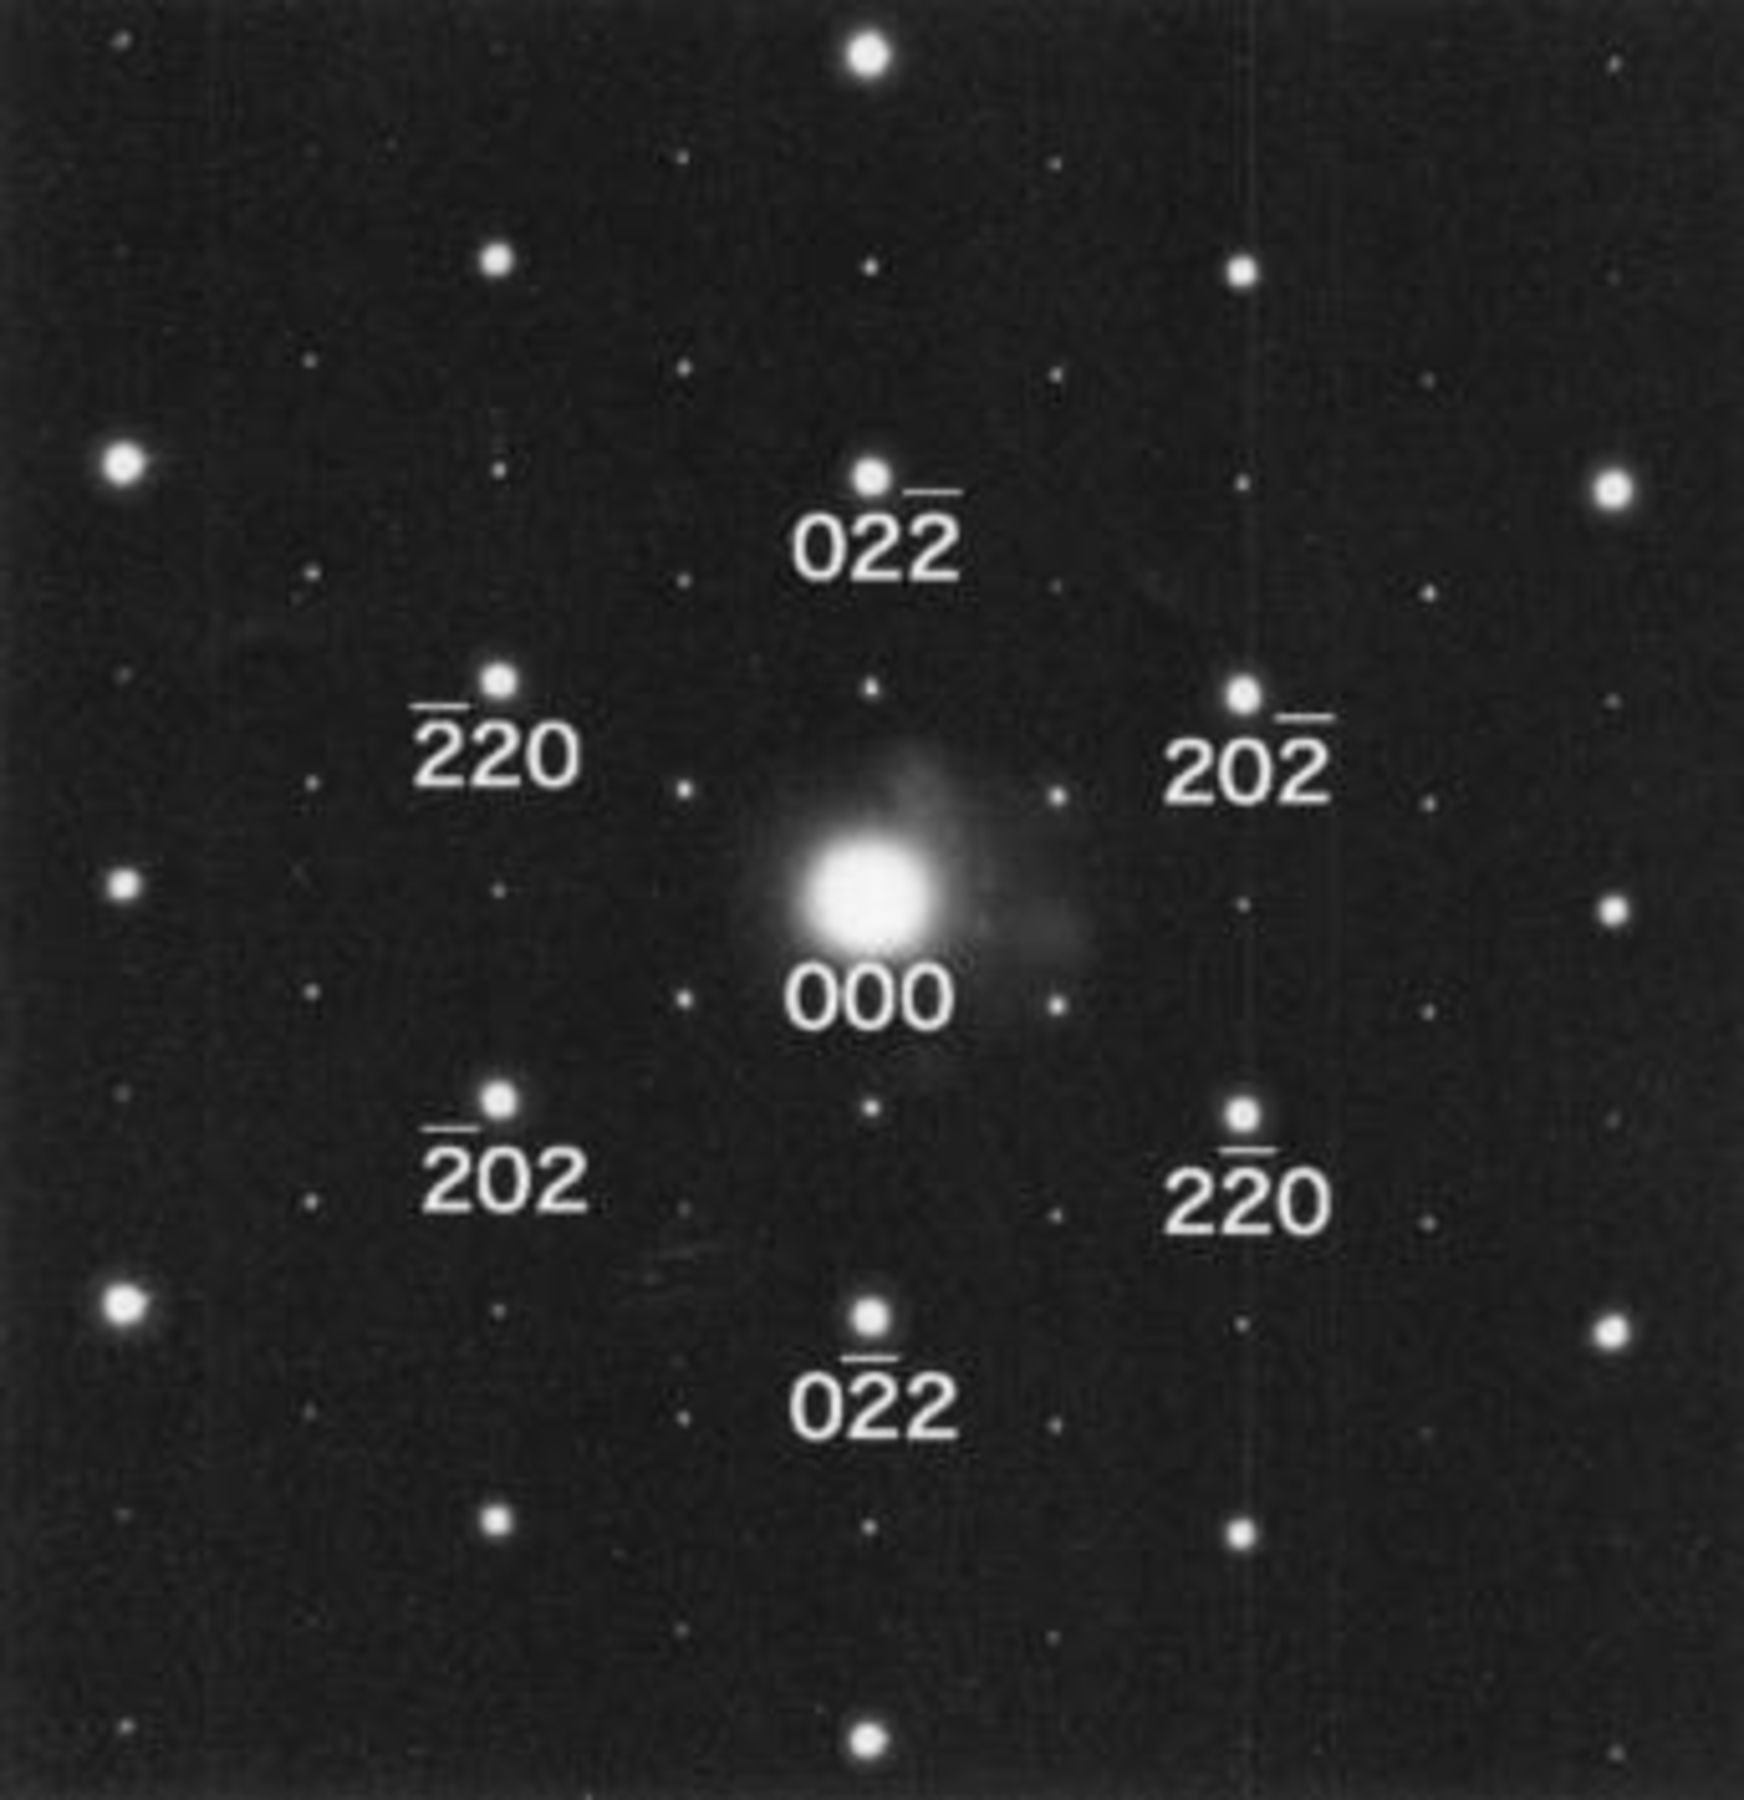
Figure 3. The [111] zone ED pattern of 
Figure 4 shows the result on a structural refinement of the powdered XRD of  by a Rietveld method. To show extra diffraction lines, called superlattice lines, such as (110), (210), (310), etc., in addition to the diffraction lines usually observed for
  the observed extra lines are enlarged in Fig. 4. Structural parameters are summarized in Table I. The reliable parameters in parentheses are given for the observed XRD pattern of
  The reasonable fit of
  with
with  was obtained by assuming a space group of
  In
In 
 the 1:3 cation-ordering between nickel and manganese ions can be seen at the octahedral 16(d) sites in
  i.e., the octahedral 16(d) sites in
  are divided into the octahedral 4(b) and 12(d) sites in
  and then we can distinguish
  -octahedron from
  -octahedron in a solid matrix, resulting in characteristic eight absorption bands in IR spectrum in Fig. 1a.
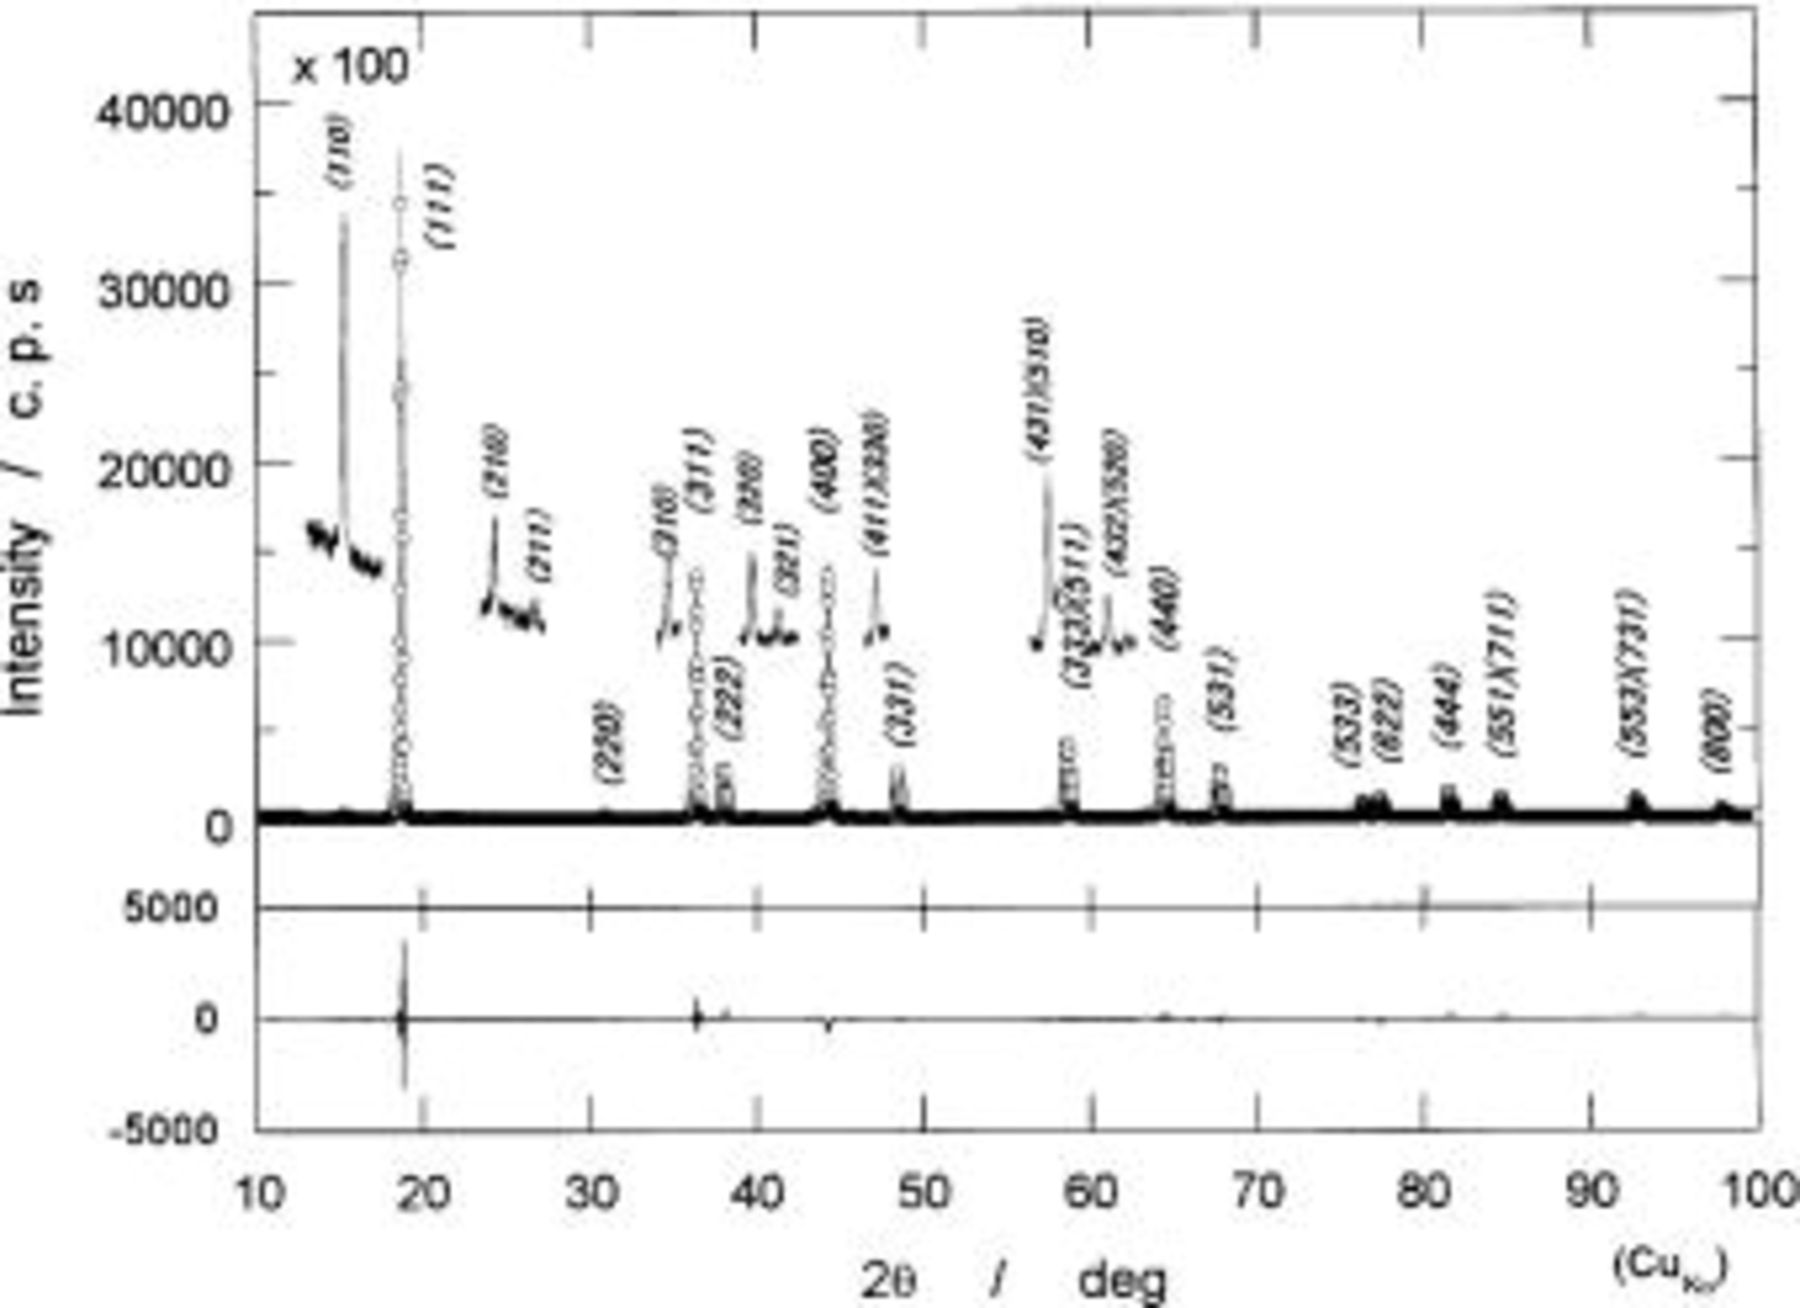
Figure 4. Results on a structural refinement of a powdered XRD pattern of  by a Rietveld method. Open-circles indicate observed intensity and a solid curve indicates the calculated pattern by using the parameters listed in Table I. Difference between observed and calculated patterns is shown at the bottom. To show weak diffraction lines characteristic of
 several lines are extended at the same locations (see in text).
Table I.
Summary on the structural refinement of 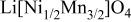 by a Rietveld method assuming a space group of by a Rietveld method assuming a space group of  | ||||||
|---|---|---|---|---|---|---|
Space group      | ||||||
| Atom | Site | x | y | z | Occupancy | B(Å2) |
| Li | 8(c) | 0.000(1) | 0.000(1) | 0.000(1) | 1.000 | 0.8(2) |
| Ni | 4(b) | 5/8 | 5/8 | 5/8 | 1.000 | 0.99(8) |
| Mn | 12(d) | 1/8 | 0.3790(2) | −0.1290(2) | 1.000 | 0.45(3) |
| O(1) | 8(c) | 0.3833(5) | 0.3833(5) | 0.3833(5) | 1.000 | 0.9(2) |
| O(2) | 24(e) | 0.1269(4) | 0.1483(5) | 0.8571(4) | 1.000 | 1.48(9) |
As far as the selection of a space group is concerned,  is identical with
  to illustrate the crystal structure of
  so that anti-phase boundaries in a solid matrix may be an interesting feature of
  The understanding on the structural character of
  is important to develop the lithium insertion materials more for advanced lithium-ion batteries, which is out of scope in this paper. In this paper the structure of
  is described in terms of a space group of
  and the sample characterized by Fig. 1 to 4 was used hereafter.
Charge and discharge curves of cells operated in voltages of 3.0-4.9 V and the XRD observations on the positive electrodes.—
Figure 5 shows the charge and discharge curves of the  cells operated in voltages of 3.0 to 4.9 V at a rate of 0.17 mA/cm2 at 30°C. The open-circuit voltages (OCVs) of the freshly prepared cell were about 3.2 V. On charging, the operating voltage quickly reached 4.7 V during the initial 10 mAh/g of charge capacity and then it leveled off at the same voltage. At 138 mAh/g, the operating voltage increased to the cutoff voltage of 4.9 V. When the cell was cycled back, the voltage followed just below the charge voltage in the opposite direction. The difference in voltage between charge and discharge curves was about 30 mV. Charge and discharge curves for 5 cycles are shown in this figure, which merged in a single curve. Rechargeable capacity was ca. 135 mAh/g corresponding to 91% of the theoretical capacity of 148 mAh/g calculated from a formula weight of
  by assuming one-electron transfer per a formula unit.
Figure 5. Charge and discharge curves of a  cell operated at 0.17 mA/cm2 in voltages of 3.0-4.9 V. Bar-code-type indication shows the location at which the XRD examinations were carried out.
In order to follow the change in crystal structures of  electrodes, the ex situ XRD examinations were carried out. Bar-code-type indications in Fig. 5 show the locations at which XRD measurements were carried out. Because the change in shape of diffraction lines is important in this range, the observed XRD patterns are given in Fig. 6. If each diffraction line is broad due to undeveloped crystallite size, we cannot identify the increase in number of diffraction lines. In Fig. 6c, e, and f, splitting in each diffraction line can be seen, but not clearly. To show more clearly in this aspect, the diffraction patterns in 40-70° in 2θ(Cu Kα) are shown in Fig. 7. On charging of
  every diffraction line is split into two lines. One is of the starting material of
  and its intensity decreases on charge, and another is situated at the higher diffraction angles and its intensity concurrently grows at its location until charge capacity reaches about 80 mAh/g, at which any diffraction line of
  cannot be seen and all diffraction lines can be indexed by using the same Miller indexes as those of
  This clearly indicates that the reaction proceeds in two phases in charge capacity of 0 to ca. 80 mAh/g. Observation in ca. 80 to 138 mAh/g is the same as that in 0 to ca. 80 mAh/g, indicating the coexistence of two phases during the reaction. From these observations, all diffraction lines are indexed and the lattice parameter is calculated by a least-squared method using 10-14 diffraction lines depending on the number of well-defined diffraction lines. Thus obtained lattice parameters as a function of the charge capacity in mAh/g are shown in Fig. 8. In this region, cubic phases having
 and
and  are identified. As seen in Fig. 5 with Fig. 8, the reaction consisted of two topotactic two-phase reactions, leading to extremely flat operating voltage of about 4.7 V.
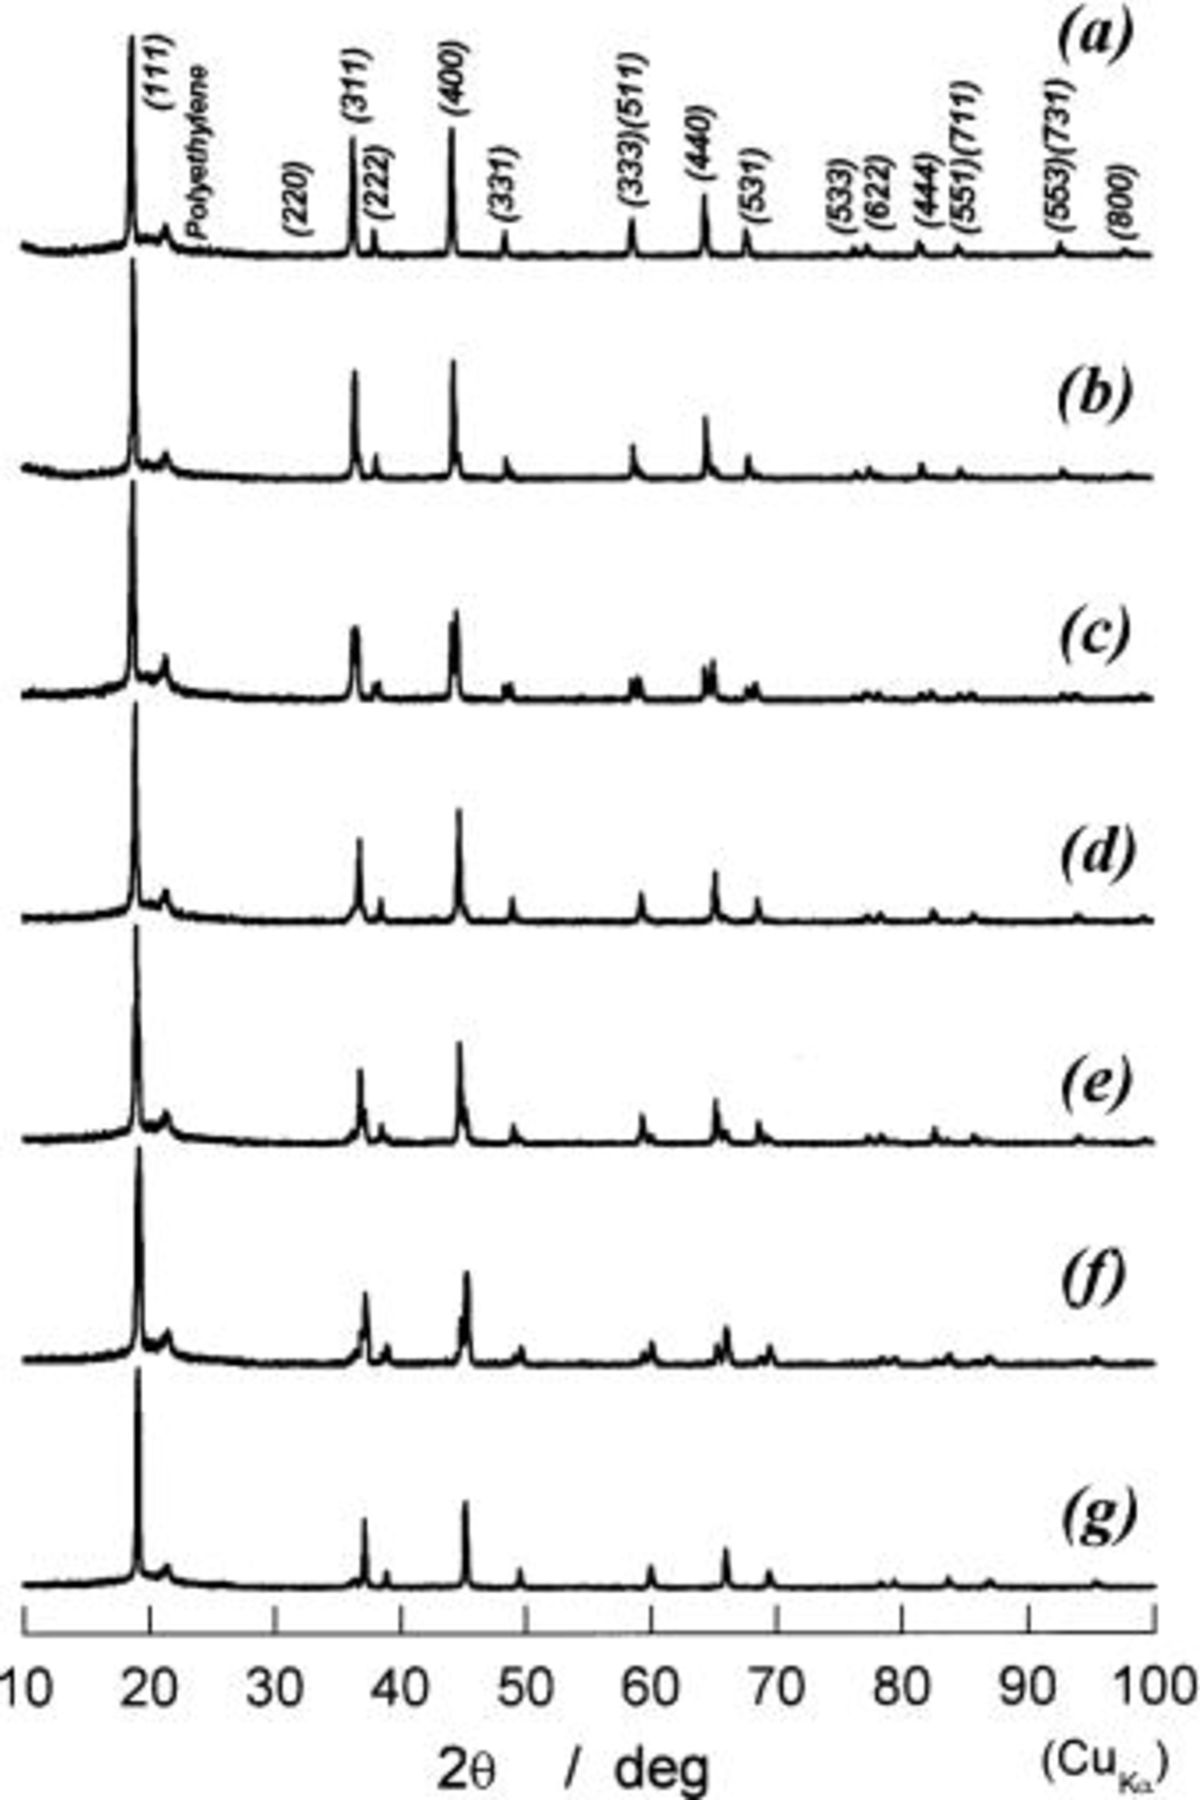
Figure 6. XRD patterns of partially or fully charged  (a) 0 mAh/g of charge capacity, (b) 25 mAh/g, (c) 53 mAh/g, (d) 80 mAh/g, (e) 100 mAh/g, (f) 125 mAh/g, and (g) 138 mAh/g.
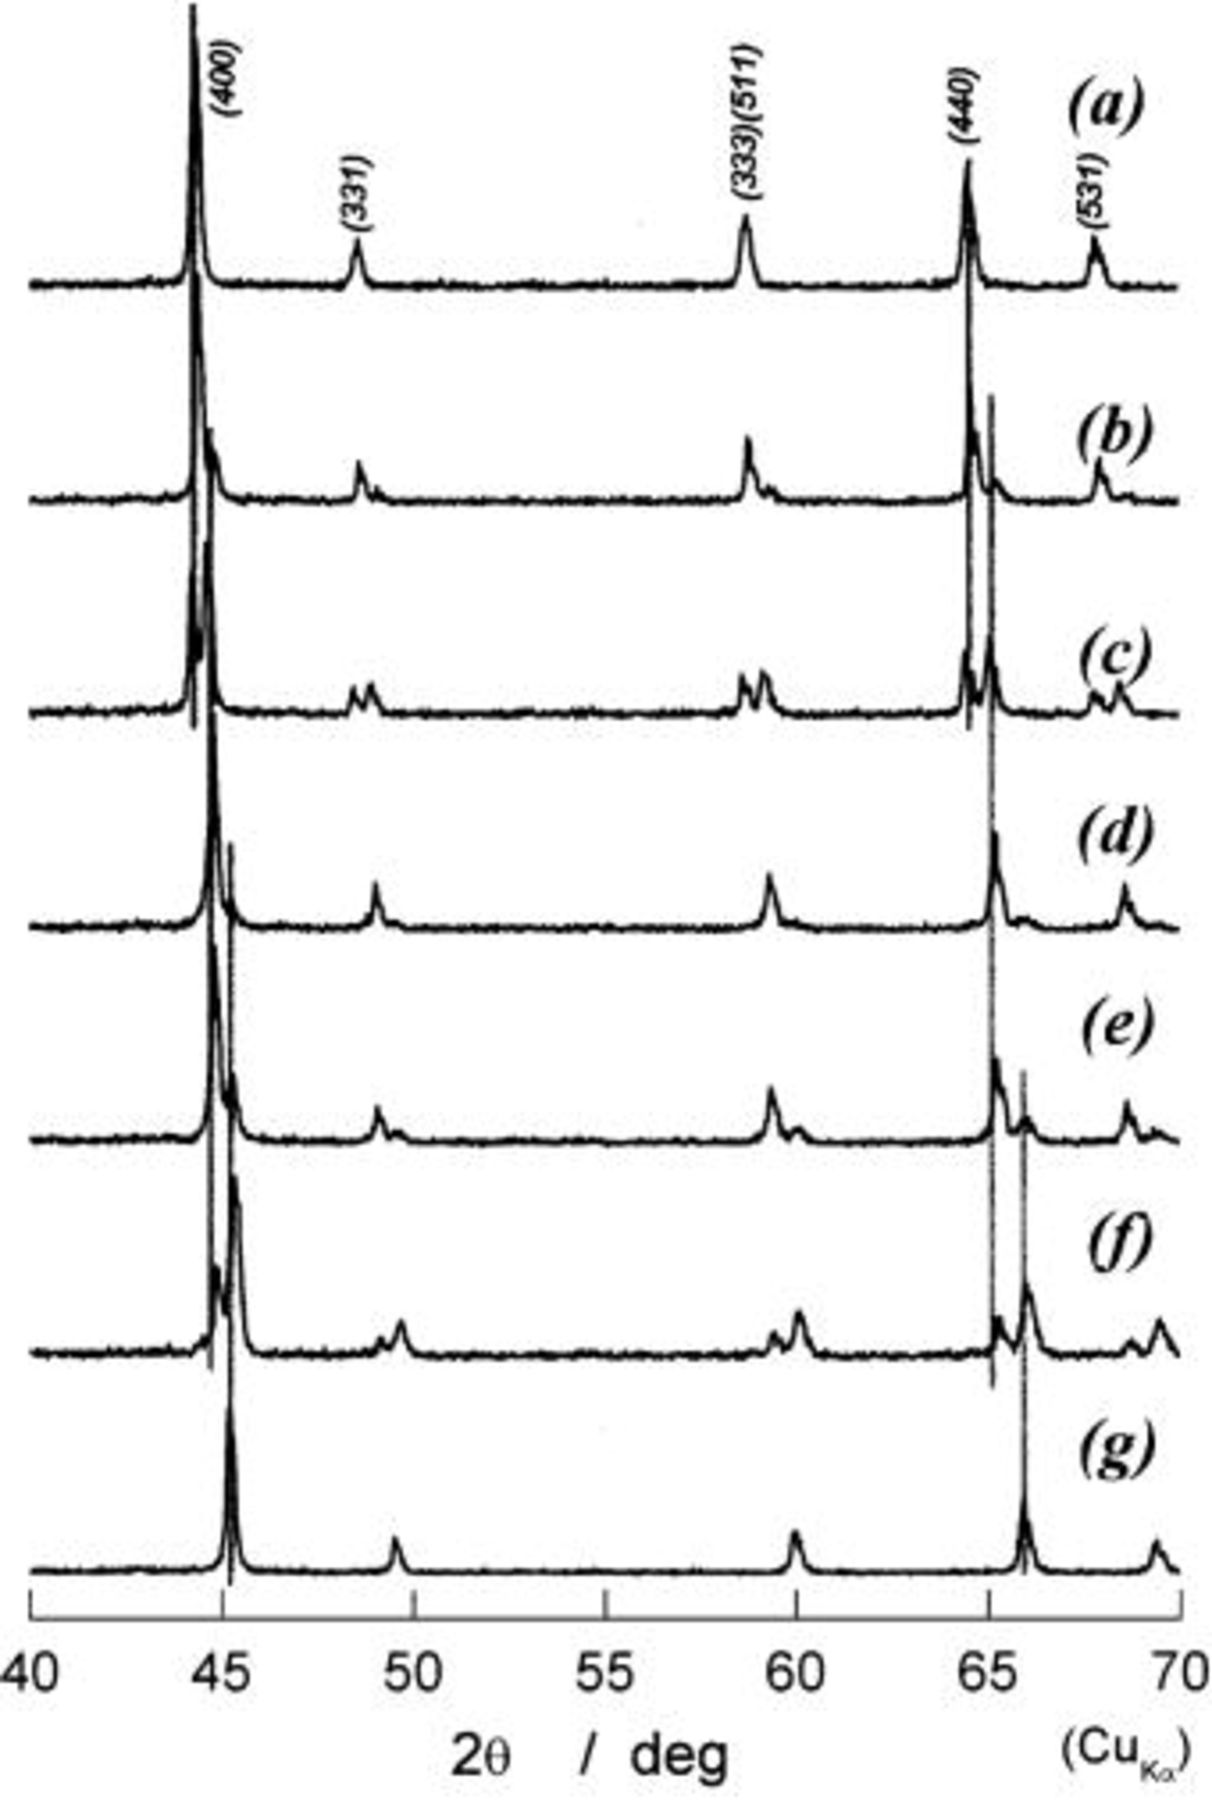
Figure 7. Detailed XRD patterns in diffraction angles from 40 to 70° in 2θ for a to g in Fig. 6. Three lines drawing at ca. 45° and 65° are used to guide the eyes.
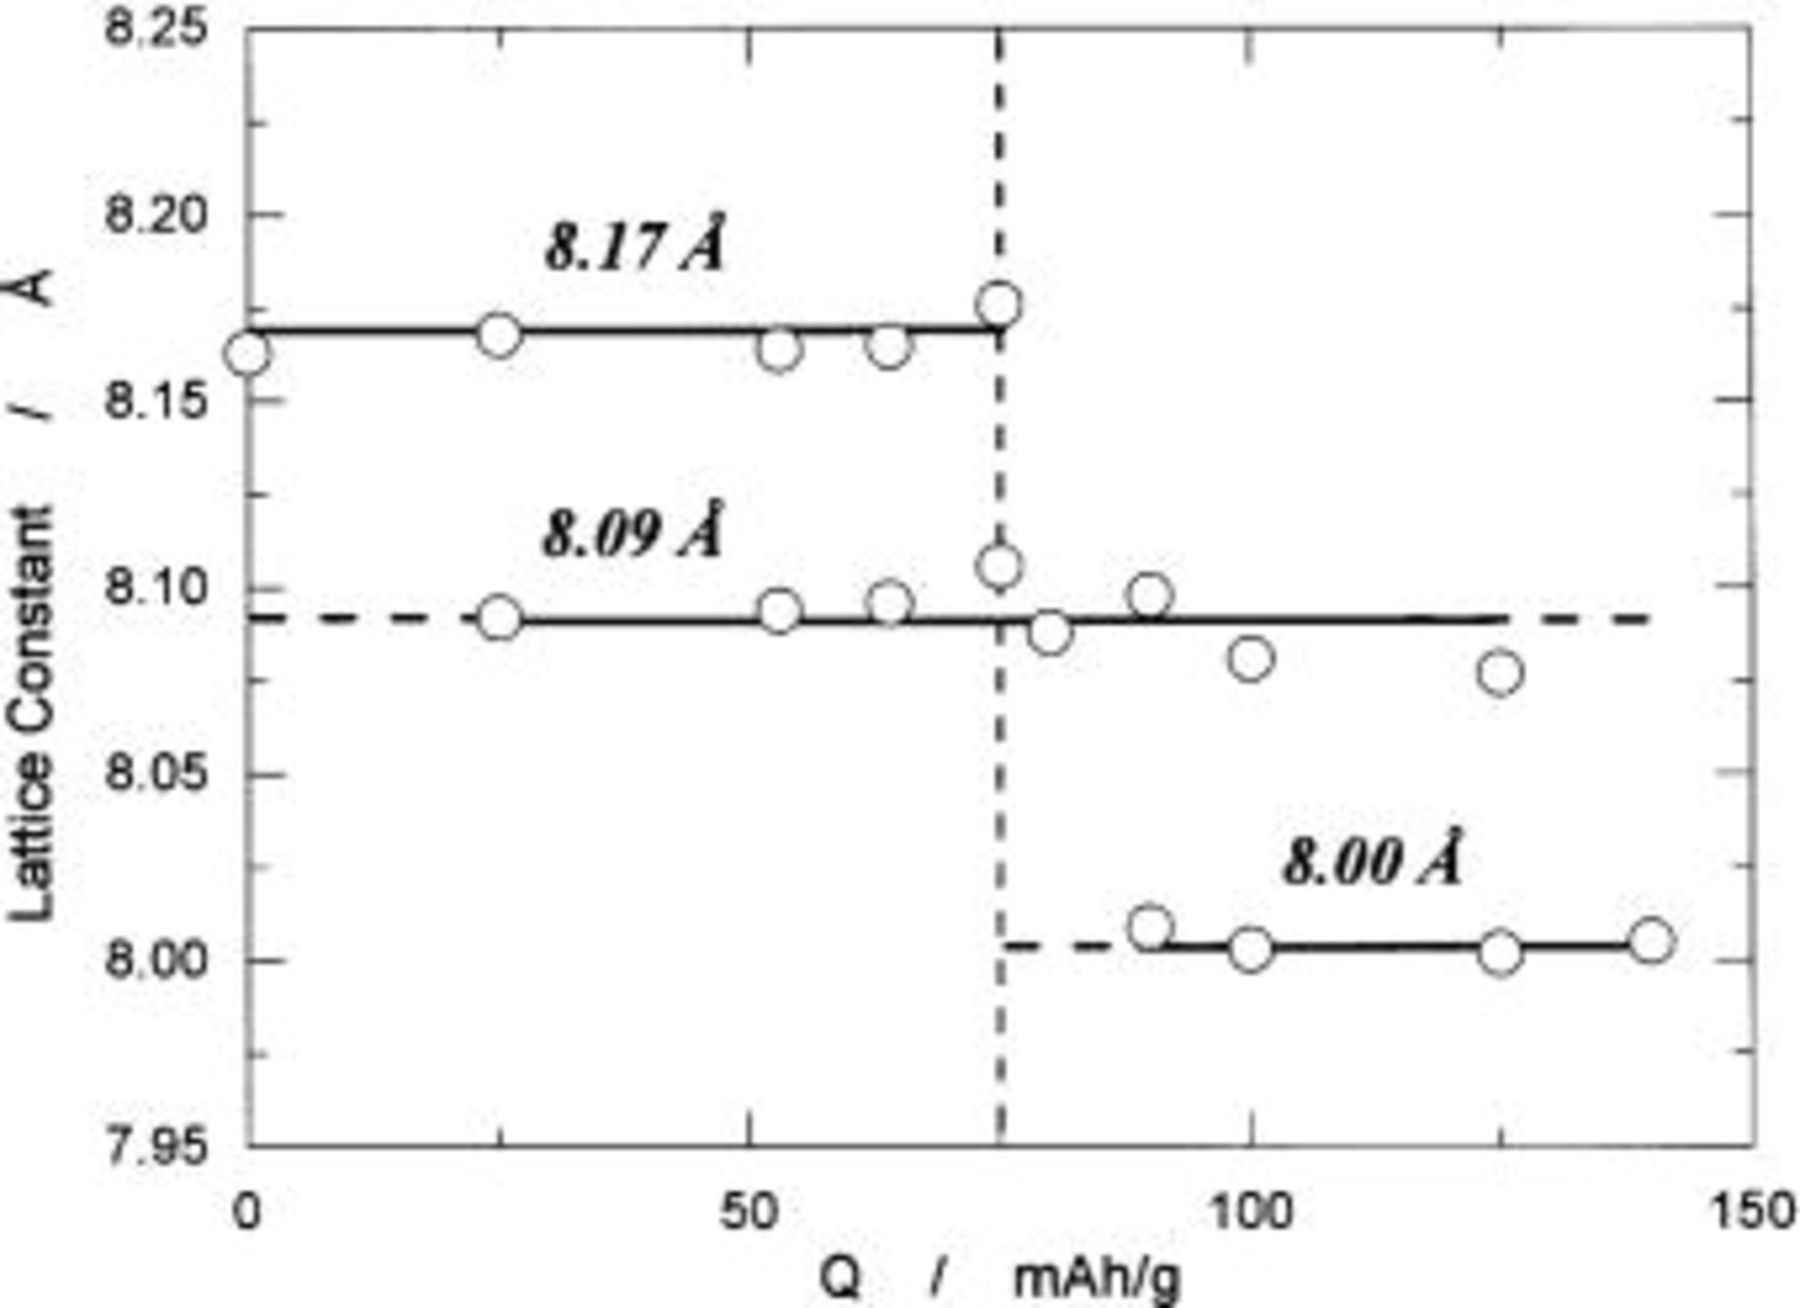
Figure 8. The change in lattice parameters as a function of charge capacity in mAh/g based on  weight.
Electrochemical reaction of in voltages of 1.2-4.0 V vs. Li and the XRD observations.—
We are interested in scientific aspect of solid-state chemistry and electrochemistry of 
 so that the
  cells were operated in voltages of 1.2 to 4.0 V. This voltage range or operation mode is useless for us in considering the positive electrode materials for lithium-ion batteries. Figure 9 shows the discharge and charge curves of the
  cells operated in 1.2-4.0 V. When the current was switched on, the cell voltage dropped quickly down to 2.8 V and remained at 2.8 V until the discharge capacity reached 70 mAh/g, and then voltage decreased to 2.0 V. In 135 to 195 mAh/g of discharge capacity, the voltage linearly fell down to 1.2 V as the reaction proceeded. When the cell was cycled back to 4.0 V, operating voltage increased linearly from 1.2 to 2.0 V and it jumped up to 2.9 V at ca. 150 mAh/g of discharge capacity. After staying at 2.9 V, the cell voltage gradually increased to 3.7 V with drawing a plateau. Theoretical capacity in this range is calculated to be 148 mAh/g assuming one-electron transfer per a formula unit of
  Because the observed discharge capacity of 195 mAh/g is more than the theoretical capacity of 148 mAh/g, something happens in voltage of 1.2-1.8 V or in 145-195 mAh/g of discharge capacity in Fig. 9.
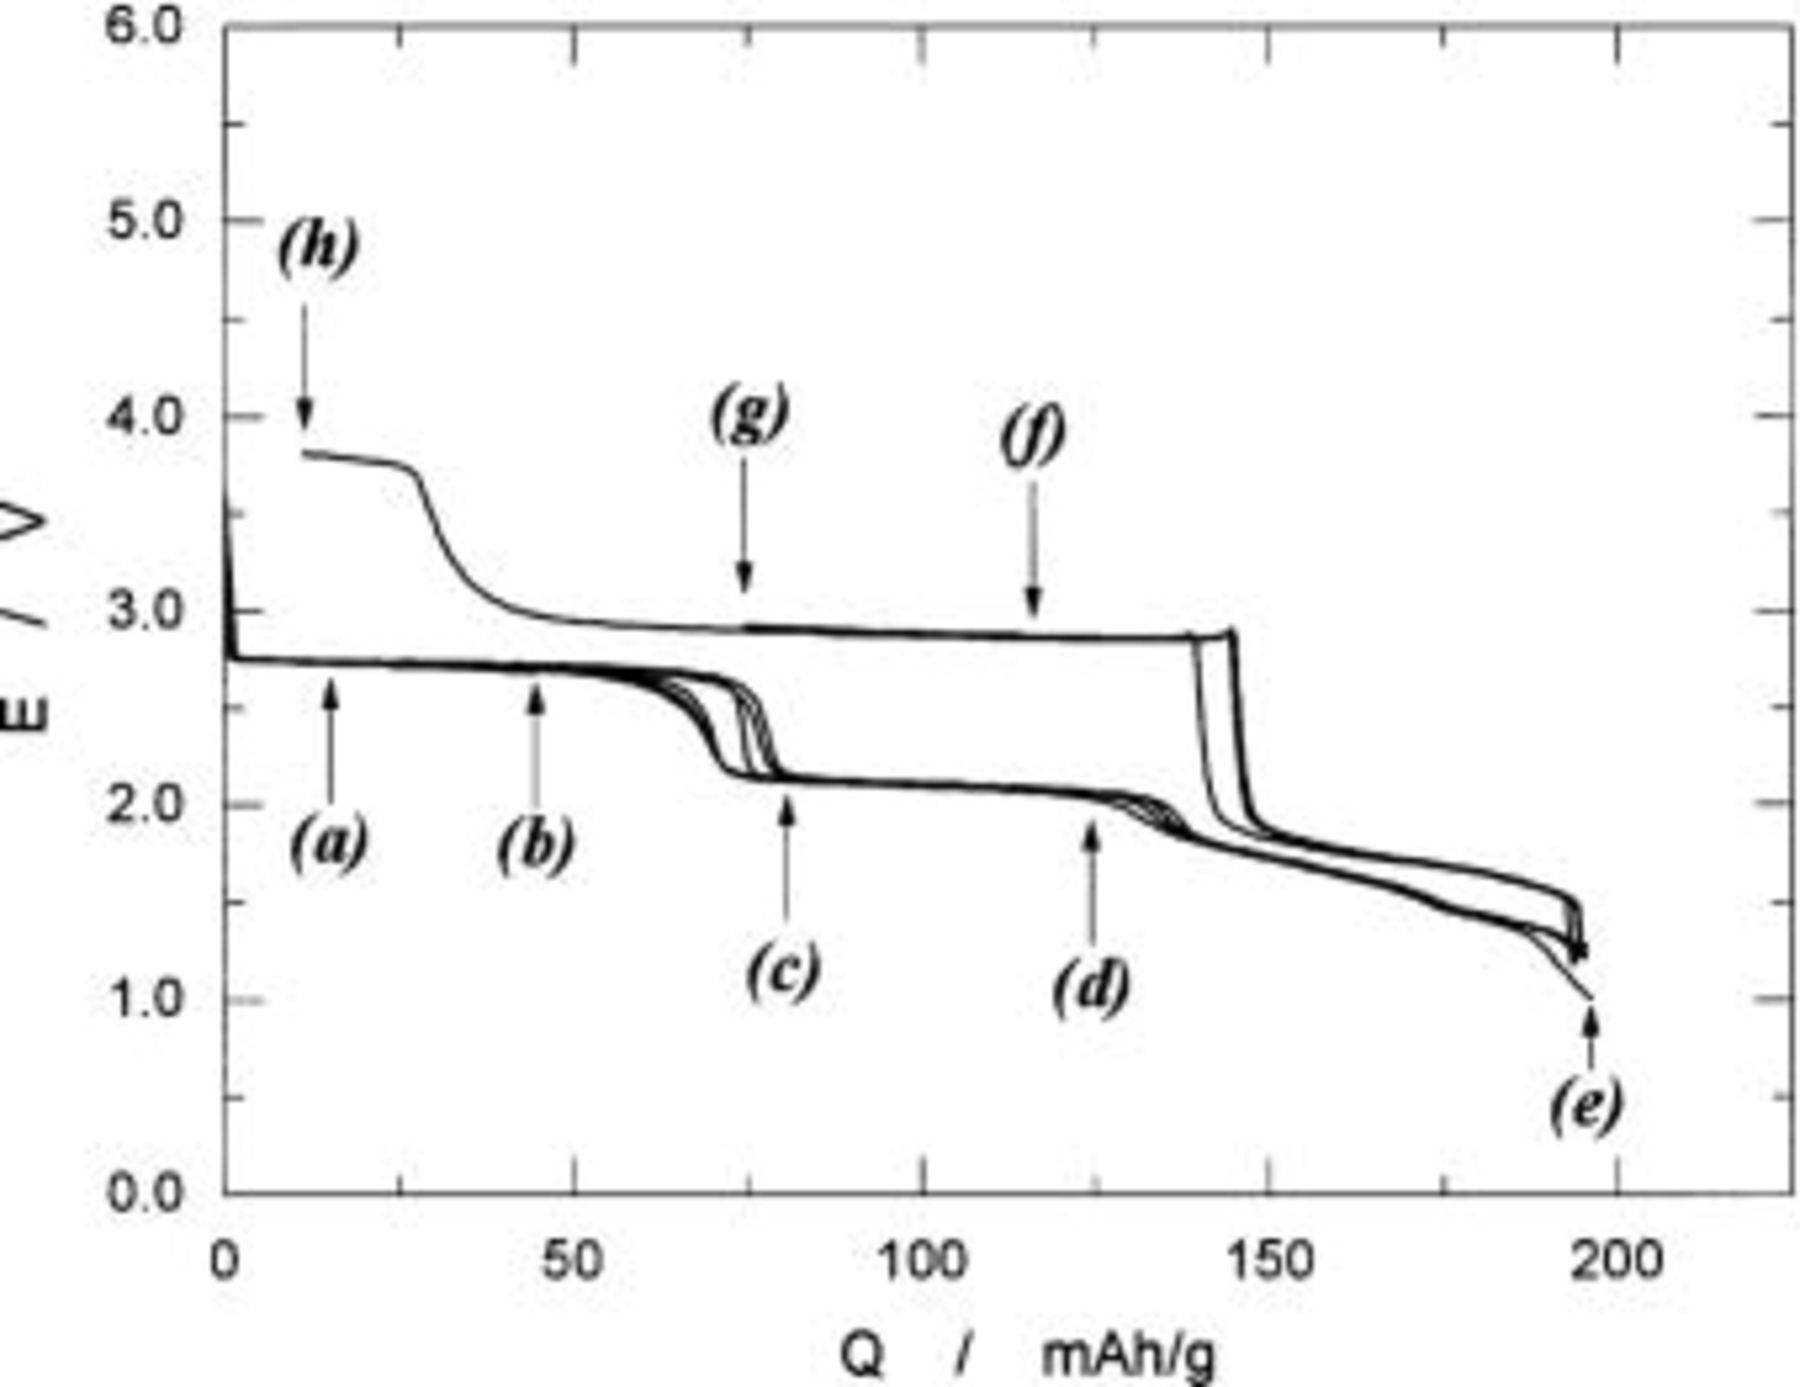
Figure 9. Discharge and charge curves of the  cells operated at 0.17 mA/cm2. Arrows indicate the locations at which XRD examinations were carried out.
A hysteresis loop in discharge and charge curves and overshoot (or small spike) on charge in voltage at 145 mAh/g in Fig. 9 remind us the behaviors for a two-phase reaction.18 To examine whether or not our expectation is correct and what kind of reaction occurs in 145-195 mAh/g in Fig. 9, the ex situ XRD examinations were carried out at (a) to (h) in Fig. 9. The change in XRD patterns in terms of the location of diffraction lines and their shapes is important in speculating the reaction mechanism of this region combining with the electrochemical results in Fig. 9. We show raw data taken on discharge, a to e in Fig. 9, and on charge, e to h, are, respectively, shown in Fig. 10 and 11. As is seen in Fig. 10(d), all diffraction lines are indexed assuming a tetragonal lattice and the lattice parameters are calculated to be  and
and  XRD pattern e in Fig. 10 taken at 195 mAh/g of discharge capacity is almost the same as d except line broadening, such as (004), (224), or (404) line. Lattice parameters calculated for e are
  and
and  which is less reliable due to line broadening and weakness in intensity. On charging process of e to h in Fig. 9, each diffraction line, such as (103), (004), or (224) line, is shaped up in e to f in Fig. 11 followed by the disappearance of these lines due to the structural change from tetragonal to cubic, and finally a cubic phase with
  is observed.
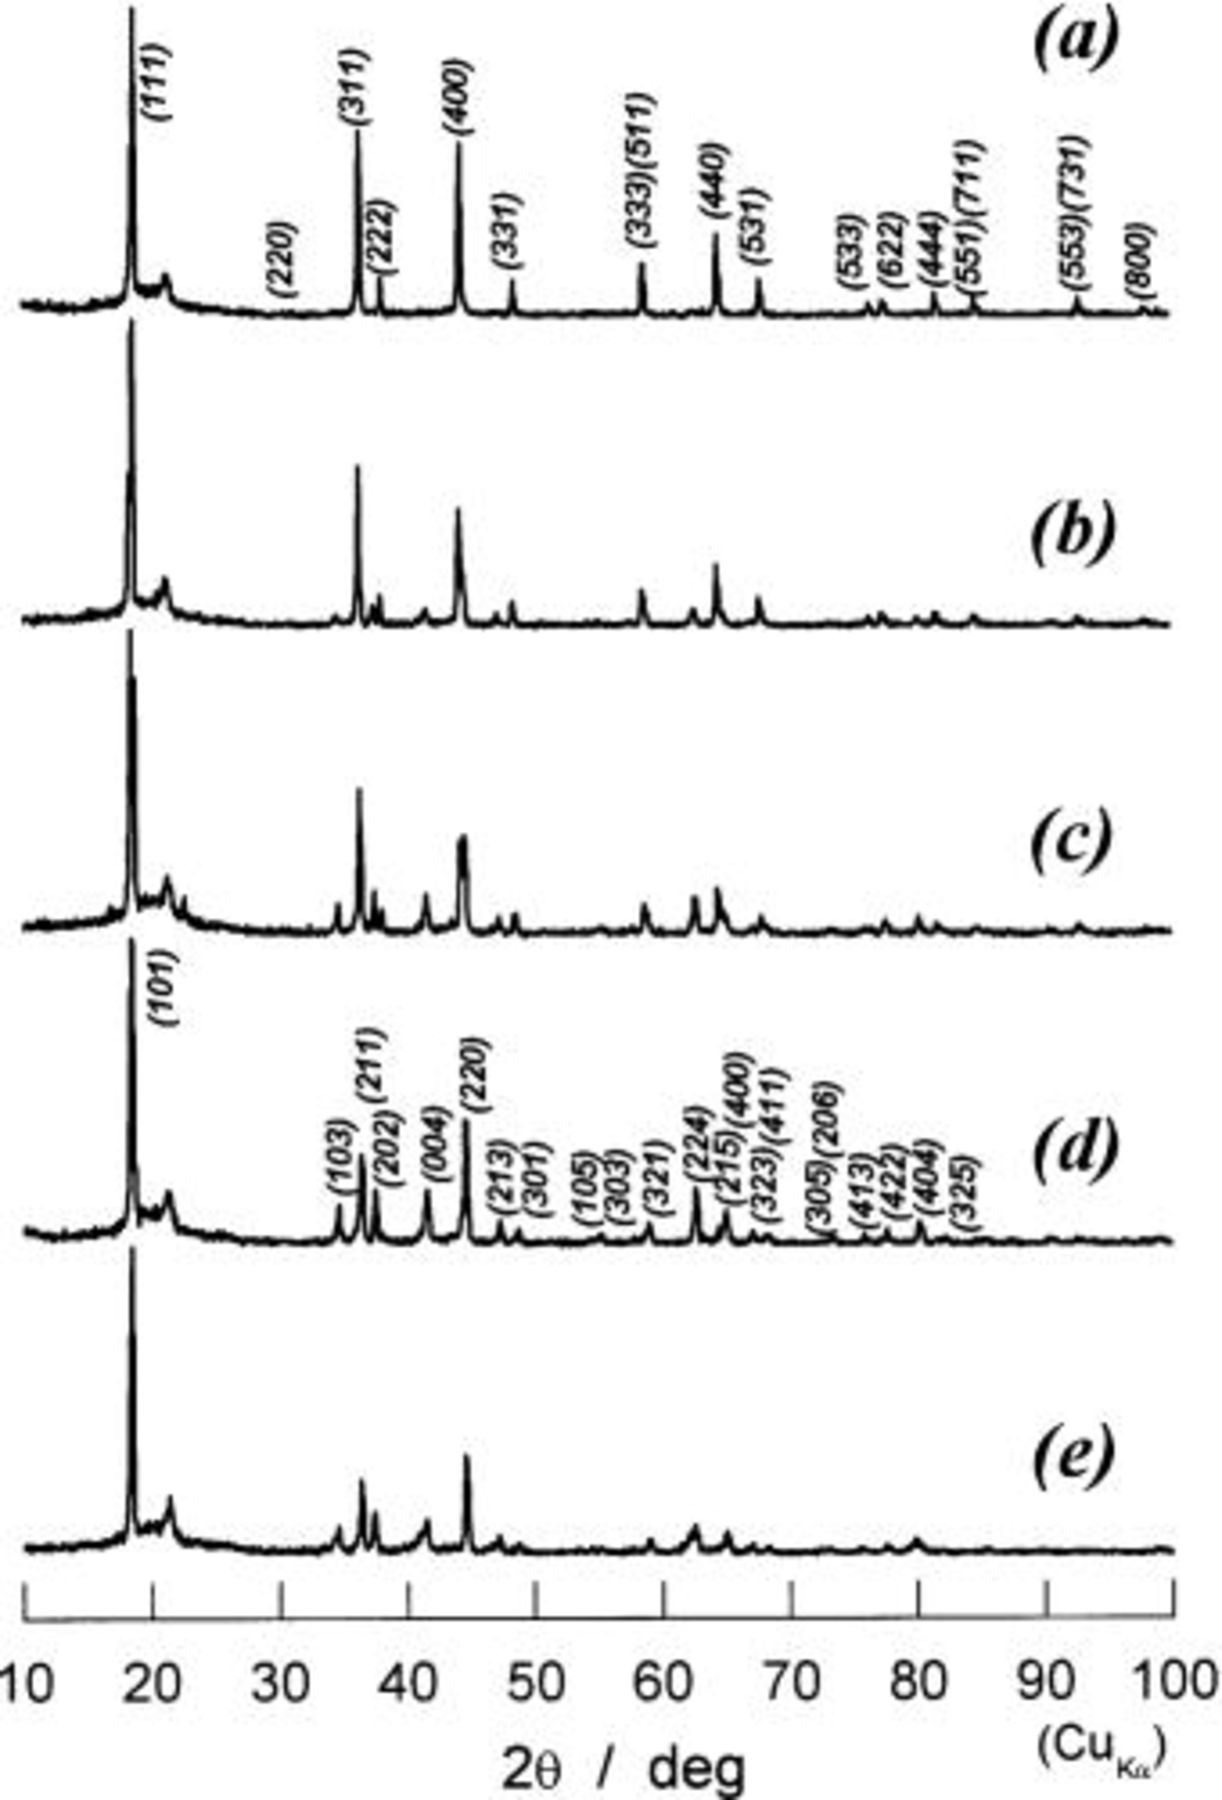
Figure 10. The XRD patterns of the samples prepared by the electrochemical reduction of  (a) 15 mAh/g of discharge, (b) 45 mAh/g, (c) 80 mAh/g, (d) 125 mAh/g, and (e) 195 mAh/g. Each sample history is given in Fig. 9a to e in term of discharge curve and capacity.
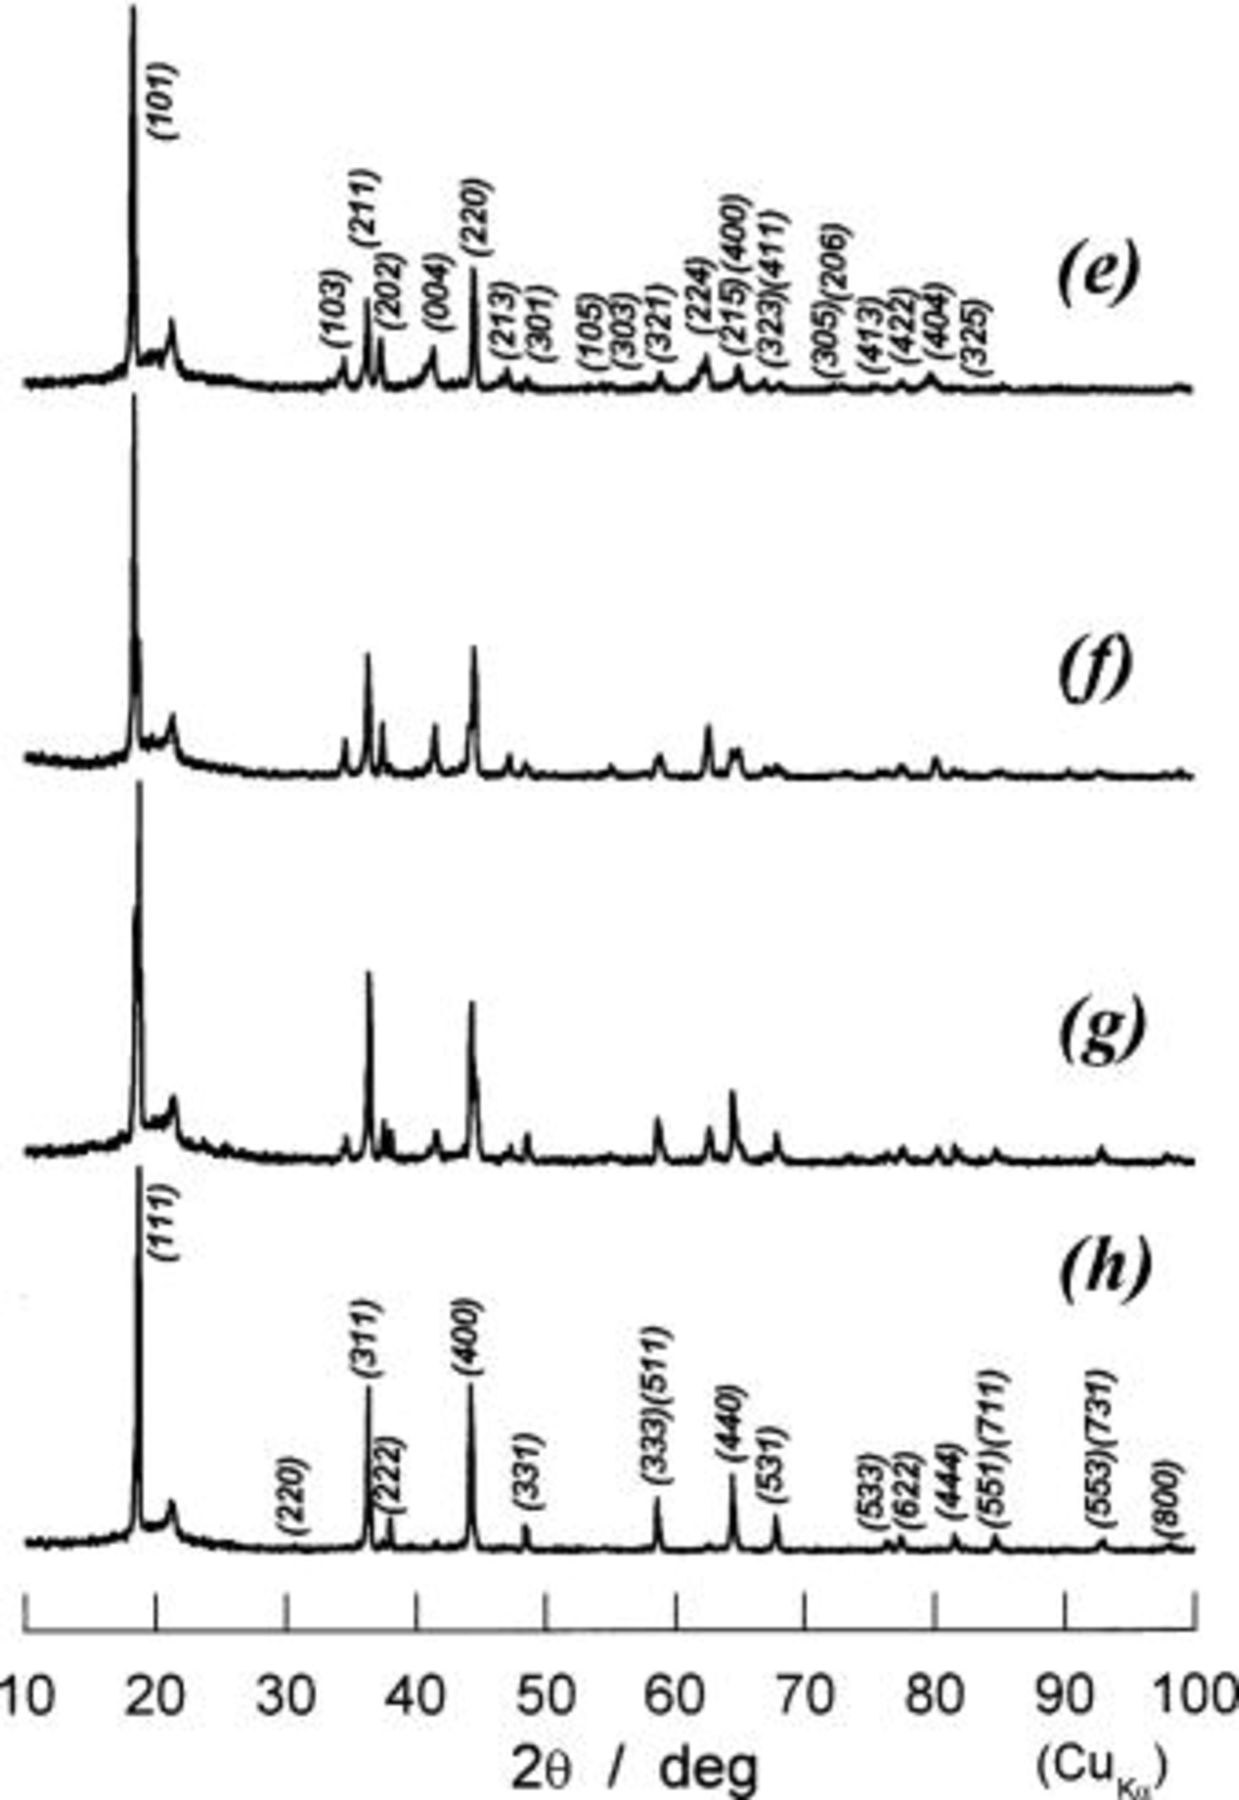
Figure 11. The XRD patterns of the samples prepared by the electrochemical reduction of  up to ca. 195 mAh/g (or 1.2 V) followed by the oxidation of (e) 0 mAh/g, (f) 80 mAh/g, (g) 120 mAh/g, and (h) 183 mAh/g. Each sample history is given in Fig. 9e to h.
As were described above, 
 is reduced to
  (tetragonal) and further reduction than
  is possible in a tetragonal phase and the reduction product is oxidized to the initial state of
  via
via 
Open-circuit voltage curves of .—

Results on the XRD examinations described in the previous sections suggest that the reaction from  to
to  via
via  proceeds topotactically in two phases. If the reaction consists of topotactic two-phase reactions over the entire range, we should have constant voltages independent of x in
  in a certain range of x. Since the equilibrium voltage measurements are actually impossible because of several experimental limitations, we measure OCVs as a function of charge or discharge capacity in mAh/g based on
  weight. To measure OCVs at higher voltages than 4 V,
  cells were intermittently charged and discharged at 0.17 mA/cm2 (20 min current on and 3 h off) in voltages of 3.0-4.9 V. The conditions were so determined that reliable voltage was obtained at about 4.7 V as is discussed later. In measuring OCVs in 1.2-3.0 V, we applied the constant current of 0.17 mA/cm2 for 1 h on and 11 h off. We needed enough relaxation time to measure OCVs at about 2.8 V because of slow recuperation of voltage in this region as was seen in Fig. 9.
Figure 12 shows the observed OCVs as a function of charge capacity in mAh/g. To measure OCVs, a system was calibrated using the Weston standard cell, so that the error in absolute value in voltage is negligible. As clearly seen in Fig. 12, two voltage plateaus at 4.718 and 4.739 V are observed at higher voltage than 4 V. The difference in voltages between two plateaus is only 20 mV. This may be a reason why we cannot distinguish each other if we used ill-defined  samples, and this may be a characteristic feature of
 having a superlattice structure.
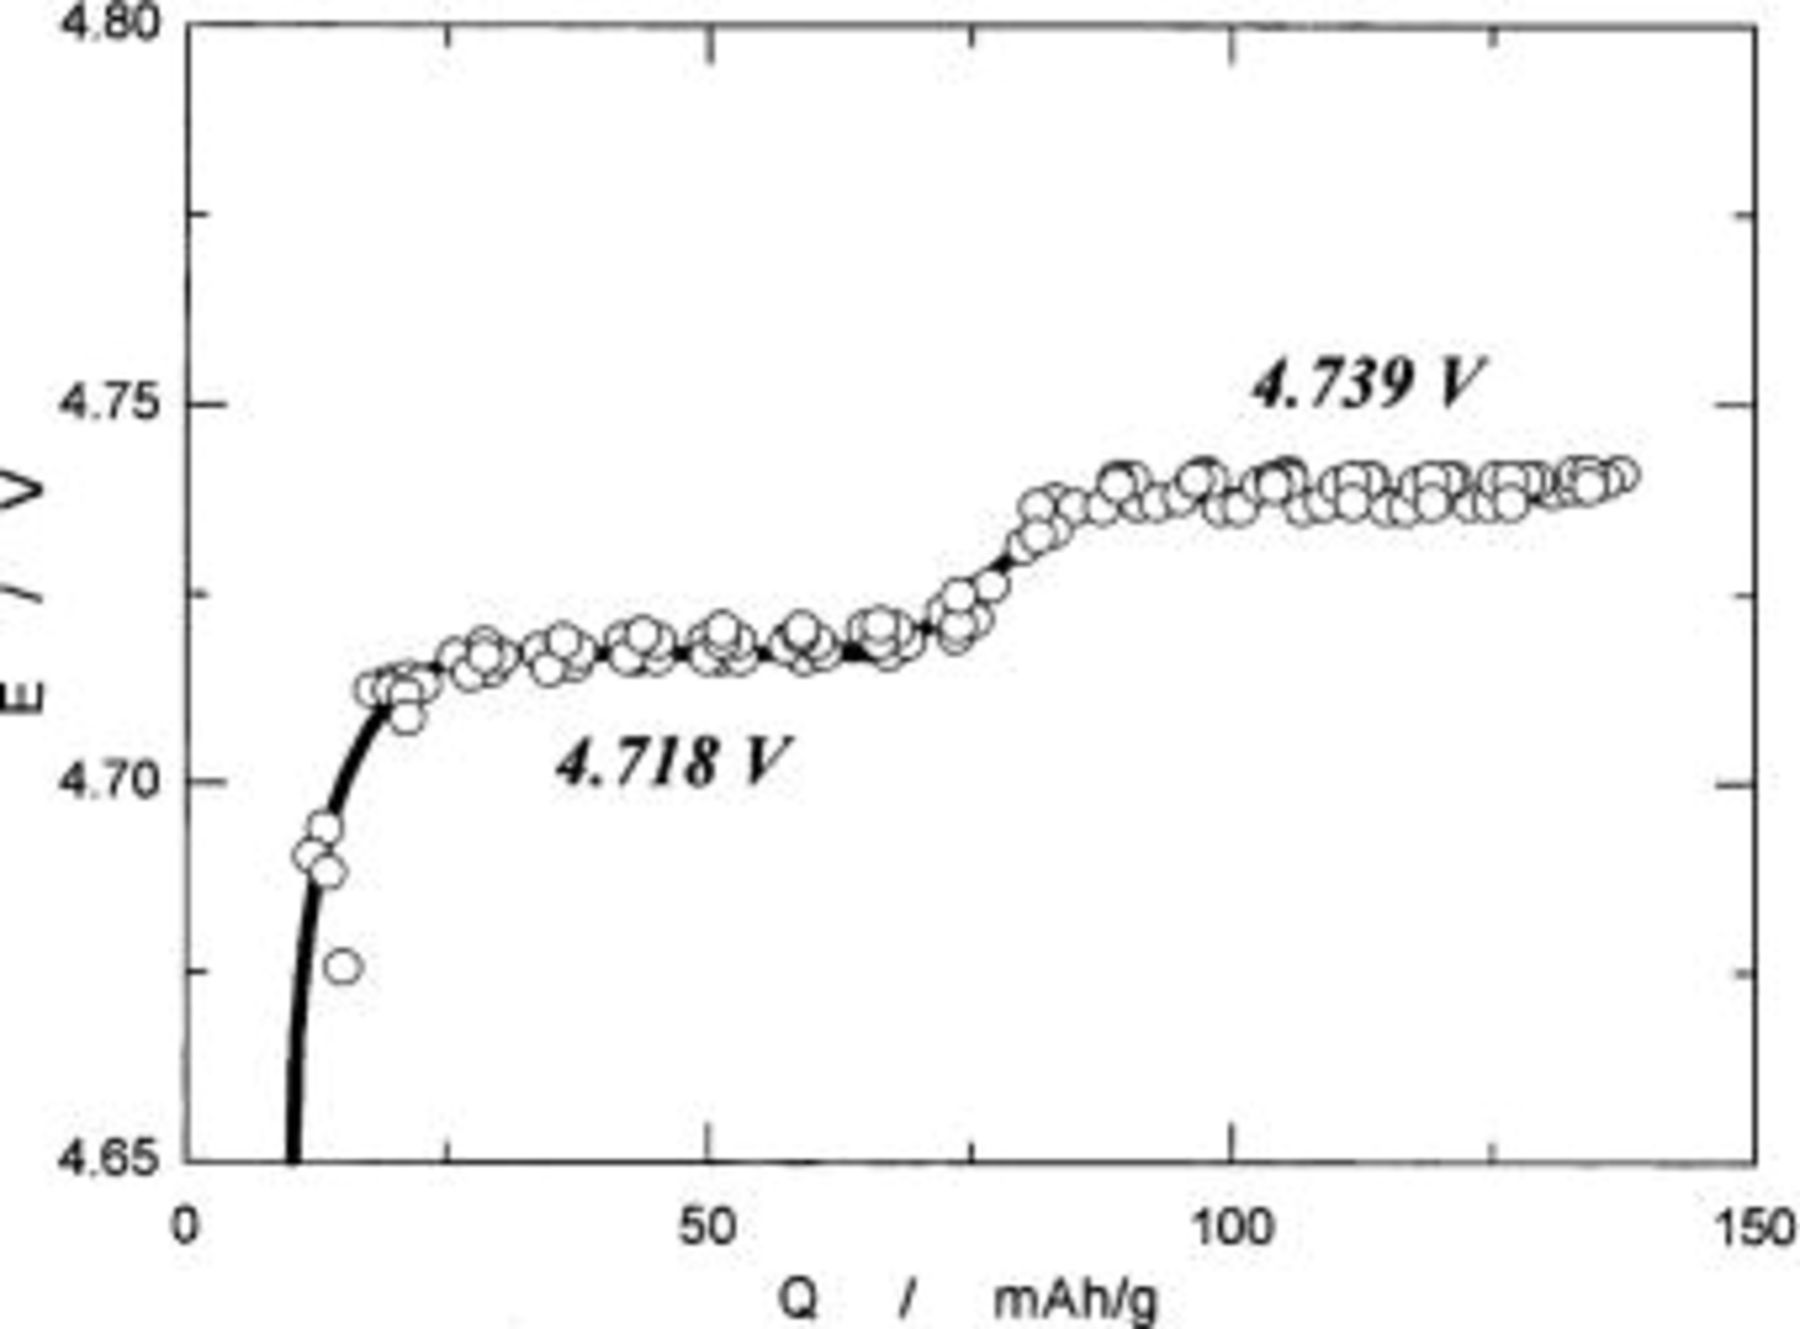
Figure 12. The OCVs as a function of charge capacity in mAh/g based on  weight.
Figure 13 summarizes the reversible potentials as a function of x in  Data taken independently from four cells are shown in the same figure. We assessed the reversibility of the reaction, and we confirmed that observed OCVs were situated somewhere between charging and discharging voltages. Observed OCVs are called reversible potentials.19
20
21
22 The values of x in
Data taken independently from four cells are shown in the same figure. We assessed the reversibility of the reaction, and we confirmed that observed OCVs were situated somewhere between charging and discharging voltages. Observed OCVs are called reversible potentials.19
20
21
22 The values of x in  are calculated from charge or discharge capacity in mAh/g and theoretical capacity of 148 mAh/g based on
  assuming 100% of coulombic efficiency for the reaction under consideration. As clearly seen in Fig. 13, the reaction is classified into four regions in terms of the reversible potentials, i.e.,
  to 1/2 in
  characterized by the voltage of 4.739 V,
  to 1 by 4.718 V,
  to 2 by 2.795 V, and
  by 1.9 to 1.4 V. Of these, the reversible potentials in region (IV) depend on x in
  suggest a one-phase reaction while the x value exceeds the value of 2 as will be discussed in the next section.
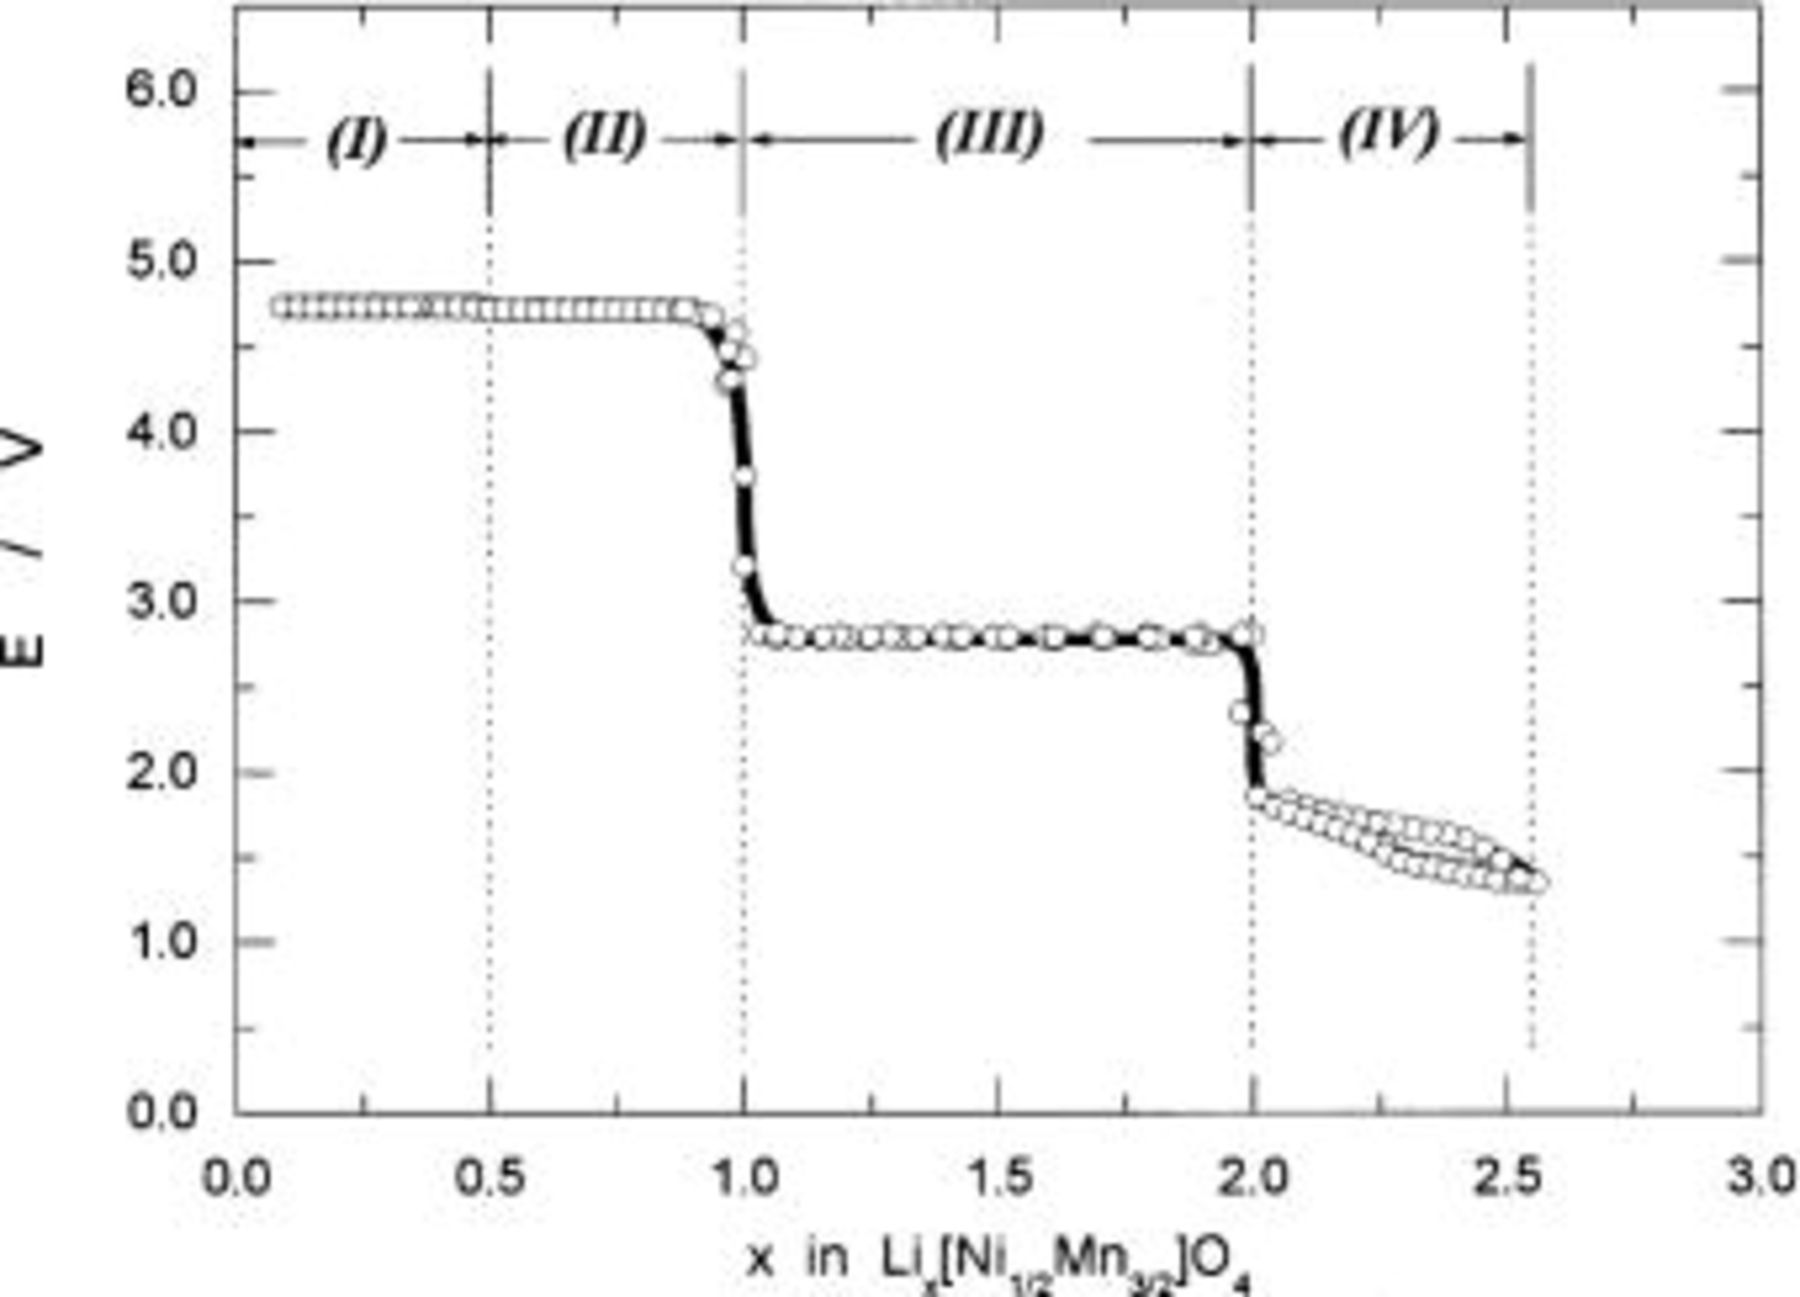
Figure 13. The reversible potential vs. the composition x plots for the  electrodes.
Reaction mechanism on the solid-state redox reaction of .—

Figure 14 summarizes how the structural parameters are changed during the reaction of  Observations on the cubic phases and a tetragonal phase remind us the case for
  23 so that the lattice parameter of cubic lattice was converted into tetragonal lattice using the equations of
  and
and  to illustrate the figure. As seen in Fig. 14, the reaction is classified into four regions denoted (I) to (IV) in terms of the change in lattice parameter, which agrees strictly with those determined in term of the reversible potentials in Fig. 13. From these structural and electrochemical results, we discuss on the reaction mechanism of
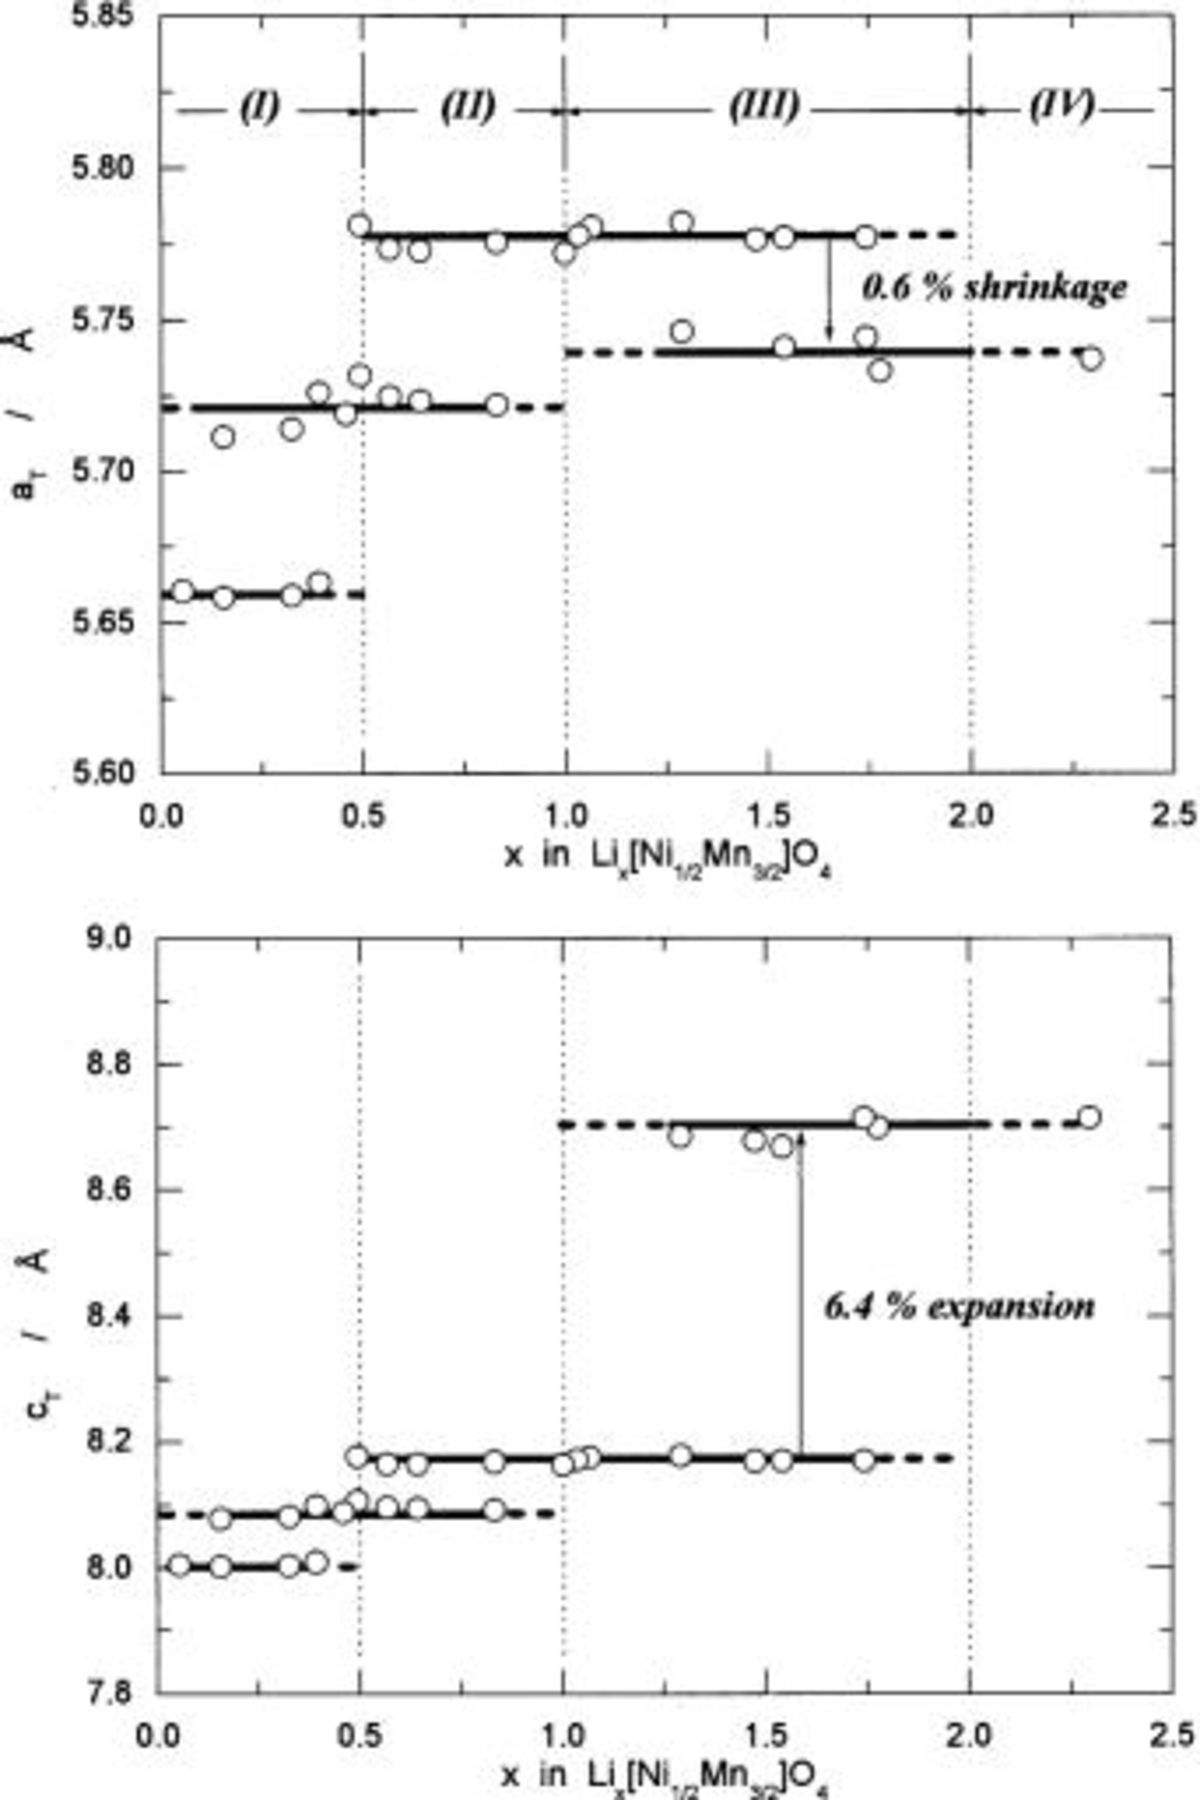
Figure 14. Change in the structural parameters as a function of x in  The structural parameters,
  and
and  are given for a tetragonal lattice. A parameter,
  for cubic lattice in region (I) and (II) was converted to the parameters for a tetragonal lattice using
  and
and 
The reaction in region (I) consists of two cubic phases having  and 8.09 Å, characterized by the reversible potential of 4.739 V. The change in lattice parameter is 1.1% based on
 for the reaction of
  to
to  Consequently, the change in lattice volume is calculated to be 3.3% using the value of 512 to 529 Å3. In this region, the reaction proceeds topotactically in two cubic phases, called a topotactic cubic/cubic two-phase reaction.
The reaction in region (II) also consists of two cubic phases having  and 8.17 Å, characterized by the reversible potential of 4.718 V. The change in lattice parameter is 1.0% based on
 for the reaction of
  to
to  Accordingly, the change in lattice volume is 3.0% calculated from 529 to 545 Å3. The reaction in this region is a topotactic cubic/cubic two-phase reaction.
The reaction in region (III) consists of cubic and tetragonal phases, characterized by the reversible potential of 2.795 V. Conversion from cubic to tetragonal phases takes place topotactically in a solid matrix.23 As is seen in Fig. 14, the lattice parameter of  shrinks from 5.78 to 5.74 Å, while that of
  expands from 8.17 to 8.69 Å for the reaction of
  to
to  Lattice volumes are calculated to be 273 Å3 for
  and 286 Å3 for
  The change in lattice parameter is quite small in
  axis (as small as 0.6%). Conversely, the change is large in
  axis (as large as 6.4%). Consequently, the change in volume is calculated to be reasonable value of 5.0% for a series of lithium insertion electrodes reported so far.24
The reaction in region (IV) consists of a tetragonal phase, characterized by a sloping reversible potential curve in 1.4-1.9 V. According to our classification on capacity limit for lithium insertion materials,24 the composition for the site-limited capacity is  because no vacant octahedral site to accommodate lithium ions is available. However, electron sinks, to be able to accept electrons, are available in
  until the composition reaches
  (so-called the electron source or sink limited capacity).11
24 The reaction is formally represented by the expression
(so-called the electron source or sink limited capacity).11
24 The reaction is formally represented by the expression 
The additional capacity from the site-limited capacity to the electron-sink-limited capacity is calculated to be 74 mAh/g based on  weight. In this region, the reaction proceeds topotactically in a tetragonal phase, which is one of the one-phase reactions. Although we cannot specify the location of lithium ions in a solid matrix, lithium ions are supposedly located at the tetrahedral sites.
Differences and similarities between lithium insertion electrodes of and .—


As were described in the previous section, the reaction mechanism of  is quite similar to that of
 with respect to the change in lattice parameters as was shown in Fig. 14. Table II summarizes differences and similarities between
  and
and  Both samples clearly show regions (I), (II), and (III) when we classify the reactions in terms of lattice parameters and reversible potentials. Cubic phases with
  can be seen above 4 V against a lithium electrode in regions (I) and (II). A difference is a cubic/cubic two-phase reaction for
  vs. a cubic one-phase reaction for
  in region (II). Tetragonal phase is observed for both samples in region (III), i.e.,
 and
and 
 Although the degree of distortion in
 is smaller than that in
 the essential feature of the reaction in region (III) is the same. As far as region (IV) in Fig. 13 and 14 is concerned,
 25 shows almost the same behavior as that of
  while stoichiometric
  cannot be observed because the site-limited capacity is the same as electron-sink-limited capacity.11
23
24
cannot be observed because the site-limited capacity is the same as electron-sink-limited capacity.11
23
24
Table II.
Differences and similarities between the solid state electrochemistry of   and and   | ||||||||||
|---|---|---|---|---|---|---|---|---|---|---|
x in  | 0 | Region (I)
 | 1/2 | Region (II)
 | 1 | Region (III)
 | 2 | Average potential | ||
| Above 4 V | Overall | |||||||||
 | a/Å |
 |
 |
 |

 | |||||
| E/V | 4.739cubic/cubictwo-phase | 4.718cubic/cubictwo-phase | 2.795cubic/tetragonaltwo-phase | 4.729(456 kJ/mol) | 3.762(726 kJ/mol) | |||||
 | a/Å |
 |
 |
 |

 | |||||
| E/V | 4.110cubic/cubictwo-phase | 3.94cubicsingle-phase | 2.957cubic/tetragonaltwo-phase | 4.025(388 kJ/mol) | 3.491(673 kJ/mol) | |||||
A remarkable difference is the level of reversible potentials between two samples. When we compare potential difference between regions (I) and (II) for each sample, the gap for  is only 20 mV while that for
  is about 170 mV. Average voltages above 4 V is 4.729 V for
  vs. 4.025 V for
  About 0.7 V higher voltage is seen in region (I) and (II). Conversely, reversible potential of
  in region (III) is 0.2 V lower than that of
  i.e., 2.795 V for
  vs. 2.957 V for
  Consequently, the electrode potential for an overall reaction of
  is only 0.27 V higher than that of
  i.e., 3.762 V for
  vs. 3.491 V for
As were described in this paper,  can store and deliver electricity of 135 mAh/g out of 148 mAh/g of theoretical capacity at 4.7 V against a lithium electrode and it can be used as a positive electrode for advanced lithium-ion batteries. For rechargeable lithium batteries with lithium metal electrodes,
  can potentially store and deliver electricity more than theoretical capacity of 296 mAh/g based on
  weight when the
  cells are operated in voltages of 1.2-4.9 V. According to our results, the reaction of
  to
to  via
via  consist of three topotactic two-phase reactions.
In this paper we did not state oxidation states or valence states of nickel, manganese, and oxygen species to describe the reactions except an equation to explain region (IV), and also we did not say that a space group for the tetragonal phase of  is
is  by an analogy of
  because we are not sure unless we confirm the crystal structure of
  Such theoretical and experimental approaches by X-ray absorption spectroscopy, electron energy loss spectroscopy, and XRD combined with the computational methods are still under way in our laboratory.
Acknowledgments
The authors wish to thank Satoshi Yamamoto, a former graduate student currently attending Sanyo Soft Energy Company, Japan, for his help on some of data collection. One of us (T.O.) wishes to thank Hiroyuki Ito of Tanaka Chemical Corp. Ltd., Japan for his efforts on the preparation of nickel manganese double hydroxide. The electron diffraction study was performed using facilities of the institute for Solid State Physics, the University of Tokyo. The present work was partially supported by a grant-in-aid from the Osaka City University (OCU) Science Foundation.
Osaka City University assisted in meeting the publication costs of this article.