
Abstract
In situ electrochemical impedance spectroscopy was used to study the characteristics of the passive film formed potentiodynamically on copper, in slightly alkaline solution. This film has semiconducting properties. A strong correlation was established between the impedance and the changes in the composition and structure of the passive film. Several parameters were examined, such as: the ionic resistivity,  of
of  the dielectric constant,
  of
of  and the concentration of charge carriers of
  © 2001 The Electrochemical Society. All rights reserved.
Export citation and abstract BibTeX RIS
In spite of the fact that copper is a relatively noble metal, it reacts easily in ordinary oxygen-containing electrolytes.1 However, wide industrial application of copper has been based on its corrosion stability, which is a result of formation of an oxide/hydroxide layer on the metal surface. Thin passivating layers formed on copper in neutral and alkaline solutions have attracted considerable interest in many fields, particularly corrosion, electrocatalysis, and double-layer structure research.2 Over the past several decades, the corrosion behavior of copper in acidic, neutral, and alkaline solutions has been extensively explored, mostly using electrochemical and surface analytical methods.2
3
4
5
6
7
8
9
10
11
12
13
14
15
16
17
18
19
20
21
22
23
24
25 However, there still exist contradictory views about partial reactions taking place at the copper/electrolyte interface and the ways that the rate depends on the electrode potential, pH, thickness, and structure of the surface film. Some authors proposed a dissolution/precipitation mechanism for both  and CuO,3
4
5 or nucleation growth for CuO.6 In neutral and weakly alkaline solutions, Strehblow and co-workers7
8
9 proposed direct growth mechanisms for the entire Cu(I)/Cu(II) system, while a competition between dissolution and preferential nucleation was observed on Cu(111) surfaces at pH 9.3.10
and CuO,3
4
5 or nucleation growth for CuO.6 In neutral and weakly alkaline solutions, Strehblow and co-workers7
8
9 proposed direct growth mechanisms for the entire Cu(I)/Cu(II) system, while a competition between dissolution and preferential nucleation was observed on Cu(111) surfaces at pH 9.3.10
It was found that the corrosion rate of copper is influenced by pH and has the lowest value in slightly alkaline solutions. In combination with electrochemical polarization, ellipsometric, and X-ray photoelectron spectroscopy (XPS), Brusic et al.11 showed that the stable oxides of copper could be formed reversibly in the pH range 8-12. At pH values below 7, the dissolution of copper becomes significant, especially below pH 5, where the formation of stable surface oxides is not possible. On the basis of electrochemical polarization, XPS and ion scattering spectroscopy, Strehblow and co-workers7
8
9
10 have found that copper forms a  oxide film at potentials
  [vs. standard hydrogen electrode (SHE)] and a
  duplex film at the potentials
  to 0.059 pH (vs. SHE) in weakly acidic and alkaline solutions. The thickness of these anodic films does not exceed 6 nm, except in strongly alkaline solutions where thicker films were observed due to precipitation that occurs at the second anodic peak. Sato et al.12 have found that the outer part of the duplex film is partially dehydrated and that dehydration proceeds with increasing anodic potential and oxidation time. In a study of photoelectrochemical properties of corrosion products on copper, Di Quatro et al.13 have found that the growth of copper(I) oxide takes place at pH values above 4. Metikos-Hukovic et al.14
15
16 have found that copper dissolution is controlled by transport in the oxide film in the pH range from 6 to 10, and determined the diffusion coefficient and concentration of copper species.
to 0.059 pH (vs. SHE) in weakly acidic and alkaline solutions. The thickness of these anodic films does not exceed 6 nm, except in strongly alkaline solutions where thicker films were observed due to precipitation that occurs at the second anodic peak. Sato et al.12 have found that the outer part of the duplex film is partially dehydrated and that dehydration proceeds with increasing anodic potential and oxidation time. In a study of photoelectrochemical properties of corrosion products on copper, Di Quatro et al.13 have found that the growth of copper(I) oxide takes place at pH values above 4. Metikos-Hukovic et al.14
15
16 have found that copper dissolution is controlled by transport in the oxide film in the pH range from 6 to 10, and determined the diffusion coefficient and concentration of copper species.
When considering the papers devoted to copper passivation, electrochemical impedance spectroscopy (EIS) technique has been rarely used for investigating copper oxides formation and properties. EIS has achieved considerable importance as in situ technique for studying electric and dielectric properties of anodically formed passive films. However, metal surfaces are largely heterogeneous due to surface roughness or interfacial phenomena.26 This heterogeneity causes anomalous frequency dispersion of interfacial properties such as impedance or capacitance. In such cases, a constant phase element has been used for the system. Juttner27 discussed the usefulness of the constant phase element for corrosion processes on inhomogeneous surfaces.
Earlier studies of copper passivation have been performed using conventional capacitance measurements,5 7 18 at one or a few discrete frequencies. A more valuable and powerful technique is impedance spectroscopy performed over a wide range of frequencies. It has been used by Feng et al.17 in determining the corrosion mechanisms of copper as a function of solution pH. Recently, we have shown14 15 16 23 24 25 that this technique, together with cyclic voltammetry, provides valuable information about the inhibition provided by the passive film formed on copper in weakly acidic, neutral, and weakly alkaline solutions.
The aim of the present work was to investigate the formation and properties of copper oxides in a borate buffer solution, pH 8.4, using cyclic voltammetry and impedance spectroscopy.
Experimental
The working electrodes were prepared from pure Cu (99.999 wt %). Samples 15 mm in diam and 2 mm thick, were abraded with fine emery papers and polished with alumina powder down to 0.05 μm, and finally rinsed with distilled water and acetone. Prepared samples were embedded in a Teflon holder, so that an area of 1.00 cm2 was exposed to the solution. A carbon rod and a saturated calomel electrode (SCE) served as the counter and reference electrodes, respectively. All potentials refer to the SCE scale. Measurements were performed in a borate buffer solution: a mixture of one volume fraction of  to four volume fractions of
  pH 8.4. Prior to each measurement, the electrodes were subjected to cathodic pretreatment by holding them potentiostatically at −1.4 V for 45 s. For impedance measurements, the samples were potentiodynamically polarized from the initial potential to the desired potential value with a sweep rate of 10 mV s−1. After a 10 min wait period, impedance data were collected. The potential was then progressively stepped in the positive direction to the desired value and the impedance measurements were repeated. All measurements were performed with the ac voltage amplitude ±5 mV in the frequency range from 30 mHz to 100 kHz. Voltammetry and impedance measurements were carried out using a PAR EG&G potentiostat (model 273) and a PAR EG&G lock-in amplifier (model 5301A) with a Pentium PC.
Results and Discussion
Cyclic voltammetry of the Cu/borate buffer system, pH 8.4
Cyclic voltammograms (CVs) provide a very instructive overview of the electrode processes. CVs obtained by different workers are not identical, mainly due to surface contamination as well as differing methods of surface preparation.18 In this work, reproducible results were obtained for freshly polished electrodes, which were polarized for 45 s at −1.4 V.
Figure 1 represents the CV obtained for the copper electrode in a borate buffer solution, pH 8.4, at a sweep rate of 3 mV s−1. Three anodic and two cathodic current peaks can be observed in the CV. According to Pourbaix,1 the following oxidation equilibria are possible in the copper/aqueous solution system at pH 8.4


Accordingly, the current peak  has been assigned to the electroformation of a
  layer (Eq. 1), whereas the current peaks
  and
and  are associated with the anodic formation of a complex hydrous CuO film (Eq. 2
3
4
5), resulting in a duplex structure of the passive film.4
5
6
7
8
9
12
17
18
19
20
21
22
23
24
25 Apparently, such a structure represented by an outer
are associated with the anodic formation of a complex hydrous CuO film (Eq. 2
3
4
5), resulting in a duplex structure of the passive film.4
5
6
7
8
9
12
17
18
19
20
21
22
23
24
25 Apparently, such a structure represented by an outer  layer overlaying a barrier
  is responsible for a decrease in anodic dissolution, i.e., a decrease in anodic current up to approximately 0.9 V, where oxygen evolution commences. The electroreduction scan shows the current peaks
  and
and  which are related to the electroreduction of CuO and/or
  to
to  and
and  to Cu, respectively.
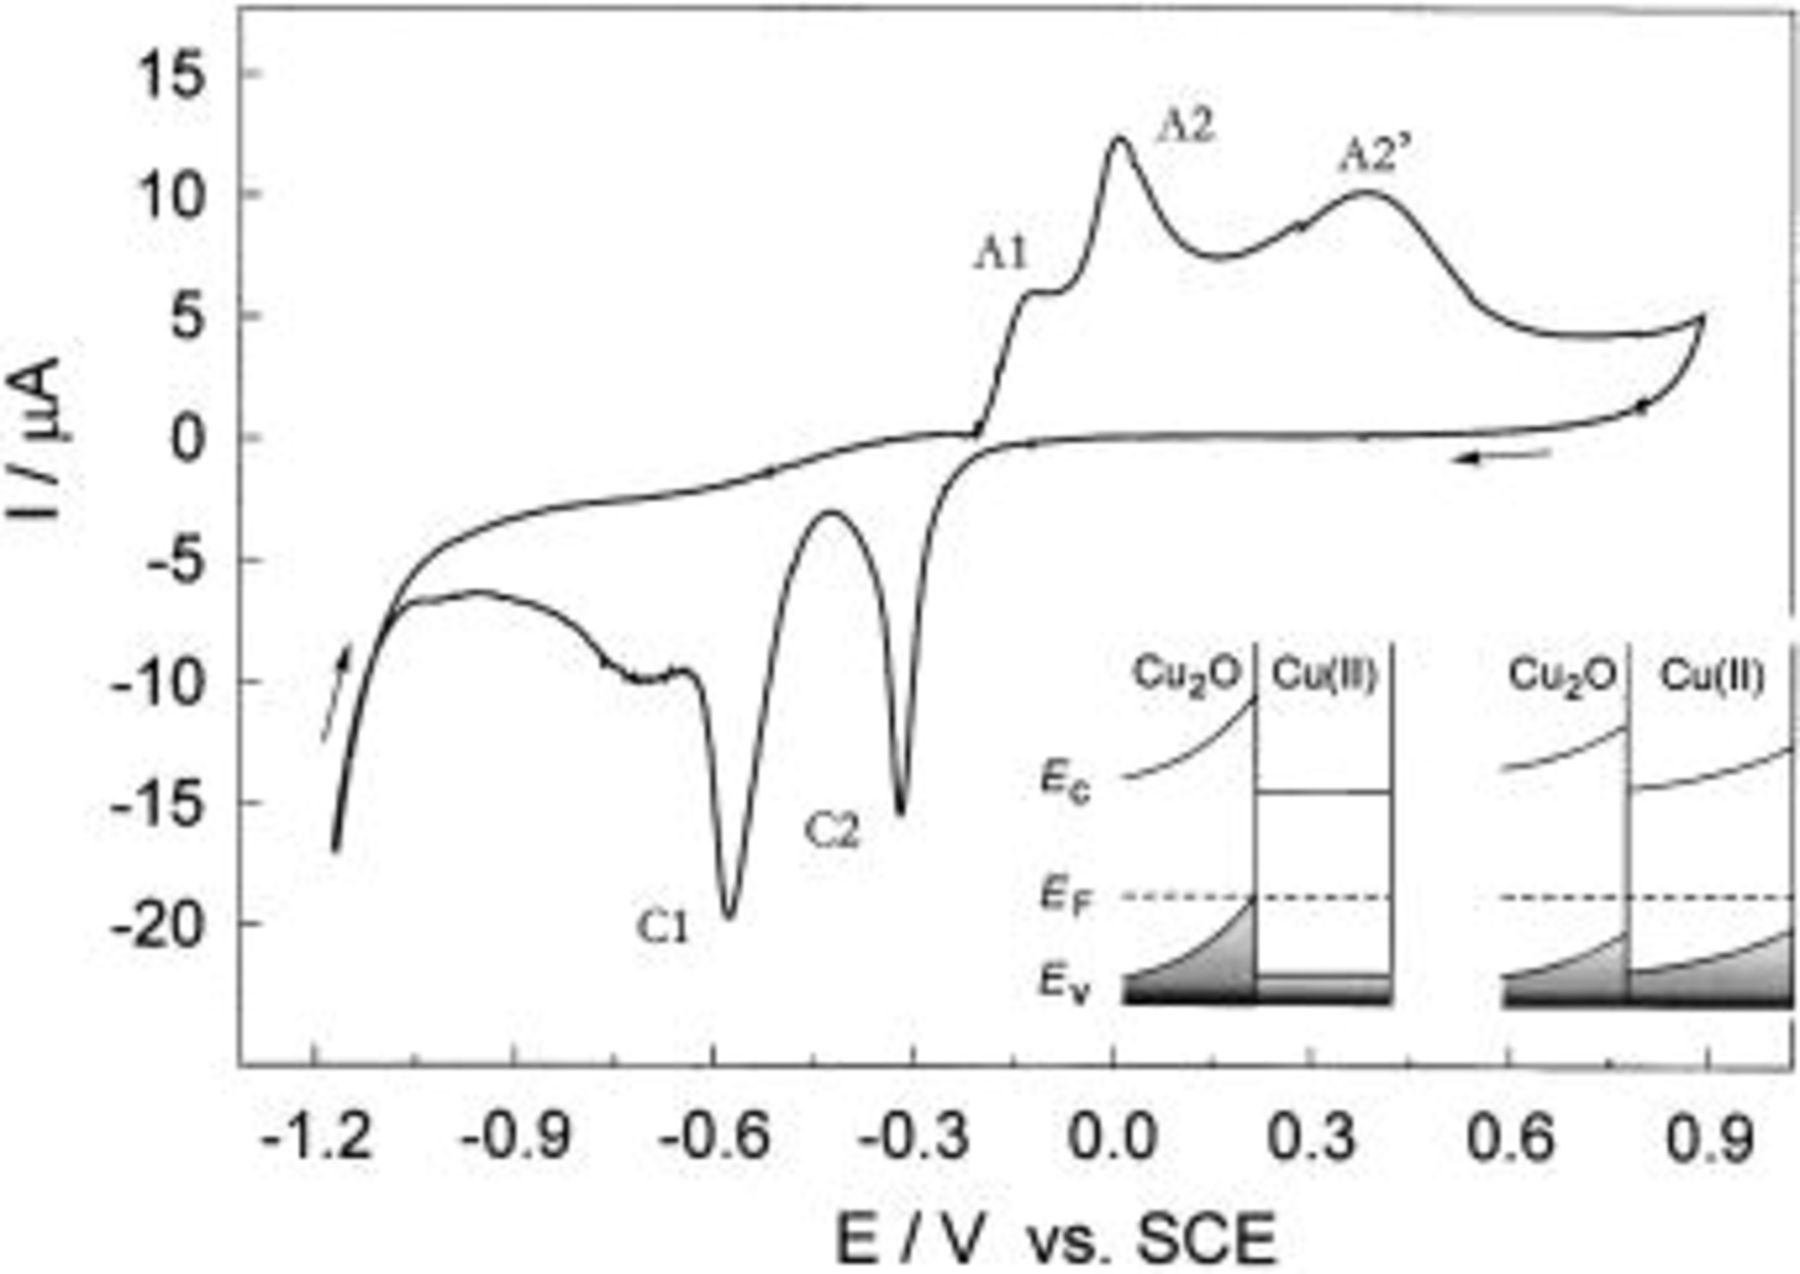
Figure 1. CV for Cu in borate buffer solution, pH 8.4,  The inset: Band structure model for thin oxide films on copper in the potential range of duplex film formation.
CVs obtained when the potential sweep was reversed at various positive potential limits showed that no cathodic peak was observed unless the potential had reached a value more positive than the current peak  Only the cathodic peak
  appeared when the potential was set between the current peaks
  and
and  during the anodic part of the potentiodynamic curve. Both peaks
  and
and  were observed when the electrode was polarized to more positive potentials than the maximum potential of peak
  At a sweep rate of 10 mV s−1, the cathodic current peak
  appeared when the electrode was polarized above −0.065 V, but a more significant increase of
  occurred when the electrode was polarized above 0.17 V. However, a potential sweep reversal above
  had a pronounced influence on the structure of the cathodic polarization curve (Fig. 2). First, the height of the cathodic current peaks increased with a shift in the sweep reversal toward more positive values, suggesting that electroformation of both copper oxides,
  and CuO, occurred during anodic polarization up to the sweep reversal. Second, an increase in the anodic potential sweep reversal significantly shifted the potential of
  toward negative potential values. The same changes in the cathodic polarization curve were observed when the electrode was stabilized for a longer period of time (a few minutes) at anodic potentials more positive than the current peak,
  All of these observations are supposed to be a consequence of the oxide layer composition. According to Seo et al. ,12 the average composition of the outer oxide layer could conventionally be represented as
  The value of x is variable in the range of
  corresponding to the composition range of
  to CuO. It was found12 that the value of x increases with increasing anodic potential and oxidation time. When we apply these considerations to the system under investigation, it follows that the outer part of the Cu(II) oxide layer formed during increased anodic polarization and longer oxidation time is less hydrated and its reduction potential is more negative than the reduction potential of the more hydrated Cu(II) oxide layer, the formation of which is favored at shorter oxidation times. The observed reduction potentials of the more and less hydrated Cu(II) oxides are in accordance with the corresponding reversible potentials (Eq. 4
5).
to CuO. It was found12 that the value of x increases with increasing anodic potential and oxidation time. When we apply these considerations to the system under investigation, it follows that the outer part of the Cu(II) oxide layer formed during increased anodic polarization and longer oxidation time is less hydrated and its reduction potential is more negative than the reduction potential of the more hydrated Cu(II) oxide layer, the formation of which is favored at shorter oxidation times. The observed reduction potentials of the more and less hydrated Cu(II) oxides are in accordance with the corresponding reversible potentials (Eq. 4
5).
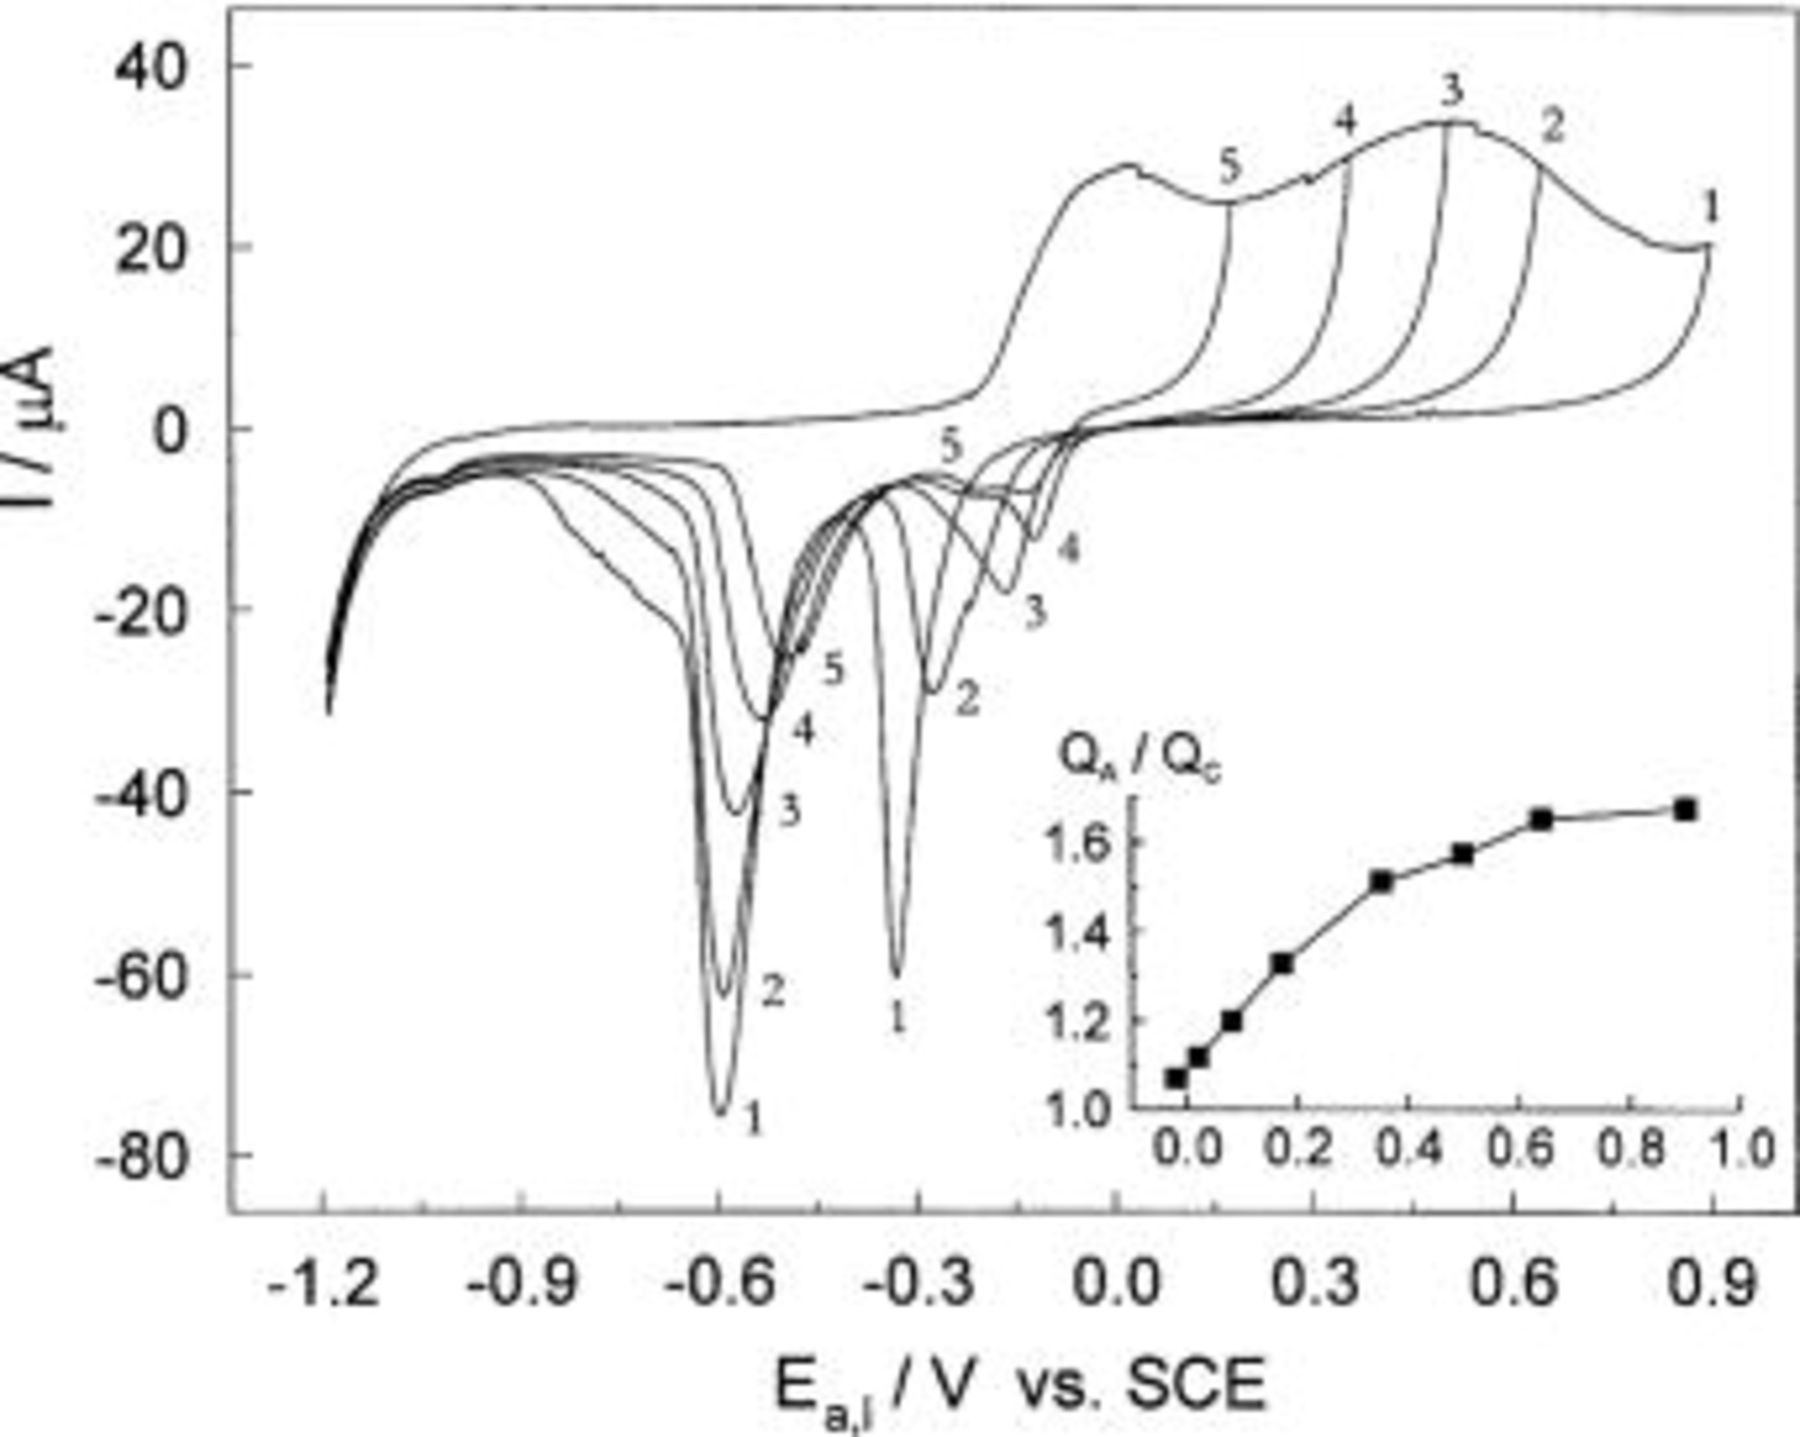
Figure 2. CVs for Cu in borate buffer solution, pH 8.4 obtained at various potential sweep reversals,  The inset: The ratio between anodic and cathodic charge densities vs. the potential sweep limit.
The total charges of the anodic,  and cathodic,
  processes are determined by integration of the anodic and cathodic current peaks. They are analyzed as dependent on the positive potential sweep limit and the sweep rate. It must be pointed out that the charges
  and
and  are almost equal in the potential range of
  electroformation and its reduction. Once the Cu(II) generation starts, the charges associated with the anodic processes become larger than those for cathodic processes (the inset in Fig. 2) and the observed difference increases with increasing positive potential limit. For example, at a sweep rate of 10 mV s−1, the ratio
  changes almost linearly from 1.0 at −0.15 V to 1.8 at 0.7 V. Much greater values for the charge ratio are found for copper in slightly acidic solution24 due to increased solubility of copper(II) oxide. In spite of the fact that solubility of copper(II) oxide is quite low in slightly alkaline solution (due to electrode reactions) (Eq. 1
2
3
4
5), the pH at the electrode/electrolyte boundary decreases and may cause increased solubility of copper(II) oxides. Therefore, it has to be concluded that a part of the oxidized Cu(II) dissolves as the corrosion product. The alternative possibility that could explain the difference between
changes almost linearly from 1.0 at −0.15 V to 1.8 at 0.7 V. Much greater values for the charge ratio are found for copper in slightly acidic solution24 due to increased solubility of copper(II) oxide. In spite of the fact that solubility of copper(II) oxide is quite low in slightly alkaline solution (due to electrode reactions) (Eq. 1
2
3
4
5), the pH at the electrode/electrolyte boundary decreases and may cause increased solubility of copper(II) oxides. Therefore, it has to be concluded that a part of the oxidized Cu(II) dissolves as the corrosion product. The alternative possibility that could explain the difference between  and
and  is the accumulation of unreduced Cu(II) oxide or hydroxide at the surface. However, this assumption is not acceptable, because successive potentiodynamic examination with the same specimen, and under the same conditions, resulted in almost identical polarization curves. This would not be observed if some of the corrosion products remained at the surface. It is also observed that the ratio
  increases with increasing sweep rate. At a low sweep rate (3 mV s−1)
  is slightly larger than
  but at the sweep rates between 10 and 100 mV s−1, their ratio lies between 1.3 and 1.5. It seems that almost all dissolved copper species can be reduced during a slow potential sweep.
The total cathodic charge  obtained by integration of
  and
and  can be correlated with the thickness of the total oxide layer d, which is equal to the sum of the inner
 and outer
 parts of the duplex film, where
  is the charge corresponding to
  represents the difference of the charges corresponding to
  and
and  is the molar volume of CuO and /or
  is the molar volume of
 is the roughness factor, and F is the Faraday constant. In both equations, the reduction efficiency was assumed to be 1 and the molar volumes of
  CuO, and
  were 23.9, 12.4, and 29.0 cm3 mol−1, respectively. When the potential sweep reversal was complete at −0.065 V (the potential up to which the formation of copper(II) oxide was not observed), the amount of charge under
  was 0.358 mC cm−2. This amount of charge very closely corresponds to a monolayer of the
  film whose thickness is equal to 0.44 nm. In fact, the charge required to form a unit cell monolayer oriented in the basal plane is 0.353 mC cm−2, calculated from the unit cell dimensions.
  crystallizes in a cubic structure built up from a body centered cubic lattice of oxide ions and a face centered cubic lattice of copper(I) ions.18 For several potential sweep reversals up to 0.9 V, the charges were determined and the corresponding film thickness' calculated and presented in Fig. 3. For example, at the anodic potential sweep reversal of 0.9 V, the charges
  and
and  amount to 1.34 and 1.87 mC cm−2, respectively. The corresponding thicknesses of oxide layers, under the assumption that their outer parts are composed of
  are:
are: 
 and the total thickness
  Figure 3 shows that the thickness of both parts of the oxide layer increases with increasing anodic polarization.
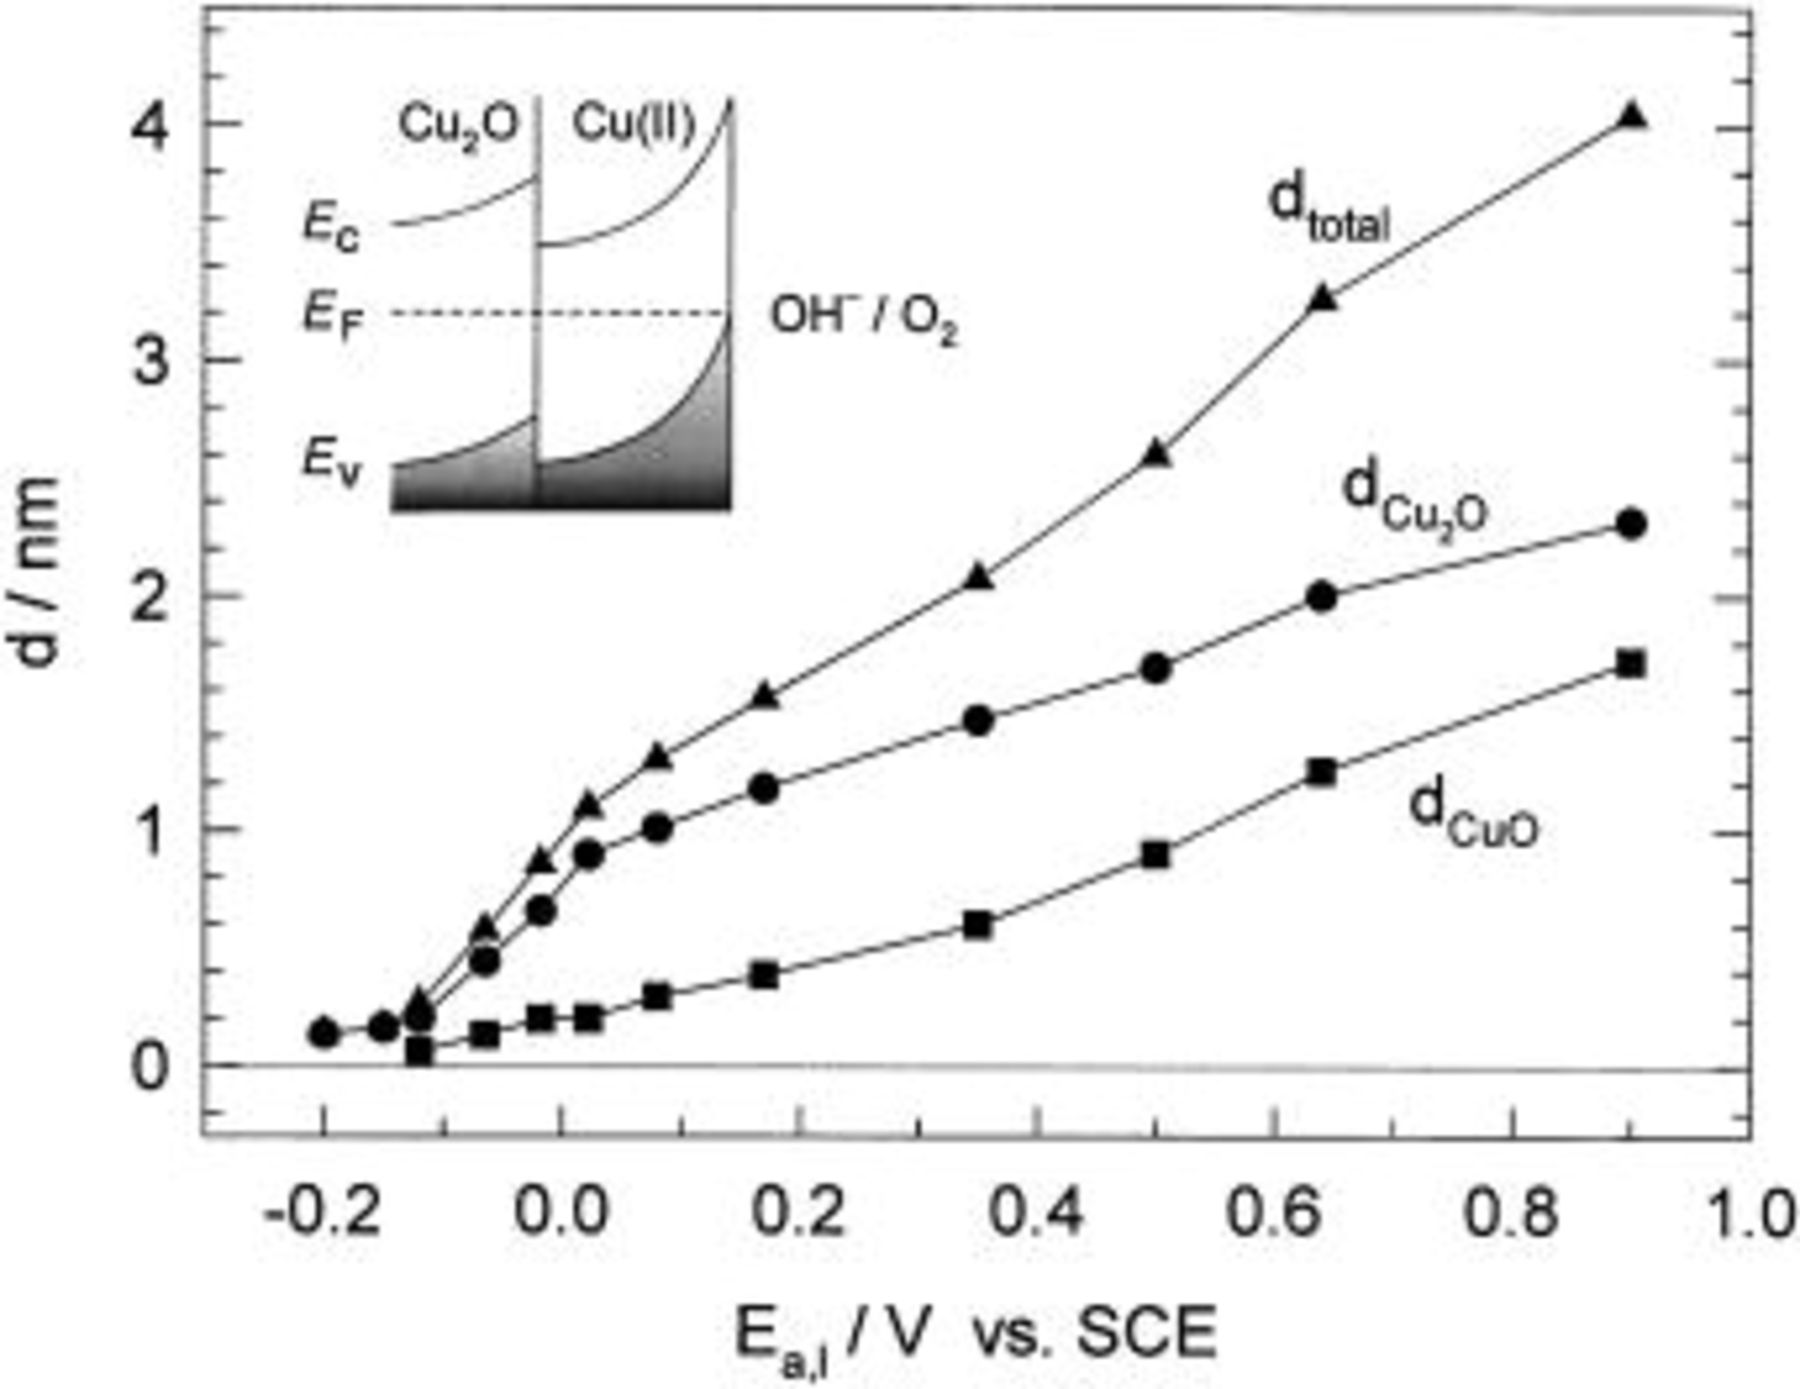
Figure 3. Thickness of 
 and the total thickness of the oxide layer vs. the anodic potential. The inset: Band structure model for thin oxide films on copper in the transpassive potential range
Voltammograms represented in Fig. 4 show the influence of the sweep rate on the shape of CVs. As the sweep rate increases, the following observations can be made: (i) the height of all current peaks increases; (ii) the anodic peak potentials shift toward more positive potentials, (iii) at the sweep rates above 10 mV s−1, the first and the second anodic current peaks overlap; (iv) the cathodic peak potential  shifts toward more negative potentials, while
  shifts in the opposite direction. The opposite shift of the
  potential values with increasing sweep rates is probably caused by a partial disproportionation of
  during its reduction. Voltammograms were used to analyze the dependence of peak potentials and peak currents on the sweep rate. A linear relationship was observed between the peak potentials

 and the square root of the sweep rate. Extrapolation of these straight lines to zero scan rate gives a spontaneous oxidation/reduction potential, i.e., anodic (cathodic) nucleation potential
  The absence of the polarization effect makes these the most suitable values for comparison with thermodynamic data. The difference between these experimental values and the equilibrium potentials from Eq. 1
2
3
4
5 gives the anodic and cathodic overpotentials. It was found that the anodic overpotential of Cu to
The absence of the polarization effect makes these the most suitable values for comparison with thermodynamic data. The difference between these experimental values and the equilibrium potentials from Eq. 1
2
3
4
5 gives the anodic and cathodic overpotentials. It was found that the anodic overpotential of Cu to  oxidation is 0.232 V, while the cathodic overpotentials of
  to
to  and
and  to Cu reduction are 0.318 and 0.285 V, respectively.
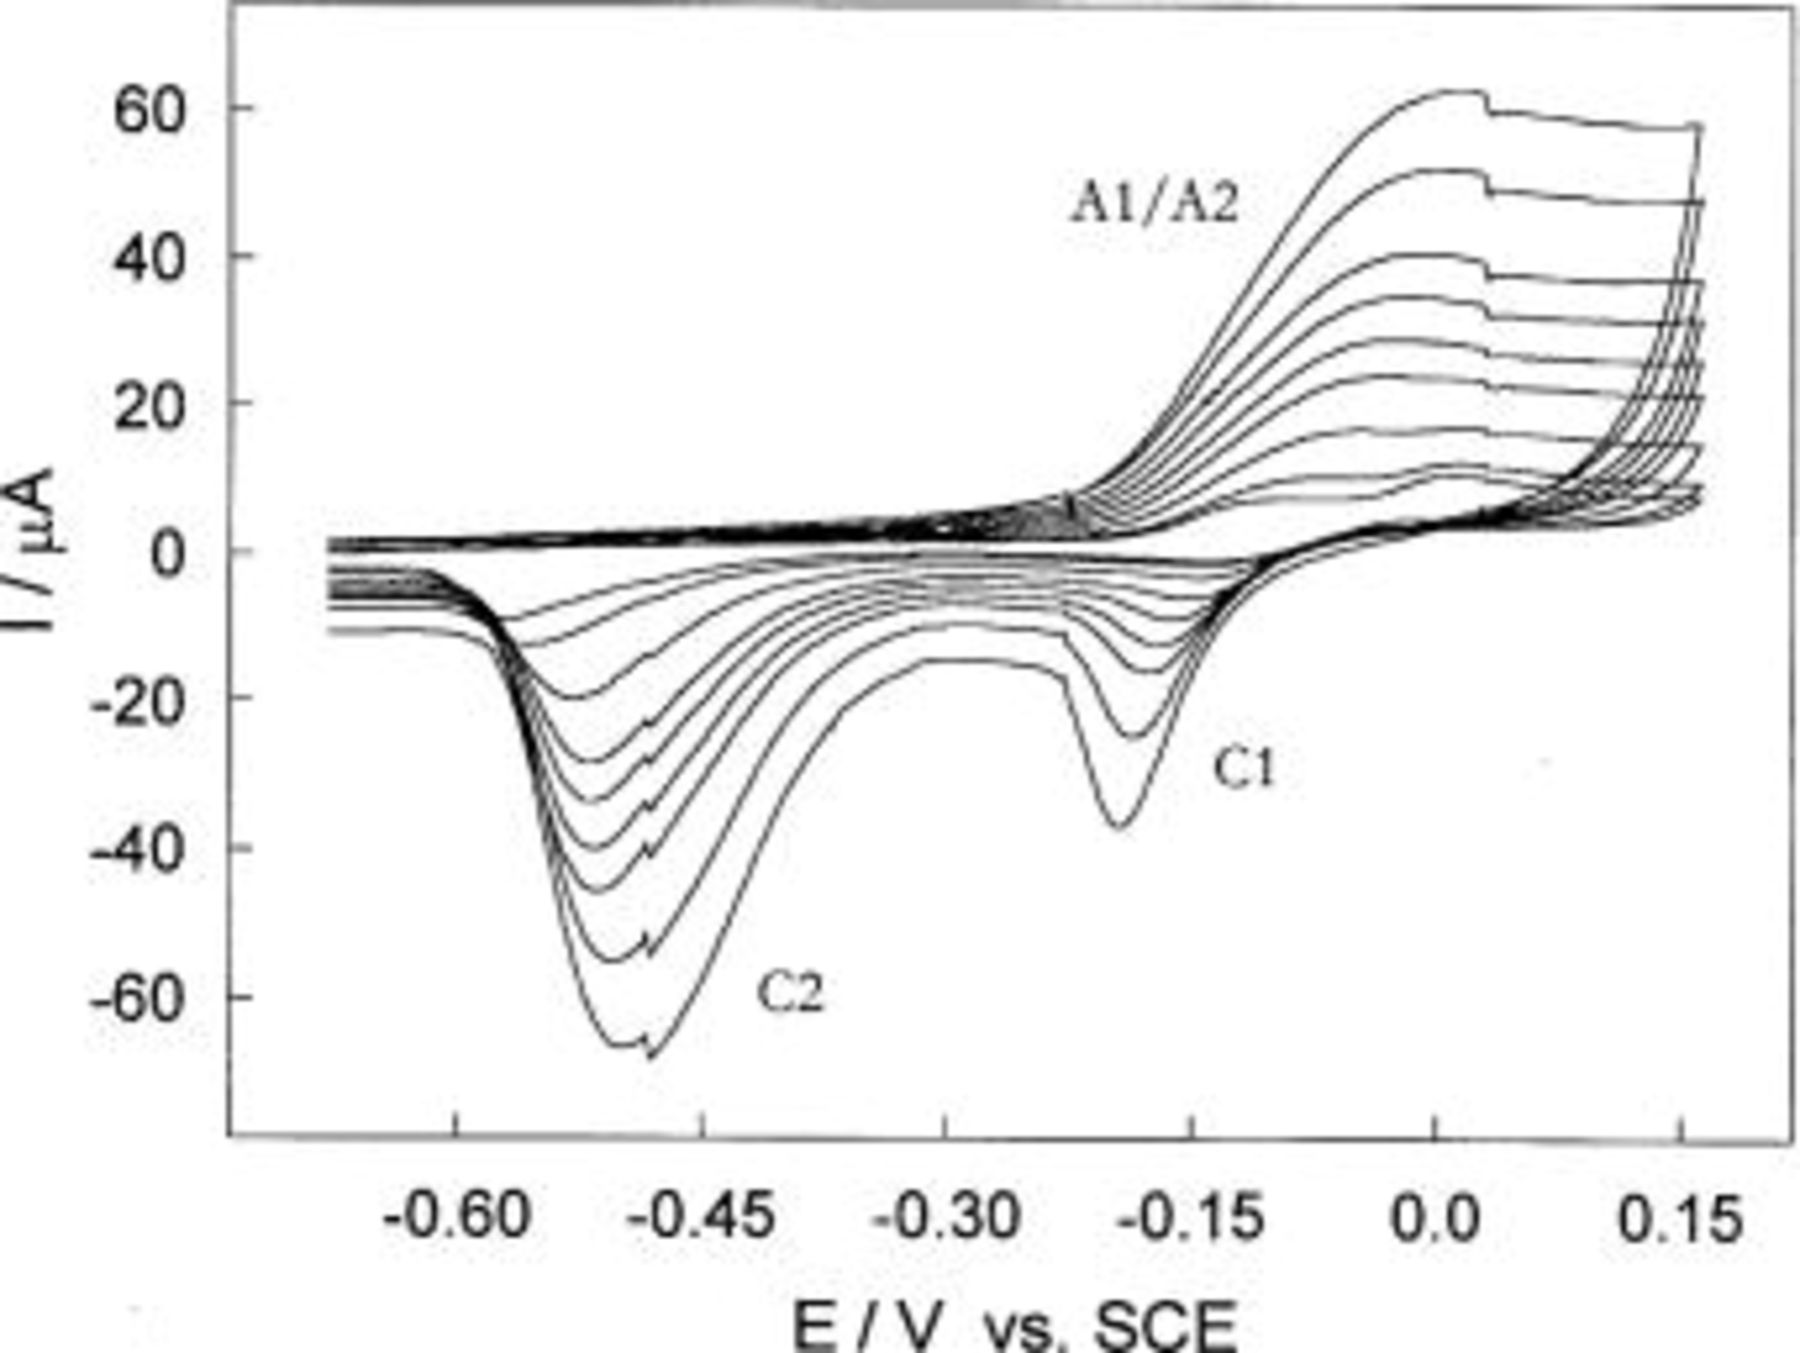
Figure 4. CVs for Cu in borate buffer solution, pH 8.4 obtained at various sweep rates,  5, 10, 15, 20, 25, 30, 40, and 50 mV s−1.
A linear relationship was also observed between the peak currents 

 and the square root of the sweep rate. For the current peaks
  and
and  the straight lines pass almost through the origin. The intercepts slightly different than zero indicate that the induction rate is required before the electrode reactions become limited by diffusion. For the current peak
  the
the  against
  dependence showed two segments. At lower sweep rates the slope of
  vs.
vs.  was the same as that for the current peak
  while at higher sweep rates the slope was much greater. The most probable reason for the observed behavior is disproportionation of
Impedance spectroscopy results
Wide frequency range impedance measurements, from 100 kHz to 30 kmHz, were applied to investigate the nature of the Cu/borate buffer system, pH 8.4, in the potential range from −0.3 to 0.9 V. Prior to the EIS measurements, the samples were cathodically polarized to −1.4 V for 45 s, then potentiodynamically polarized to the desired potential value at a sweep rate of 10 mV s−1. After a 10 min wait period, impedance data were collected. Impedance measurements typically took about 30 min due to the low frequencies involved. The potential was then progressively stepped in the positive direction to the desired value and the process was repeated. In order to present the impedance data completely (in the entire potential and frequency range applied), and to give a more general overview of the influence of potential on the impedance response of the Cu/oxyhydroxide electrolyte interface, Bode plots have been presented as 3-D surface plots in Fig. 5. Several characteristic potential regions could be distinguished, quite comparable to those determined from the CV presented in Fig. 1.
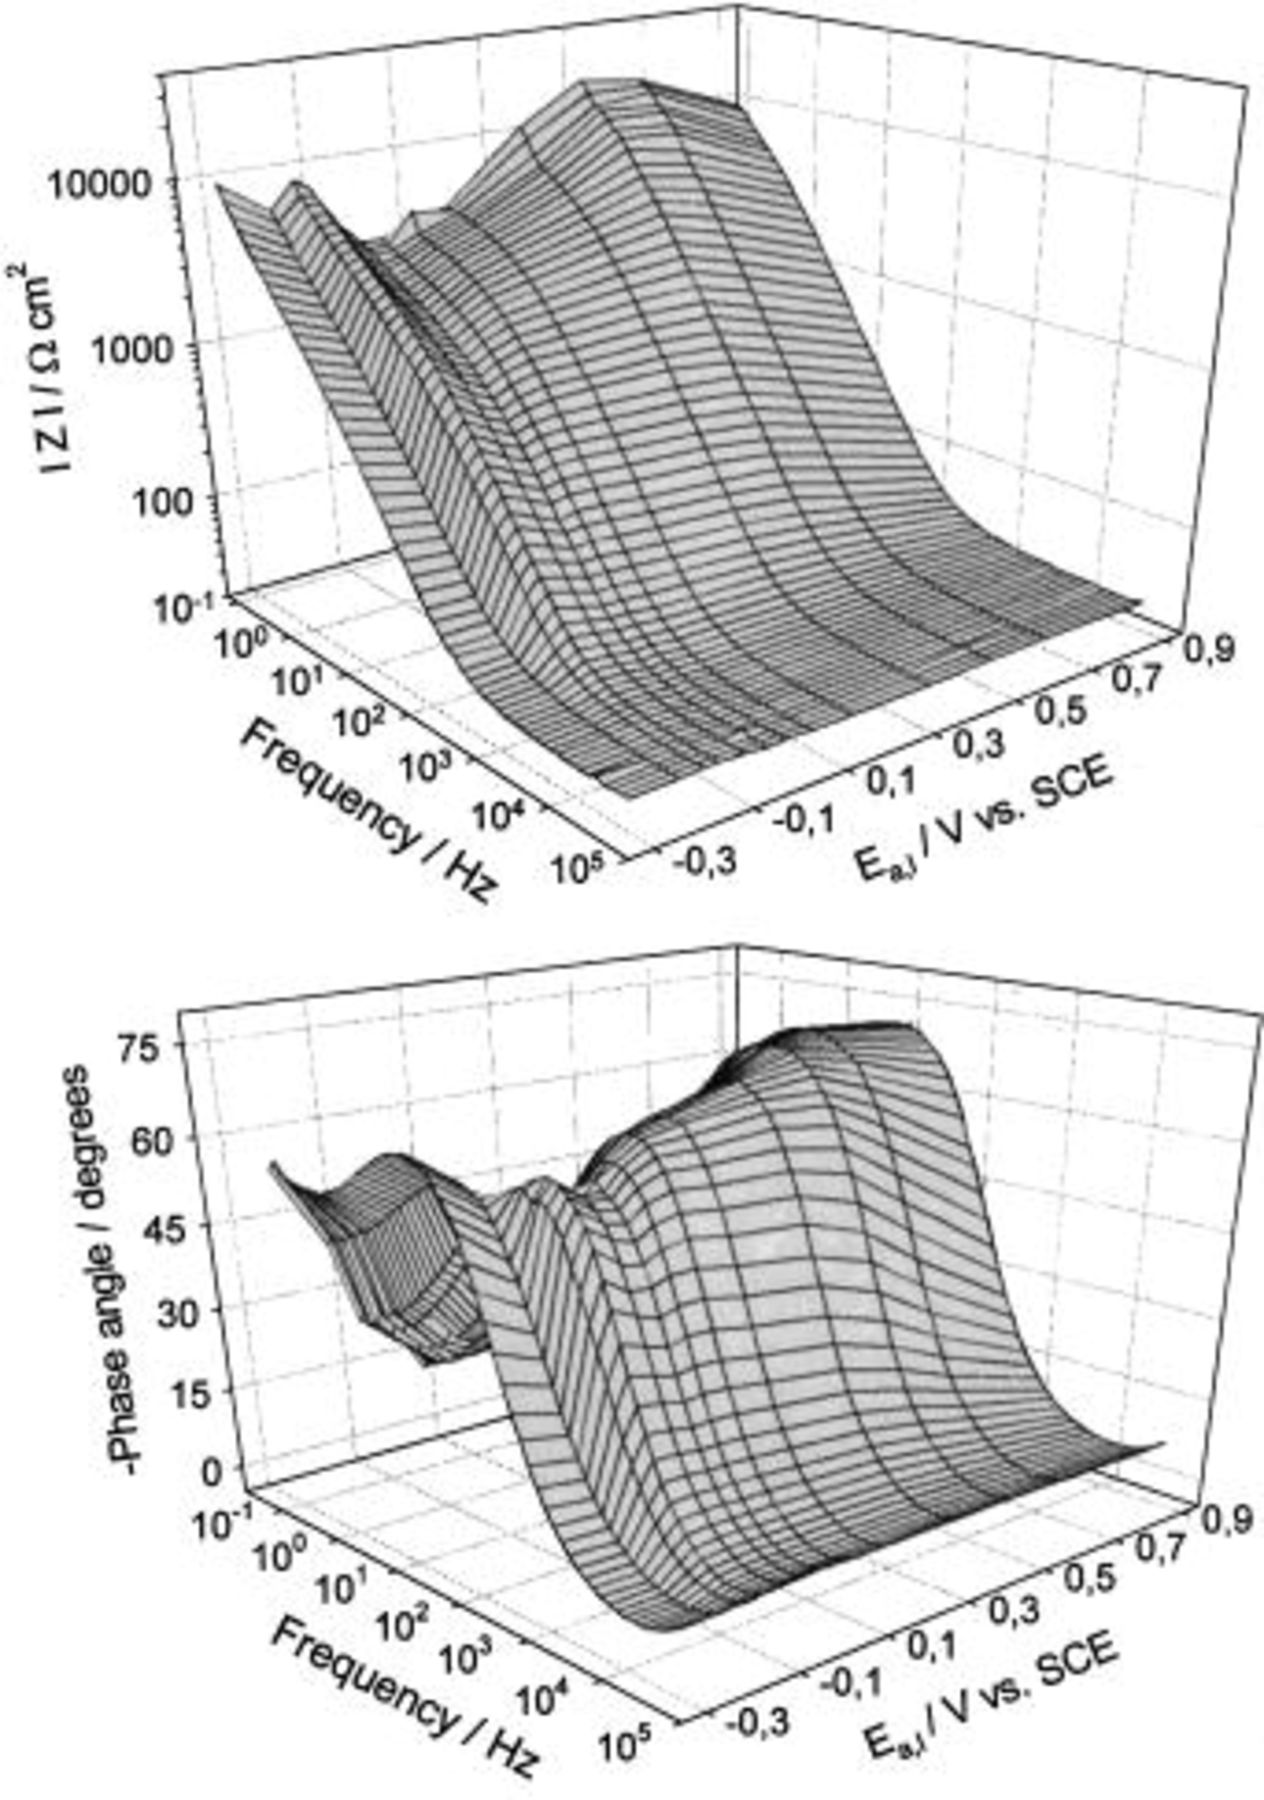
Figure 5. 3-D Bode plots for a Cu electrode in borate buffer solution, pH 8.4 obtained at various anodic potentials in the potential range −0.3 to 0.9 V.
The potential region up to −0.07 V corresponds to Cu(I) oxyhydroxide nucleation and formation. The first step is adsorption of hydroxide ions, which could be related to the initial electrooxidation step forming the new phase according to the reaction

According to Strehblow and co-workers,26 this process begins ca. 200 mV millivolts before the  layer can be observed in a diluted alkaline solution, and the corresponding charge and thickness are approximately 55 μF cm−2 and 0.2 monolayer, respectively. The maximum of the low frequency absolute impedance and the minimum of the phase angle at about −0.07 V most probably correspond to the
  monolayer (see the results of cyclic voltammetry). The growth of a surface layer, above a monolayer, is followed by a further increase in the low frequency absolute impedance up to the potential value of 0.5 V. Between 0.0 and 0.5 V electrode resistance of the order of
  is observed. According to Fig. 3, the passive surface overlayer is between 1.1 and 2.6 nm thick. This suggests that the surface overlayer exhibits ionic resistivity
  where
where  is the oxide thickness) of
  Above 0.5 V, |Z| decreases and the phase angle increases with potential. This correlates to the onset of structural transformations in the surface film because surface film thickness is a linear function of the potential in the entire potential range, as can be seen from Fig. 3.
For frequencies ranging up to nearly 1 Hz, the electrode impedance may be precisely described by a constant phase element in series with a resistor  27
28
27
28

where  is the absolute impedance at
 denotes the complex variable for sinusoidal perturbation with
  and n is the slope of the
  vs.
vs.  Bode plot. The factor n is an adjustable parameter that usually lies between 0.5 and 1. The constant phase element (CPE) only describes an ideal capacitor when
  Otherwise, for
  the CPE describes a distribution of dielectric relaxation times in frequency space. A constant phase element has been used to model oxide film formation.23
24
25
27
28
29
30 The symbol
the CPE describes a distribution of dielectric relaxation times in frequency space. A constant phase element has been used to model oxide film formation.23
24
25
27
28
29
30 The symbol  represents the resistive component measured at the high frequency limit. This resistance is attributed to the solution between the Luggin capillary and the working electrode.
Figure 6 shows how the  n and electrode capacitance C (calculated at 0.16 Hz) depend on the electrode potential in the potential range from −0.3 to 0.9 V. For illustration, the anodic branch of the CV is presented in all cases.
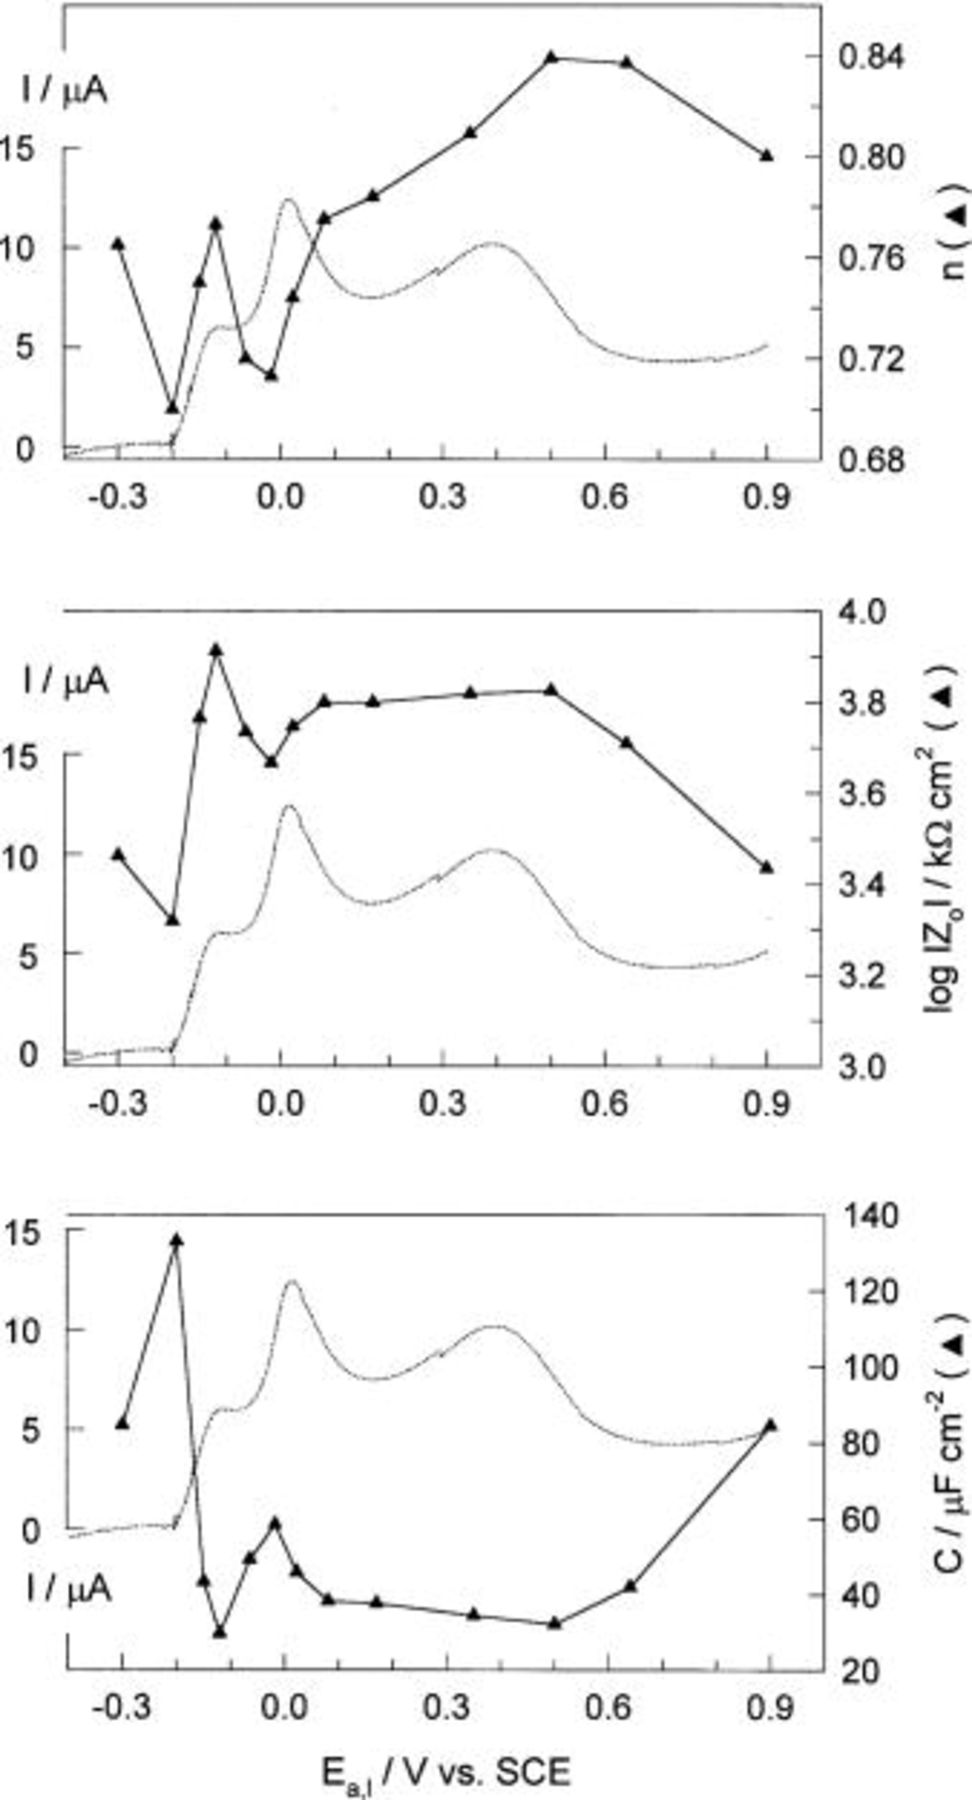

It is clearly evident that the  monolayer formation (the current peak
  is accompanied by a sharp increase in
  and a decrease in the electrode capacitance to the value characteristic for a passive copper electrode. Electrochemical polarization curves, XPS, and ion scattering examination8 show that copper forms a
  layer at potentials above 0.58-0.058 pH vs. SHE, in weakly acidic and alkaline solutions. According to Strehblow and co-workers,10 the initial stage of
  layer formation is characterized by a competition between dissolution and nucleation of the oxide grains locally blocking the dissolution. Keeping in mind the results of Arvia et al. ,31 the first step in copper passivation and
  formation corresponds to
  ion discharge on the Cu surface, i.e., the electrochemical reaction associated with the
  redox couple. This type of reaction is considered to be the first step in the electro-oxidation of many metals in aqueous solution and is generally a fast electrochemical reaction.
  undergoes dissolution in a reaction with
  ions, and
  forms according to
  The results showed that the oxide formation proceeds by a preferential nucleation of the oxide grains whose dimensions are 2-3 nm laterally and 0.25-0.3 nm vertically.10 Further growth of the oxide film is expected to proceed by 3-D thickening with consumption of Cu from the substrate below the oxide nuclei. The film growth can be considered with respect to the electrochemical reactions occurring both at the metal/oxide interface and at the oxide/electrolyte interface. The oxidation of metal atoms at the metal/oxide interface generates a driving force for formation of anion vacancies (see Ref. 32 and references therein)

where  is a copper atom in a regular metal site,
  is a copper cation in a regular site of the oxide film,
  is a positively charged oxygen vacancy, and
  represents the electron. At the oxide/electrolyte interface, anion vacancies become occupied by anions

where  is an oxide ion in a regular site of the oxide film and
  is the hydrogen ion in the aqueous solution. Cation vacancies
  formed by dissolution of cations into the electrolyte diffuse toward the inner surface where they can exchange with cations

where  is a positively charged copper cation in the aqueous electrolyte,
  is a negatively charged cation vacancy in the oxide film, and
  is a neutral vacancy in a regular metal site. Photoelectrochemical measurements of passive copper in the potential range of
  formation describe its electronic properties.26
33
34
35
36 According to these investigations, the oxide has properties similar to those of a p-type semiconductor with a high density of local states within the bandgap. Therefore, the increasing electrode potential during anodic polarization leads to an upward bending of the energy bands, and accumulation of positive holes. At the potential where the valence band of
formation describe its electronic properties.26
33
34
35
36 According to these investigations, the oxide has properties similar to those of a p-type semiconductor with a high density of local states within the bandgap. Therefore, the increasing electrode potential during anodic polarization leads to an upward bending of the energy bands, and accumulation of positive holes. At the potential where the valence band of  crosses the Fermi level, a large accumulation of positive holes causes the formation of a higher valency Cu oxide and subsequently duplex film formation with a redistribution of the potential drop inside the two layers. The simple band structure model for thin Cu oxide films on copper for increasing electrode potential is depicted in the inset in Fig. 1.
In the potential range corresponding to the electroformation of copper(II) oxide (from the current peak  to
to  a certain decrease in
  and an increase in C can be observed. However, the formation of a duplex structure of the passive layer is followed by an increase in
  and a decrease in C. Electrochemical polarization curves, XPS and ion scattering examination show that copper forms a
  duplex film at potentials above 0.78-0.059 pH vs. SHE in weakly acidic and alkaline solutions.8 Assuming that
  film initially forms before the growth of a duplex oxide film, the outer layer will be formed by a direct reaction of
  and water

Anodic oxidation of  ions previously dissolved from the copper surface may contribute to the formation of an outer layer

The formation of these thin oxide layers by precipitation from a supersaturated electrolyte adjacent to the metal surface does not seem very likely. Therefore, a mechanism of direct oxide growth on the electrode (metal) surface is accepted. The growth rate increases with increasing anodic potential.
In the potential range between 0.0 and 0.5 V, the passive electrode behaves like a simple nonideal dielectric with the capacitance diminishing with the potential. In this potential region, the dielectric constant of the oxide layer,  was examined using the equation for the parallel plate capacitor

where  is the capacity of the electrogenerated oxide film, and
  is the oxide thickness calculated from the cathodic charge using the Faraday law (Fig. 3). For the roughness factor, σ equal to 2, the corresponding dielectric constant of the total oxide film is 105. A sharp departure from simple dielectric behavior occurs above 0.5 V, where reciprocal capacitance begins to decrease, while at the same time the dielectric constant begins to increase.
Above the current peak  prior to the onset of oxygen evolution, the current density decreases, while an increase in capacitance and a decrease in
  can be observed (Fig. 6). Similar behavior was observed by Speckmann et al.7 in an alkaline solution, and was attributed to the formation of new species,
  A further increase in the electrode potential, at potentials >0.9 V, causes the crossing of the CuO layer valence band and the Fermi level and leads to a transpassive region. This increasing potential drop in the Helmholtz layer accelerates the rate of the electrochemical reactions at the oxide/electrolyte interface, i.e., the dissolution of
  ions from the oxide surface and oxygen evolution. For
  transpassive dissolution and oxygen evolution are expected according to experimentally determined band structure model in the inset in Fig. 3.
Using a simple resistivity model, it is possible to estimate the concentration of oxygen vacancies. Their concentration,  within the oxide film is given by the equation37
where  is the charge carrier velocity (equal to
  where D is the diffusion coefficient of metallic cations in the oxide film taken as
  and d is the film thickness), q is the related charge
 is the film resistivity, and
  represents the electric field strength. With increasing potential of oxide formation from 0.00 to 0.90 V, the film resistivity,
  linearly decreases from a value of
  to
to  A linear decrease in
  correlates with an increase in concentration of charge carriers from
  to
to  as is shown in Fig. 7. The obtained values are similar to those referred for many metal/metal oxide/electrolyte systems such as iron/iron oxide,38 tin/tin oxide,39 and tungsten/tungsten oxide.40
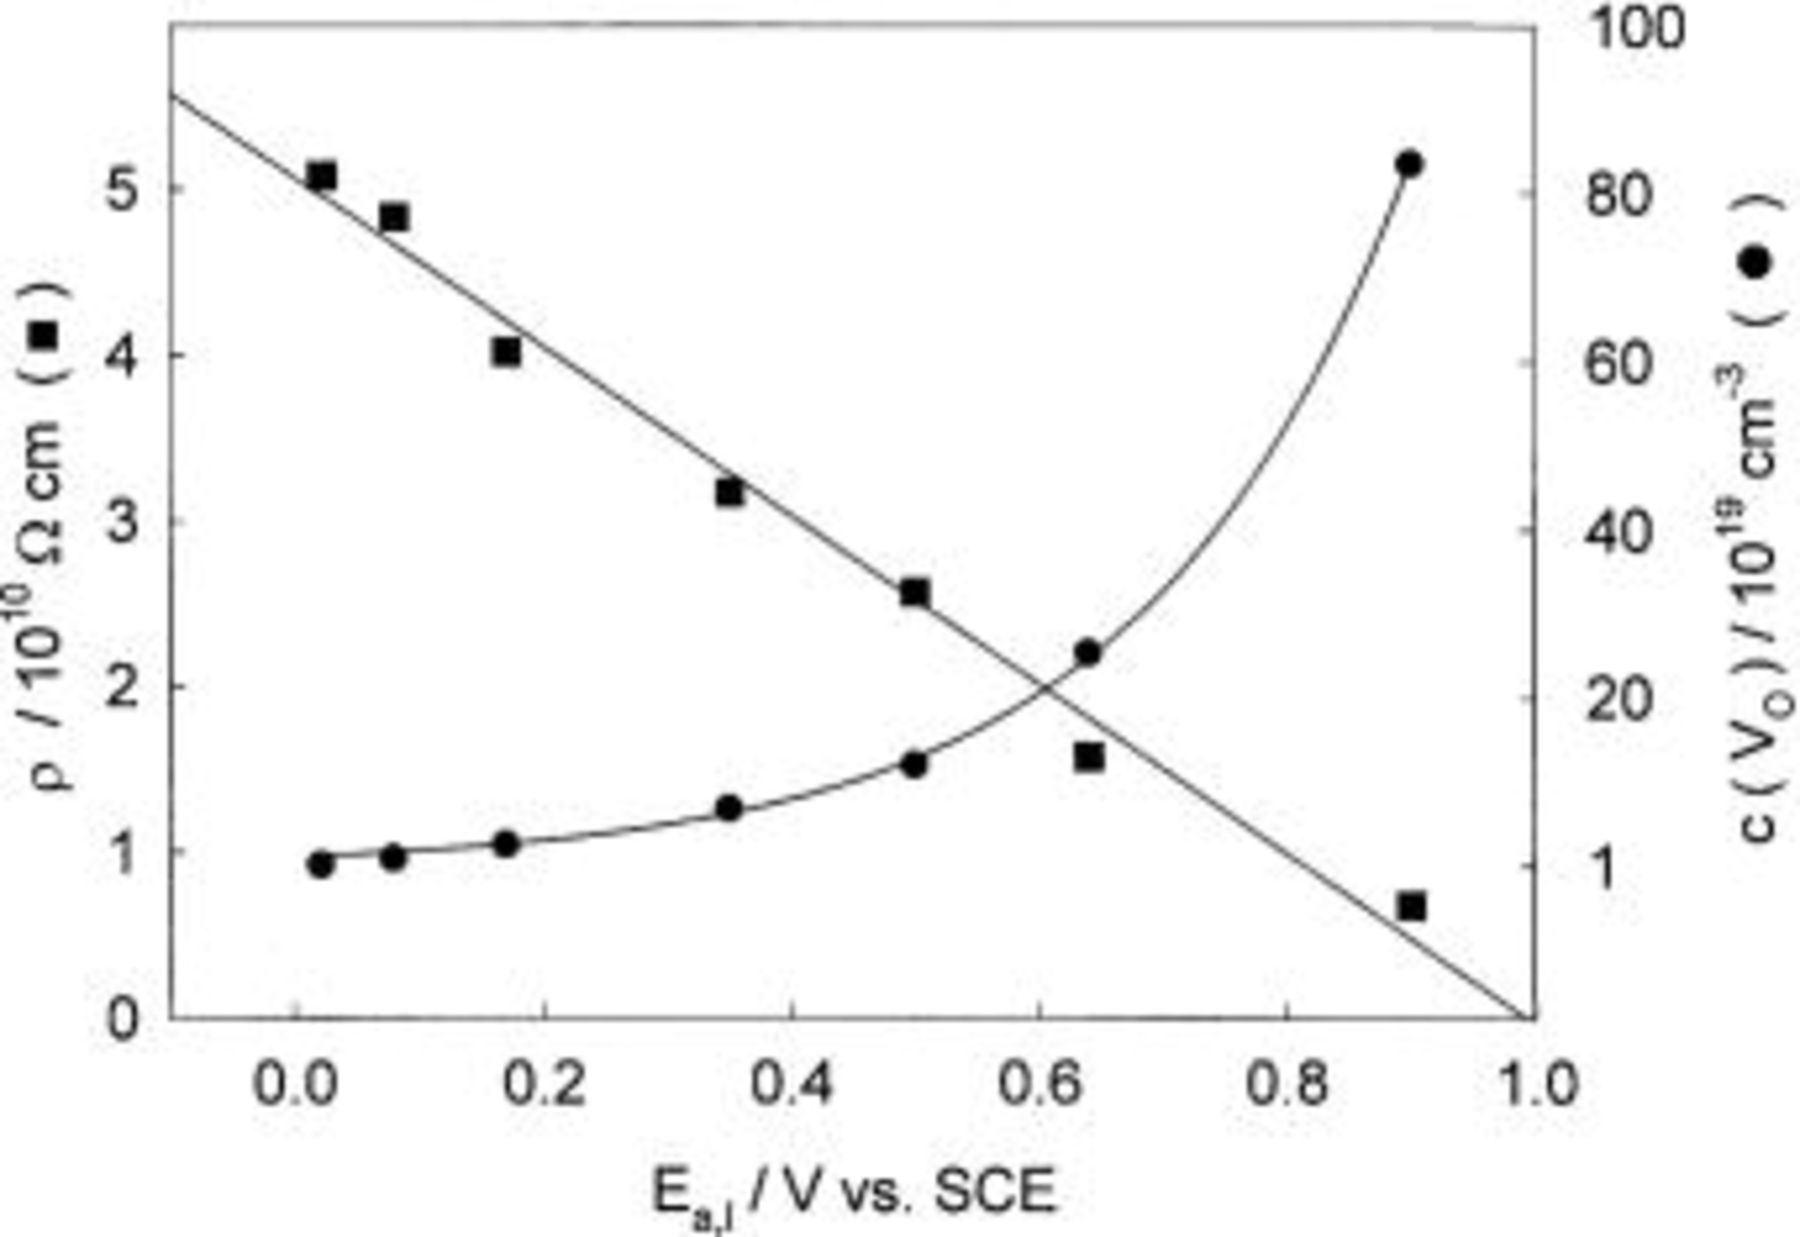
Figure 7. Ionic resistivity and vacancy concentration in the oxide layer vs. the anodic potential of the Cu electrode in borate buffer solution, pH 8.4.
The potentiodynamic behavior of copper in alkaline electrolyte reveals that the process involves a series of complex reactions including electrochemical and chemical stages occurring both consecutively and competitively. This reaction formalism allows the participation of processes controlled by phase growth associated with conductivity changes in the oxide layer. During the oxide layer growth under potentiodynamic conditions differential dehydration processes yield a changing OH/O ratio through the oxide layer. In essence, an increase in the potential increases the ratio of oxide to hydroxide ions, which accompanies the structural changes within the oxide film, i.e., the transformation from an amorphous, glassy to a crystalline structure.41 The amorphous oxides all occupy larger volumes than the same mass of crystalline material.42 Crystallization produces electron-conductive paths through the anodic oxide film and oxygen can be sited in these crystalline regions during film growth up to the potential value of about 1.0 V, where oxygen evolution begins.
Conclusions
The electrochemical and impedance spectroscopy results obtained in a borate buffer solution, pH 8.4, lead to the following conclusions.
The cyclic voltammetry results show that copper passivation corresponds to the electroformation of a duplex oxide film  the
the  inner barrier layer and the complex hydrous
  outer layer.
The film thickness, calculated from cathodic charge consumed during the reduction of anodically formed oxide film, increases with increasing anodic polarization and amounts to 4.3 nm at 0.9 V. With increasing anodic polarization, the amount of  (the outer part of the film) increases, and at 0.9 V it comprises almost one-half of the total film thickness.
The passivation properties can be ascribed to semiconducting properties and a simple band model was adopted for oxide layer formation on copper during increasing electrode potential.
Impedance measurements show a strong correlation between the changes in the composition and structure inside the oxide layer and impedance parameters such as the absolute impedance, the electrode capacitance, and the slope of the  vs.
vs.  plot.
plot.
In the potential range from 0 to 0.5 V, the oxide film behaves almost like a simple nonideal dielectric. Its ionic resistivity was determined to be of the order of  the dielectric constant close to 105, and the vacancy concentration of the order of
Above 0.5 V, electronic factors govern the structural changes of the outer complex hydrous Cu(II) film. These changes are accompanied by an increase in the current density, the electrode capacity, and the concentration of vacancies. For  an increase in the potential drop at the Helmholtz layer enhances transpassive dissolution of Cu(II) ions and
  evolution.