

Abstract
P2-type layered oxides with the general Na-deficient composition NaxTMO2 (x < 1, TM: transition metal) are a promising class of cathode materials for sodium-ion batteries. The open Na+ transport pathways present in the structure lead to low diffusion barriers and enable high charge/discharge rates. However, a phase transition from P2 to O2 structure occurring above 4.2 V and metal dissolution at low potentials upon discharge results in rapid capacity degradation. In this work, we demonstrate the positive effect of configurational entropy on the stability of the crystal structure during battery operation. Three different compositions of layered P2-type oxides were synthesized by solid-state chemistry, Na0.67(Mn0.55Ni0.21Co0.24)O2, Na0.67(Mn0.45Ni0.18Co0.24Ti0.1Mg0.03)O2 and Na0.67(Mn0.45Ni0.18Co0.18Ti0.1Mg0.03Al0.04Fe0.02)O2 with low, medium and high configurational entropy, respectively. The high-entropy cathode material shows lower structural transformation and Mn dissolution upon cycling in a wide voltage range from 1.5 to 4.6 V. Advanced operando techniques and post-mortem analysis were used to probe the underlying reaction mechanism thoroughly. Overall, the high-entropy strategy is a promising route for improving the electrochemical performance of P2 layered oxide cathodes for advanced sodium-ion battery applications.
Export citation and abstract BibTeX RIS

Original content from this work may be used under the terms of the Creative Commons Attribution 4.0 license. Any further distribution of this work must maintain attribution to the author(s) and the title of the work, journal citation and DOI.
This article was updated on 23 September 2022 to correct an author affiliation.
Future perspectives
Sodium-ion batteries represent a promising alternative to lithium-ion batteries for large-scale electrochemical energy storage. For the future development of sodium-ion batteries, research efforts should be directed toward exploring high-performance cathode materials, which strongly determine the overall cell costs. In recent years, layered oxide cathode materials have attracted great attention owing to their high operating voltage, easiness of fabrication and environmental sustainability. Among them, P2-type layered materials are particularly favored for their beneficial transport properties, enabling excellent rate capability. However, the unfavorable P2-O2 phase transition has been shown to deteriorate the cycling performance and stability. The emerging high-entropy approach seems to hold promise for mitigating this problem by suppressing structural transformation and transition-metal leaching. Nevertheless, future work on stabilizing the oxygen redox during cycling is urgently needed.
1. Introduction
In recent years, interest in sodium-ion batteries (SIBs) for various applications, especially large-scale energy storage, has grown [1, 2]. This development is due to the exponential increase in global energy and societal demands for the sustainability of materials [3]. Compared to the widely used lithium-ion batteries (LIBs), SIBs represent a viable alternative because of their lower costs and the use of Na, an abundant resource [4, 5]. In SIB full cells, cathode materials play a crucial role in improving cycling stability and are therefore the subject of many research activities. In general, cathode R&D has focused intensively on layered oxides Nax TMO2 (TM = transition metal) with various structures that offer high theoretical specific capacities, high operating potential and favorable Na+ transport properties [6, 7].
Layered TM oxides are commonly classified into different types, such as O3, P3, P2 and O2, based on the corresponding stacking and coordination of the TMO2 layers, according to the scheme of Delmas et al from the early 1980s [8]. The crystallographic nature of Na-based layered oxides differs from that of Li-based oxides because the Li+ ions prefer different coordination environments. Li-based layered oxides crystallize in so-called O- and T-structures, in which the Li+ ions are located on octahedral (O) and tetrahedral (T) sites [7]. In contrast, Na-based layered oxides generally exist in O3 and P2 structures, with the Na+ ions preferentially occupying the octahedral (O) or prismatic (P) sites. The O3 structure exhibits a high energy barrier for Na+ diffusion, leading to a complex phase transition during sodiation/desodiation [9]. In comparison, the Na+ transport pathways in a trigonal prismatic environment, the P2 structure, allow for faster ion diffusion [10–13]. This is advantageous for energy storage, as it favors the electrochemical reactions and results in larger reversible capacities. However, the structures do not remain stable in the P2 structure, because unfavorable phase transitions between P2 and O2 structures often occur during cycling (caused by layer sliding or TM migration), which affects the reversibility of the reaction due to structural degradation [1, 13, 14]. The phase transition from P2 to O2 occurs at high charge potentials (>4.2 V) when the Na+ ions are extracted from the layer, leading to energetically unfavorable states. Such a transformation is usually not completely reversible and results in a deterioration of the kinetics and lifetime of the electrode [15, 16]. In addition, Mn, an essential component in the layered oxides, plays a non-negligible role in the P2-type materials. During discharge (sodiation) at potentials above 2.0 V, the Mn ions, which are present in the +4 state, are ideally electrochemically inactive and stabilize the structure. However, when the electrode material undergoes further discharge (below 2.0 V), Mn4+ is reduced to Mn3+ [7, 17, 18]. The increased amount of Jahn–Teller active Mn3+ leads to increasing lattice distortion and loss of active material and even results in the appearance of new phases, ultimately resulting in deterioration of the electrochemical properties [18–20]. Therefore, effective strategies to develop high-performance and stable P2 cathodes include, among others, the reduction of unwanted phase transformations and suppression of Mn reduction during cycling, both of which are considered critical for commercial applications [19, 21].
The recently emerging high entropy concept, first introduced in multicomponent metal alloys, opens up new opportunities for materials design and synthesis [22, 23]. In short, by incorporating various elements into a single-phase structure, the large configurational entropy gain may cause entropy-induced structural stabilization and trigger so-called cocktail effects [24–28]. In the field of SIBs, a high-entropy O3-type material has been reported by Zhao et al in 2019, showing a good long-term performance at different charge/discharge rates [29]. More recently, Yang et al reported on a P2-type oxide for SIBs, with the elements being present in equimolar concentrations and improved cycling performance [30]. Despite these examples, this is just the beginning of applying the high entropy concept to layered energy materials. In particular, the role of entropy stabilization and cocktail effects needs further study.
In this work, three different P2-type Na-ion cathode materials for SIBs were synthesized by a simple solid-state reaction method. In the following, Na0.67(Mn0.55Ni0.21Co0.24)O2, Na0.67(Mn0.45Ni0.18Co0.24Ti0.1Mg0.03)O2 and Na0.67(Mn0.45Ni0.18Co0.18Ti0.1Mg0.03Al0.04Fe0.02)O2 are denoted as low-, medium- and high-entropy materials and referred to as 3-NTMO2, 5-NTMO2, and 7-NTMO2, respectively. The oxidation state of Mn is fixed at +4 by tailoring the metal ratio to eliminate the Jahn–Teller effect in the initial state. Operando/post-mortem X-ray diffraction (XRD) and differential electrochemical mass spectrometry (DEMS) were used to gain detailed insights on the stability and to follow the structural evolution of the different samples during cycling. In addition, X-ray photoelectron spectroscopy (XPS), X-ray absorption spectroscopy (XAS) and inductively coupled plasma-optical emission spectroscopy (ICP-OES) measurements were conducted to study the behavior of Mn in these materials. In this work, the effect of entropy on the cycling stability, energy density and voltage/capacity retention at two different cut-off potentials is discussed in detail. It is found that 7-NTMO2, with the highest configurational entropy, exhibits the best structural stability and lowest Mn dissolution during cycling. Taken together, the high-entropy strategy is a valuable guide to improve the performance of SIBs and to drive innovation in materials design.
2. Experimental
2.1. Materials synthesis and characterization
All of the P2-type cathode materials, Na0.67(Mn0.55Ni0.21Co0.24)O2, Na0.67(Mn0.45Ni0.18Co0.24Ti0.1Mg0.03)O2 and Na0.67(Mn0.45Ni0.18Co0.18Ti0.1Mg0.03Al0.04Fe0.02)O2 were synthesized via solid-state reaction. In the first step, stoichiometric amounts of the precursors Na2CO3 (Acros Organics, 99.95%), MgO (abcr GmbH, 99.5%), Al2O3 (Alfa Aesar, 99.5%), TiO2 (Alfa Aesar, 99.5%), Mn3O4 (abcr GmbH, 97%), Fe3O4 (Alfa Aesar, 97%), Co3O4 (Alfa Aesar, 99%) and NiO (Alfa Aesar, 99%) were thoroughly mixed by ball milling at 400 rpm for 2 h and compacted into pellets under 5 t of pressure. After that, the pellets were heated to 500 °C for 2 h and calcined at 900 °C for 12 h. The final product was obtained by naturally cooling to room temperature and then kept inside an Ar-filled glovebox (O2 < 0.1 ppm, H2O < 0.1 ppm) to prevent further exposure to air.
XRD measurements were conducted on powder samples using a Bruker D8 Advance diffractometer with a Cu-Kα (λ = 1.5406 Å) radiation source. Refinement of XRD patterns was done using Fullprof Suite software. The calibration sample for determining the instrumental resolution is commercially available and was received from the National Institute of Standards and Technology (LaB6 880 c).
For ICP-OES characterization of the as-prepared powder samples, an iCAP 7600 ICP-OES DUO (Thermo Fisher Scientific) was used. More details are provided elsewhere [31, 32].
Scanning electron microscopy (SEM) imaging was performed on a ZEISS Gemini Leo 1530 equipped with an Oxford energy dispersive X-ray spectroscopy (EDX) detector. Transmission electron microscopy (TEM) (with FEI double tilt holder) measurements were carried out on powder samples dispersed on a lacey carbon coated Cu grid. Selected area electron diffraction (SAED) and scanning TEM (STEM)-EDX data were collected using a double-corrected ThermoFisher Themis-Z equipped with a Super-X EDX detector. The TEM microscope was operated at an accelerating voltage of 300 kV. The high-resolution STEM image shown in figure 2(b) and the EDX maps in figure 2(d) were acquired from a thin lamella prepared by focused ion beam milling.
2.2. Electrochemical characterization
The cathodes contained 70 wt.% oxide as active material, 20 wt.% Super C65 carbon black additive (Imerys Graphite & Carbon) and 10 wt.% Solef 5130 polyvinylidene fluoride (Solvay) binder. The different constituents were uniformly dispersed into N-methyl-2-pyrrolidone using a planetary mixer (Thinky ARE-250). Then, the slurry was cast by doctor blading (100 µm slit size) onto an Al current collector (Gelon LIB Co., Ltd) and dried in a vacuum at 120 °C for 12 h. Electrode discs of diameter 13 mm were punched from the cathode sheet and used to assemble CR2032 coin cells inside an Ar-filled glovebox. The areal active material loading was in the range between 1.5 and 2.5 mg cm−2. The electrolyte used was 1.0 mol l−1 NaClO4 in a 1:1:1 volume ratio of ethylene carbonate (EC), dimethyl carbonate (DMC), and propylene carbonate (PC) with 5 vol.% fluoroethylene carbonate (FEC). GF/D glass microfiber filter paper (Whatman) and Na metal foil (Sigma-Aldrich, 99.9%) were used as separator and counter electrode, respectively. Galvanostatic cycling tests were carried out on a Land CT2001A battery test system (Wuhan LAND Electronic Co., Ltd) at 25 °C. The specific capacity was calculated based on the mass of active material (1C = 200 mA g−1). Cyclic voltammogram (CV) curves were collected on a potentiostat (Bio-Logic VSP) at a scan rate of 0.1 mV s−1. All voltages are reported vs. Na+/Na.
2.3. Operando XRD
Operando XRD measurements were conducted on customized CR2032 coin cells with 4 mm diameter Kapton windows on each side using a STOE Stadi P diffractometer equipped with a Ga-Jet X-ray source (Ga-Kβ radiation, λ = 1.20793 Å). To this end, cathodes with an active material loading of 2.5–3.0 mg cm−2 were used. Galvanostatic charging/discharging was done at 0.05C rate in a voltage range of 1.5–4.6 V using a Bio-Logic SP-150 potentiostat. XRD patterns were collected in the 2θ range of 10°–70° with a counting time of 45 min per scan.
2.4. DEMS
A customized DEMS cell using a 30 mm diameter cathode (3.5 mg cm−2 areal loading) was charged/discharged in a voltage range of 1.5–4.6 V at 20 mA g−1. A 4 mm diameter hole in the center of the cathode allowed for gas flow. GF/D glass microfiber, Na metal and 800 µl 1.0 mol l−1 NaClO4 in EC:DMC:PC (1:1:1 vol.) with 5 vol.% FEC were used as separator, anode and electrolyte, respectively. During electrochemical cycling, a constant stream of He (purity 6.0) carrier gas (2.5 ml min−1) was passed through the cell. The extracted gas mixture was analyzed using a mass spectrometer (Omni Star GSD 320, Pfeiffer Vacuum GmbH). Further details of the device's working principle can be found in the literature [33, 34].
2.5. XPS
The XPS measurements were performed on a Specs XPS system with a Phoibos 150 energy analyzer using monochromatic Al-Kα radiation (1486.6 eV), a take-off angle of 45° and pass energies of 30 eV and 90 eV at the analyzer for detail and survey spectra, respectively.
2.6. XAS
Operando X-ray absorption near-edge structure (XANES) at the Co K-edge, Ni K-edge and Mn K-edge were performed at the beamline P65 of PETRA III extension of DESY (Hamburg, Germany) in transmission mode. The electrodes were prepared using carbon paper as the current collector and the mass loading of the active material was around 12 mg cm−2. Customized coin cells with Kapton windows were assembled using the same electrolyte as above, which were then connected with an eightfold coin-cell holder coupled with a Bio-Logic VMP3 potentiostat [35]. The cells were cycled at 0.1C (1C = 200 mA g−1) in a voltage range of 1.5–4.6 V. Appropriate metal foils were used for calibration and data was analyzed using the DEMETER package [36].
2.7. ICP-OES analysis of the electrolyte
The Mn content in the electrolyte-filled separators was determined as follows: Each separator was immersed in 5 ml DMC inside an Ar-filled glovebox. The aliquots were then diluted by a factor of 100 with doubly-distilled deionized water and the Mn concentration in the resulting solutions was determined by ICP-OES using an Ultima2 (Horiba).
3. Results and discussion
3.1. Structure and morphology
The experimental XRD data and corresponding Rietveld refinements for the 3-NTMO2, 5-NTMO2, and 7-NTMO2 structures are shown in figure 1. All three patterns were analyzed using the P63/mmc space group with the ideal P2 stacking, assuming a random distribution of cations in the TM layers. The refinement results are provided in table S1 of the supporting information. A larger c lattice parameter was calculated for 7-NTMO2 (11.1542(5) Å) compared to 3-NTMO2 (11.1343(4) Å) and 5-NTMO2 (11.1443(6) Å), allowing for a lower diffusion barrier for the Na+ ions. The elemental composition was probed by ICP-OES. As shown in table S2 of the supporting information, the atomic ratios of elements agree well with the targeted compositions. This result indicates that no components were lost during sample preparation. Using equation S1 of the supporting information, the configurational entropy was determined to be 0.99R, 1.34R, and 1.52R for 3-NTMO2, 5-NTMO2, and 7-NTMO2, respectively.
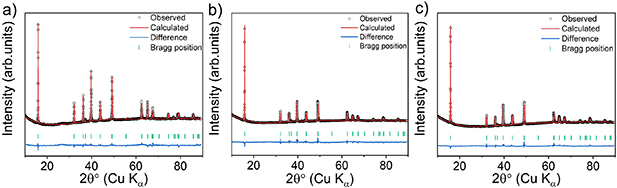
Figure 1. XRD patterns and Rietveld refinement profiles for the as-prepared (a) 3-NTMO2, (b) 5-NTMO2 and (c) 7-NTMO2 powders.
Download figure:
Standard image High-resolution imageTo gain more insights into the structure of the as-prepared materials, the morphology and elemental distribution were investigated by SEM and TEM. Because the samples have similar morphological characteristics, only 7-NTMO2 is shown as an example (figure 2). For comparison, the results for 3-NTMO2 and 5-NTMO2 are presented in figure S1 of the supporting information. As shown in figure 2(a), the powder sample consists of irregular plate-like particles. The size ranges from 1 to 3 µm, with nanoscale particles covering some parts of the micron-sized. These particles exhibit high crystallinity with a spacing of 0.56 nm between adjacent lattice fringes, corresponding to the (002) planes in the P2 phase (figure 2(b)). Figure 2(c) shows a SAED pattern of 7-NTMO2 in the [100] direction. It contains only one set of diffraction spots, which can be classified into the P2 structure, thus confirming the XRD results. The elemental assignment (figure 2(d)) from EDX indicates that there is no significant agglomeration or segregation of individual elements or secondary phases. All elements are uniformly distributed on the nanometer level.

Figure 2. Results from the morphological analysis of 7-NTMO2. (a) SEM image, (b) STEM image, (c) SAED pattern along the [100] direction and (d) high-resolution STEM-EDX mapping.
Download figure:
Standard image High-resolution image3.2. Electrochemical characterization
The CVs (0.1 mV s−1 scan rate) of electrodes with 3-NTMO2, 5-NTMO2, and 7-NTMO2 are shown in figure 3. A voltage range between 1.5 V and 4.6 V vs. Na+/Na was applied to observe the evolution of peaks at 4.2 V associated with both phase transition and extraction of Na+ [15, 17, 37]. When charged above 4.2 V, a further decrease in sodium content in the P2 structure leads to an energetically favored misalignment of oxygen atoms along the c-axis, and part of the capacity is attributed to oxygen redox (see the section on DEMS for more details) [13, 38–40]. Therefore, in the first two cycles, the oxidation reaction peaks (anodic sweep) at about 4.3 V shift toward lower potential and show a decrease in intensity.
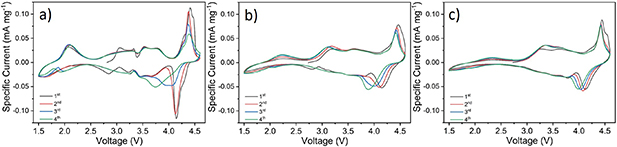
Figure 3. Cyclic voltammograms of (a) 3-NTMO2, (b) 5-NTMO2 and (c) 7-NTMO2 electrodes at a scan rate of 0.1 mV s−1 in the voltage range 1.5–4.6 V.
Download figure:
Standard image High-resolution imageShifts of different strength of the redox peaks above 3.5 V were observed for these three electrode materials. The changes are most pronounced for 3-NTMO2, indicating that the structure of this material changes more strongly upon cycling than for 5-NTMO2 and 7-NTMO2. 3-NTMO2 exhibits intense phase transitions during the initial cycles (see also the section on operando XRD below). In the following cycles, the potential of the reduction reaction (cathodic sweep) decreases to 3.7 V in the fourth cycle. For 5-NTMO2, both the intensity drop and position change of the redox peak at 4.3 V are not as pronounced as for 3-NTMO2, which can be explained by improved structural stability and lower polarization. Compared to 3-NTMO2 and 5-NTMO2, the 7-NTMO2 electrode shows the best reversibility in the high-voltage range (3.8–4.6 V) throughout testing. The reduction of Mn4+ to Mn3+ and the associated Jahn–Teller distortion are most evident for 3-NTMO2 in the low-voltage range (about 2.2 V). This process can induce a phase transition from P2 to P2ʹ (space group Cmcm or C2/n) at high Na+ content, as reported by Benoit et al and Hasa et al [38, 41–43]. This in turn leads to partial dissolution of Mn and a decrease in capacity. As shown in figure 3(a), the intensity and shift (polarization) of the Mnn+ redox reaction peaks gradually increase with continuous cycling of 3-NTMO2, indicating that the corresponding Mnn+ redox contributes to capacity loss [17, 44]. This behavior is less pronounced for 5-NTMO2 (figure 3(b)). For 7-NTMO2 (figure 3(c)), the intensity of the Mnn+ redox peaks barely change during the first four cycles. These results demonstrate the good reversibility of the high-entropy material 7-NTMO2 compared with the other two P2 materials.
Galvanostatic cycling experiments were performed to further investigate the electrochemical performance. For activation, the 1st cycle was performed at a rate of 0.05C. The charge–discharge profiles of the 2nd, 5th, 10th, 20th and 50th cycles at 0.5C in two different potential ranges were analyzed. The electrochemical properties of the electrodes were characterized in a voltage range of 2.6–4.6 V (figure 4) firstly, so that the formation of Mn3+ can be excluded. The 3-NTMO2 delivers a specific discharge capacity of 115 mA h g−1 in the 2nd cycle, which is slightly higher than that of 5-NTMO2 (113 mA h g−1) and 7-NTMO2 (102 mA h g−1), due to a higher content of electrochemically active elements (Co, Ni, and Mn). Normally, distinct plateaus starting at about 4.2 V indicate the occurrence of two-phase reactions (the P2-O2 phase transition) during the charging process (figures 4(a) and (b)) [17, 44–46]. In the case of 7-NTMO2, a smooth charging curve indicates the extraction of sodium ions via solid-solution reaction [16, 21, 30].

Figure 4. Charge–discharge profiles of (a) 3-NTMO2, (b) 5-NTMO2 and (c) 7-NTMO2 electrodes. (d) Capacity retention at 0.5C rate over 50 cycles. (e) Comparison of energy densities (based on the active material) in the 1st, 2nd and 50th cycles. All tests were carried out in the voltage range 2.6–4.6 V.
Download figure:
Standard image High-resolution imageCapacity loss and voltage decay were observed for all three materials, although to different extents. A sharp voltage drop is evident from the charge/discharge profile of 3-NTMO2. The midpoint voltage (MPV) of the discharge drops from 3.72 V at the 2nd cycle to 3.23 V at the 50th cycle. The sharp drop is consistent with the intensity decrease and shift of the reduction peaks to lower potentials in the above-discussed CV data. In contrast, the MPV for 5-NTMO2 and 7-NTMO2 decreases from 3.78 V to 3.51 V and from 3.78 V to 3.67 V, respectively. Therefore, 7-NTMO2 exhibits the best discharge voltage retention.
Figure 4(d) shows the cycling performance of the materials at 0.5C rate. Although a larger initial capacity is achieved, the 3-NTMO2 and 5-NTMO2 electrodes reveal significant fading over the first 15 cycles. Thereafter, the trend toward decreasing capacity is not mitigated for 3-NTMO2, while it is more moderate for 5-NTMO2. In contrast, the 7-NTMO2 electrode exhibits superior cycling stability (see also specific capacities and Coulombic efficiencies with some discussion in figure S2 of the supporting information). Ultimately, at the 50th cycle, 69%, 78% and 86% of the initial capacity was retained for 3-NTMO2, 5-NTMO2, and 7-NTMO2, respectively. The observed voltage drops and capacity losses lead to a degradation in specific energy of the active materials. Translating these capacity values into gravimetric energy densities with a theoretical Na metal anode (figure 4(e)), the second discharge provides specific energies of 423, 420, and 381 W h kg−1 and the 50th cycle results in specific energies of 253, 303, and 314 W h kg−1 for 3-NTMO2, 5-NTMO2, and 7-NTMO2, respectively.
Figure 5 shows the charge–discharge profiles in a voltage range of 1.5–4.6 V. A wider range was chosen to probe the influence of structural rearrangement with Mnn+ redox on the electrochemical performance [17, 47, 48]. Disproportionation reactions of Mn3+ ions can produce soluble Mn2+ ions, leading to a steady loss in active material [17]. After the second cycle, the specific charge capacity was 146, 119, and 113 mA h g−1 for 3-NTMO2, 5-NTMO2, and 7-NTMO2, respectively. The differences in discharge capacities (31, 6, and 11 mA h g−1) are due to the insertion of Na+ ions below 2.6 V, reaching the theoretical Na+ intercalation limit at which the active elements are in a low-valence state. This will be discussed in more detail in the section on XAS. The reduction reaction involving the Mn4+/Mn3+ redox couple occurs at about 2.2 V (highlighted by green boxes in figures 5(a)–(c)) in the discharge process. The slopes are steeper for 5-NTMO2 and 7-NTMO2 than for 3-NTMO2, indicating a lower degree of Mnn+ redox [17, 49]. For 3-NTMO2, the voltage drop and capacity loss are more pronounced than in the narrow potential window (2.6–4.6 V, see figure 4). Although good reversibility is observed between the 20th and the 50th cycles, the strong polarization and performance degradation compared to the first cycles cannot be ignored. These results suggest that the disproportionation of Mn in the discharged state may have a significant impact on the electrode material in the initial cycles [50, 51]. As shown in figure 5(d), a similar trend in terms of capacity degradation can be observed as for the 2.6–4.6 V range. However, after 50 cycles, the cell with 3-NTMO2 is capable of delivering a larger specific capacity (113 mA h g−1) than 5-NTMO2 and 7-NTMO2. This is likely because of the improved discharge capacity caused by the Mn4+/Mn3+ reduction reactions below 2.6 V. Nevertheless, the rapid capacity decay leads to a low capacity retention of 61.9% for 3-NTMO2. In contrast, the 5-NTMO2 and 7-NTMO2 electrodes show a reduced capacity loss with remaining specific capacities of 102 and 104 mA h g−1 after 50 cycles, corresponding to 85.5% and 91.8%, respectively (see also specific capacities and Coulombic efficiencies with some discussion in figure S2 of the supporting information). Accordingly, the specific discharge energy in the second cycle is 477, 411 and 405 W h kg−1 for 3-NTMO2, 5-NTMO2, and 7-NTMO2, respectively, and decreases to 322, 322, and 336 W h kg−1 in the 50th cycle (figure 5(e)). These results show that 7-NTMO2 exhibits a significantly improved cycling performance at higher potentials as well as below 2.6 V due to increased structural stability, thereby proving that the high-entropy concept positively affects the charge-storage properties.
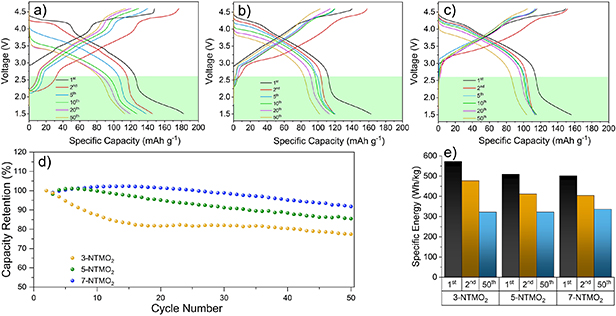
Figure 5. Charge–discharge profiles of (a) 3-NTMO2, (b) 5-NTMO2 and (c) 7-NTMO2 electrodes. (d) Capacity retention at 0.5C rate over 50 cycles. (e) Comparison of energy densities (based on the active material) in the 1st, 2nd and 50th cycles. All tests were carried out in the voltage range 1.5–4.6 V.
Download figure:
Standard image High-resolution image3.3. Operando XRD
The strong capacity degradation observed over the first two cycles can probably be attributed to phase transitions, which were examined by operando XRD. XRD patterns were recorded in a voltage range of 1.5–4.6 V. The corresponding 2D contour plots are shown in figure 6. For 3-NTMO2 (figure 6(a)), the (002) reflection at 12.2° 2θ shifts continuously to lower angles from the open-circuit voltage to about 4.35 V upon charging. Note that the continuous extraction of Na+ ions located between the TM layers leads to a large repulsion of the oxygen anions and therefore to an increase and decrease of the lattice parameters c and a, respectively [17, 49, 52]. This gradual shift indicates a solid-solution reaction during which the change in composition induces a continuous modification of the structural parameters while preserving the symmetry [53]. Beyond 4.35 V, the (002) reflection begins to shift to higher angles (with a maximum of 14.5° 2θ; see figure S3 of the supporting information), accompanied by the formation of a new phase in the voltage range 4.35–4.6 V. This new phase has been defined as the so-called O2 stacking 'Z'-phase, resulting from the sliding of MO2 slabs into an octahedral coordination environment [53–55]. As a result, the migration of TM layers can disrupt the long-range order of the crystal structure. This behavior is consistent with the intense oxidation peak that appears during the first charge at about 4.3 V, as seen by cyclic voltammetry. Moreover, the patterns recorded in the charged state at high potentials show additional new reflections of low intensity between 12.4° and 14.5° 2θ. This indicates the loss of long-range order along the c-axis [53, 56, 57]. Similarly, an O2-type structure with octahedral vacancies in the Na+ layer has been reported for Na2/3(Ni1/3Mn2/3)O2 in a deeply charged state [52, 57]. During the discharge process, there is no rapid shift of the (002) reflection to smaller angles, but the new Z-phase with O2 stacking persists and only gradually returns to the P2 phase after discharging to 3.8 V (reaching the initial position at 3.1 V). With further intercalation of Na+ ions, the (002) reflection shifts to higher angles, which is accompanied by a decrease in the c-axis parameter until the cell is discharged to the cutoff potential of 1.5 V.

Figure 6. Operando XRD contour plots of the first two cycles between 1.5 and 4.6 V for electrodes with (a) 3-NTMO2, (b) 5-NTMO2, and (c) 7-NTMO2. The corresponding charge–discharge curves are shown on the left side.
Download figure:
Standard image High-resolution imageDuring the 2nd cycle, the intensity of the (002) reflection decreases dramatically compared to the region above 4.2 V during the 1st cycle. Nevertheless, the P2 (002) reflection at 12.2° 2θ shifts to higher angles with the presence of the O2 (002) reflection at 13.3° 2θ during the charging process. Moreover, the phase-transition region extends to a wider range from 4.35 V to the charge cutoff voltage and subsequently to 2.14 V, indicating poor reversibility. The appearance of the Z-phase is also observed for 5-NTMO2 when charged to 4.36 V (figure 6(b)), but the shift to higher angles is suppressed (with a maximum of 14.2° 2θ; see figure S3 of the supporting information). During the 2nd cycle, the reflection of the Z phase is still found in the deeply charged state, but the main reflection of the P2 phase remains at its original position. This result indicates that for the 5-NTMO2 electrode, the solid-solution and phase-transition reactions occur simultaneously during the second cycle (not just the phase transition).
In contrast to 3-NTMO2 and 5-NTMO2, the structural evolution of 7-NTMO2 is slightly different when charged above 4.35 V (figure 6(c)). The P2 (002) reflection only shifts marginally to higher angles (with a maximum of 13.1° 2θ; see figure S3 of the supporting information). The continuity of the reflection shift suggests good retention of the crystal structure [37]. A solid-solution reaction mechanism during Na+ ion extraction and intercalation between 1.5 V and 4.6 V has been demonstrated, which is also supported by the CV and galvanostatic cycling data. Accordingly, the 7-NTMO2 sample shows high structural reversibility throughout the Na+ insertion/extraction, as concluded both from the electrochemical properties by comparing voltage and capacity retentions and from the analysis of lattice changes via operando XRD. It is confirmed that the high-entropy approach is an effective strategy to prevent the P2-O2 phase transition and plays an important role in maintaining high specific capacities and mitigating the working potential drop.
3.4. Operando XAS of Co and Ni
The reaction mechanism (charge compensation process) during the initial charge/discharge cycle in a voltage range of 1.5–4.6 V was further studied by operando XAS in transmission mode. XANES spectra collected at the Ni K-edge (8333 eV) and the Co K-edge (7709 eV) are shown in figure 7. Figures 7(a)–(c) shows the Ni K-edge XANES spectra for 3-NTMO2, 5-NTMO2 and 7-NTMO2, respectively. The oxidation state of Ni was determined from the half-height energy position. Comparing the XAS data of the pristine cathode materials to the standard reference NiO, it is found that they contain predominantly Ni2+. During the charging process (until 4.6 V, scan labeled as charged), the edge shifts continuously to higher energies (by about 4 eV), demonstrating the oxidation of Ni2+ to Ni4+. During discharge, the Ni-K edge shows hardly any shift before reaching a potential of about 4 V, followed by the 4 eV shift, thus indicating the fully reversible reduction back to Ni2+. Overall, all three materials show a similar Ni contribution to the electrochemical redox reactions. Similarly, the Co K-edge XANES spectra (figures 7(e)–(f)) reveal the reversible redox reaction of Co3+ (with close energy shift during charge and discharge). Because the electrochemically active Ni and Co contribute to the overall capacity in the same way, the lower capacity achieved with 7-NTMO2 can be attributed to the lower overall fractions of Ni and Co in the material.
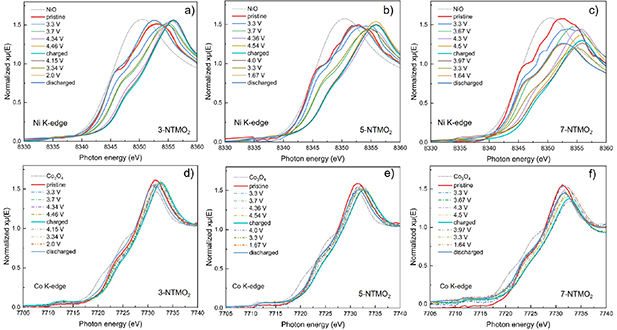
Figure 7. Operando XAS analysis of (a), (d) 3-NTMO2, (b), (e) 5-NTMO2, and (c), (f) 7-NTMO2 electrodes at different states of charge during the first cycle in the voltage range 1.5–4.6 V. (a)–(c) Normalized XANES spectra at the Ni K-edge and (d)–(f) Co K-edge.
Download figure:
Standard image High-resolution image3.5. In situ gas analysis
For an overview of gas evolution in SIBs, the reader is referred to a study by Zhang et al [58]. The gas evolution behavior of the different cathode materials was investigated using DEMS. For this purpose, the cells were cycled at a specific current of 20 mA g−1 in a custom setup for two consecutive cycles. Figures 8 and S4 of the supporting information show the correlation between the voltage profiles and the gas evolution rates for the most evolved gases, hydrogen (H2, m/z = 2) and carbon dioxide (CO2, m/z = 44). The origin of these gases can be inferred from the analogy with gas evolution in LIBs, where CO2 can originate either from chemical oxidation of the electrolyte associated with the release of lattice oxygen or from electrochemical oxidation of the electrolyte (or, mainly during the first cycle, from surface carbonates) [39, 59–62]. Since the released O2 in the case of layered oxide cathode materials for LIBs is apparently highly reactive in nature, it is rarely detected directly as molecular oxygen, but indirectly as the reaction product CO2 [63, 64]. In this work, the same observation is made: while O2 evolution is below the quantitation limit, large amounts of CO2 are clearly produced. H2 is formed by the reduction of trace amounts of water and alcohol at the anode. Its release at high potentials is usually explained by the formation of protic species as byproducts of electrolyte oxidation reactions at the cathode and their subsequent migration to the anode, where they are reduced [65].

Figure 8. Gas evolution characterized by DEMS in the 2nd cycle.
Download figure:
Standard image High-resolution imageIn the first cycle, all three materials show strong gas evolution, see figure S4 of the supporting information. The highest rate of evolution of CO2 was not at the highest potential, as expected, but during the P2-O2 phase transition at the 4.3 V plateau. It should be noted that residual carbonates can often explain much of the gas evolution in the initial cycle [59]. However, no carbonate bands are visible in the Fourier transform infrared spectra of the materials (figure S5 of the supporting information), indicating a carbonate-free surface. A similar pattern is also observed in the H2 evolution rates, suggesting electrolyte oxidation as the cause of gas evolution. Because gas release is irreversible, the dq/dV plots (figure S6 of the supporting information) do not show a corresponding cathodic peak during discharge.
From these results, it can be concluded that at about 4.3 V, significant amounts of lattice oxygen are released during the phase transition, which reacts with the electrolyte, forming CO2 by chemical oxidation. A similar observation has been made for Mn-rich cathode materials for LIBs and confirmed by isotope labeling experiments [66]. As an example, for the P2-type cathode material Na0.78(Li0.25Ni0.75)O2, isotope labeling also confirmed a significant loss of lattice oxygen by electrolyte oxidation to CO2, but at a potential of 5.0 V [67]. As with these materials, the intense gas evolution in the first cycle may indicate the presence of anion redox in the materials studied, which has been reported for several SIB cathode materials [68, 69]. The presence, extent and reversibility of anion redox is beyond the scope of this work and will be investigated in a follow-up study.
At lower potentials toward the end of discharge, additional CO2 evolution, but almost no H2 evolution, is observed (figure S7 of the supporting information). Because two peaks are visible, one after the rapid voltage drop from 3.0 to 2.0 V and another at the end of discharge below 1.8 V, two different mechanisms can be assumed. By applying constant voltage steps, the peaks can be disentangled. The first peak coincides with the Mn4+/3+ redox and Mn disproportionation. The gas evolution can be attributed to the cathode-solid electrolyte interphase and solid electrolyte interphase damage caused by Mn2+ [70]. Continuous CO2 evolution is observed at potentials below 1.7 V, which can most likely be explained by the reduction of FEC at the cathode side, which has already been reported to occur from 1.8 V vs. Li+/Li with CO2 evolution [71]. The observation of increasing steady-state currents at the end of each constant voltage step argues for an electrochemical reaction pathway, e.g. FEC reduction.
The gas evolution at higher potentials during the second cycle is shown in figure 8. A clear difference in behavior between the three materials can be observed here. As the length of the voltage plateau decreases, the gas evolution profiles also change, with 3-NTMO2 having both the most distinct plateau and gas evolution shoulder. In the dq/dV plot (figure S6 of the supporting information), 3-NTMO2 is also the only material that still exhibits an irreversible shoulder at 4.3 V in the second cycle. Figure S8 of the supporting information shows a comparison of the CO2 evolution of all materials during the second charge as a function of the specific charge capacity, and figure S9 of the supporting information displays the CO2 evolution as a function of the voltage. However, due to the steep profiles between 3.8 V and 4.2 V, the initial voltage of the gas evolution cannot be accurately determined. Here, an exponential trend is observed [33]. Previously, it was shown that significant electrochemical oxidation of the electrolyte in LIBs only occurs above 5.0 V vs. Li+/Li, corresponding to 4.67 V vs. Na+/Na [39]. From the observed onset of gas evolution already around 4.0 V and the clear shoulder peak in the H2 evolution of 3-NTMO2 (see figures 8 and S4 of the supporting information), it can be concluded that mainly chemical oxidation takes place, caused by the irreversible loss of lattice oxygen [66].
Table S3 of the supporting information summarizes the specific capacities and total amounts of gases released for all three materials. It can be concluded that increased CO2 evolution due to enhanced release of lattice oxygen explains, at least in part, the higher irreversible capacity and lower capacity retention during long-term cycling (figure 5(d)) of 3-NTMO2 compared to both 5-NTMO2 and 7-NTMO2. While the release of lattice oxygen depends on the degree of desodiation, and therefore on the specific charge capacity, the difference in gas evolution is not observed at the end of charge, but when the plateau is reached around 4.3 V. At the same time, the main difference in specific charge capacity is due to charging at low potentials between 1.5 V and 2.6 V.
In summary, DEMS analysis shows that the gas evolution behavior changes with increasing configurational entropy and the total amount of evolved gas is reduced. Since the lattice oxygen is the major source of O2, increasing the configurational entropy reduces the detrimental release of lattice oxygen, partially explaining the better material performance.
3.6. Ex situ XRD
To further investigate the structural evolution during long-term cycling and verify the superior structural stability of 7-NTMO2, ex situ XRD measurements were performed prior to cycling and after the 50th cycle in the discharged state (figure S10 of the supporting information). The main reflections of the cathode materials can still be assigned to the P2 structure. However, different degrees of degradation are evident from the data. For 3-NTMO2, the XRD pattern shows a strong shift of the (002) and (004) reflections to lower angles. The increased c-axis lattice parameter indicates irreversible expansion of the material along the direction perpendicular to the plane of the Na+ layers, thus suggesting incomplete sodiation [57, 72, 73]. Note that incomplete sodiation as a result of deteriorated diffusion kinetics could be due to the TM dissolution, leading to a change in chemical environment of the oxygen atoms. In comparison, the reflection shifts are much less pronounced for 5-NTMO2, while the 7-NTMO2 electrode shows the best structural stability after 50 cycles. Moreover, the full-width at half maximum of the (002) and (004) reflections of 3-NTMO2 increased more strongly than for 5-NTMO2 and 7-NTMO2. This increase is indicative of a decrease in crystallinity of the material during cycling, which is often associated with the loss of Na+ intercalation sites and structural irreversibilities [72, 74].
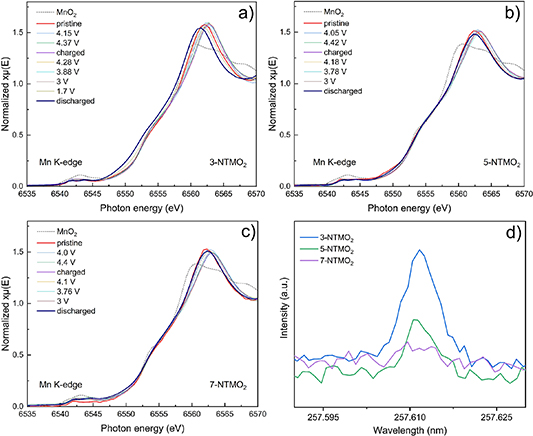
3.7. Operando XAS and ICP-OES analysis of Mn
As described above, the Mnn+ redox for the larger voltage range (1.5–4.6 V) leads to unfavorable Mn dissolution and consequently to a decrease in capacity. The changes in oxidation state of Mn during cycling were also investigated by operando XAS. Figures 9(a)–(c) shows the normalized Mn K-edge (6539 eV) XANES spectra during the initial charge/discharge cycle for electrodes with 3-NTMO2, 5-NTMO2, and 7-NTMO2, respectively. Compared to the standard reference MnO2, Mn is mainly in +4 state in all three cathode materials in the pristine state. This is consistent with the XPS results shown in figure S11 of the supporting information. The pristine materials show a peak doublet at 642.6 eV (Mn 2p3/2) and 654.3 eV (Mn 2p1/2), which can be attributed to Mn4+. For 3-NTMO2, a clear shift of the Mn edge toward lower energy is observed after the first discharge cycle, demonstrating the overall decrease in Mn oxidation state (presence of Mn3+) compared to the pristine state. In contrast, there is no perceptible change in the XANES spectra of 5-NTMO2 and 7-NTMO2.
Figure 9. Operando XAS spectra collected at the Mn K-edge during the first cycle between 1.5 and 4.6 V for (a) 3-NTMO2, (b) 5-NTMO2, and (c) 7-NTMO2. (d) Comparison of Mn dissolution into the electrolyte from ICP-OES.
Download figure:
Standard image High-resolution image
Finally, ICP-OES was used to quantify the degree of Mn dissolution into the electrolyte. After 50 cycles between 1.5 and 4.6 V, the electrolyte was harvested from the coin cells. The data in figure 9(d) show that Mn dissolution decreases progressively from 3-NTMO2 to 7-NTMO2, i.e. with increasing configurational entropy. It is worth mentioning that the ICP-OES data agree with the XPS results for the oxidation state of Mn after 50 cycles. Taken together, it seems that the stronger Mn dissolution is a contributing factor to the poorer cycling stability of 3-NTMO2. In addition, the results confirm that 7-NTMO2 with the highest configurational entropy exhibits greatly improved structural stability.
4. Conclusions
Three different layered P2-type oxides, denoted as low-, medium- and high-entropy oxides, were successfully synthesized via solid-state reaction and investigated as cathode materials for SIBs. The high-entropy 7-NTMO2 was found to exhibit superior reversibility during sodiation/desodiation in the potential ranges of 2.6–4.6 V and 1.5–4.6 V. In contrast, rapid capacity fading was observed in the case of low-entropy 3-NTMO2 and moderate decay for the medium-entropy 5-NTMO2. By combining operando and ex situ XRD, it was found that all materials tend to undergo a solid-solution reaction after several cycles, accompanied by a weakening of the P2 → O2 phase transition. The high configurational entropy is beneficial to mitigate the phase transition and maintain structural stability. Furthermore, DEMS analysis showed a decrease in gas release with increasing configurational entropy. At the same time, the Mn disproportionation at low potentials, leading to the formation of soluble Mn2+, was suppressed in 7-NTMO2, as demonstrated by XPS and XAS and confirmed by ICP-OES. As the contribution of the high-entropy effect to the cycling performance attracts increasing attention, we provide here further compelling and encouraging evidence for the potential of high-entropy materials for electrochemical energy-storage applications.
Acknowledgments
J W, K W, Z D and B Z acknowledge financial support from the China Scholarship Council (CSC). G K and M F gratefully acknowledge financial support by Deutsche Forschungsgemeinschaft (DFG, German Research Foundation) under Germany's Excellence Strategy, EXC 2154, project number 390874152. A O acknowledges financial support from the Federal Ministry of Education and Research (Bundesministerium für Bildung und Forschung, BMBF) under the project 'KaSiLi' (03XP0254D) in the competence cluster 'ExcellBattMat'. H H, B B and T B acknowledge financial support from the Helmholtz Association (DigiBat project). Financial support by the German Research Foundation (to H H, Grant No. HA 1344/43-1) is gratefully acknowledged. Q W and B B acknowledge the support from EnABLES and EPISTORE, projects funded by the European Union's Horizon 2020 research and innovation program under Grant Agreement No. 730957 and 101017709, respectively. B B also acknowledges funding from the Kera-Solar project (Carl Zeiss Foundation). Beamtime allocation and support at beamline P65 of the PETRA III synchrotron (Deutsches Elektronen-Synchrotron DESY, Hamburg, Germany) is gratefully acknowledged. The INM authors thank Eduard Arzt (INM) for his continuing support. The authors acknowledge Andrea Jung (INM) for her support on ICP-OES measurements. The authors further acknowledge the support from the Karlsruhe Nano Micro Facility (KNMF, www.knmf.kit.edu), a Helmholtz research infrastructure at Karlsruhe Institute of Technology (KIT, www.kit.du).
Conflict of interest
There are no conflicts to declare.
Author contributions
J W, B B and Q W conceived the idea and designed the experiments. B B, H H and Q W supervised the project. S L D and T B conducted the DEMS measurements and analysed the data. K W and Z D performed the TEM measurements and analysed the data. T D, G K and M F collected the XPS spectra and analyzed the data. A S and Y M provided valuable suggestions during the whole project. B Z, M V G, A O and D M helped with the XAS measurements and analyzed the data. V P helped with the ICP-OES measurements. J W, B B and Q W prepared the initial manuscript. All authors discussed the results and contributed to discussion and reviewing the manuscript.
Supplementary data (2.1 MB DOCX)