

Abstract
We report the synthesis of ordered mesoporous ceria (mCeO2) with highly crystallinity and thermal stability using hybrid polymer templates consisting of organosilanes. Those organosilane-containing polymers can convert into silica-like nanostructures that further serve as thermally stable and mechanically strong templates to prevent the collapse of mesoporous frameworks during thermal-induced crystallization. Using a simple evaporation-induced self-assembly process, control of the interaction between templates and metal precursors allows the co-self-assembly of polymer micelles and Ce3+ ions to form uniform porous structures. The porosity is well-retained after calcination up to 900 °C. After the thermal engineering at 700 °C for 12 h (mCeO2-700-12 h), mCeO2 still has a specific surface area of 96 m2 g−1 with a pore size of 14 nm. mCeO2 is demonstrated to be active for electrochemical oxidation of sulfite. mCeO2-700-12 h with a perfect balance of crystallinity and porosity shows the fastest intrinsic activity that is about 84 times more active than bulk CeO2 and 5 times more active than mCeO2 that has a lower crystallinity.
Export citation and abstract BibTeX RIS

Original content from this work may be used under the terms of the Creative Commons Attribution 4.0 license. Any further distribution of this work must maintain attribution to the author(s) and the title of the work, journal citation and DOI.
Future perspectives
Crystalline mesoporous oxides with large specific surface area and pores accessibilities are promising materials for industrial applications, including energy storage, catalysis etc. The key challenge of synthesizing crystalline mesoporous oxides is balancing the porosity and crystallinity because of the overgrowth of crystalline domains from the high-temperature annealing process. Filling with the inorganic precursor, hard templates like silica and carbon can be used synthesize target oxides. However, this suffers from low efficiency and high cost. On the other hand, soft templating methods are developed through a self-assembly process between metal precursors and organic templates. Unfortunately, soft organic templates are not thermally stable enough to confine the crystallization of oxides during high-temperature annealing under air. As a perspective of our study, the focus on the design of hybrid templates with high thermal stability that are mechanically strong and thermally stable enough to prevent the collapse of porous frameworks during high-temperature annealing, is highly desired.
1. Introduction
Crystalline mesoporous oxides with interesting redox and electronic properties have been broadly used in various applications in catalysis [1–5] and energy storage [6–9], given the large surface area and accessible pores in mesoscale (2–50 nm). In many cases, the crystallinity and crystalline phases of those mesoporous oxides are critical to their applications [10–14]. Taking mesoporous TiO2 as an example, TiO2 with the mixed phases of anatase and rutile can promote the charge separation at the two crystalline phases upon photoexcitation that enhances the overall photocatalytic performance [15, 16]. Synthesis of crystalline mesoporous oxides usually relies on high-temperature annealing to crystallize the framework of mesoporous oxides [17–21]. The key challenge of such an annealing process is to balance the porosity and crystallinity because the overgrowth of crystalline domains can cause the collapse of frameworks and elimination of the porosity [3, 22–25]. A common solution is the use of hard templates such as mesoporous silica and carbon [26–31]. Those hard templates, that are mesoporous to start with, can be filled with the precursor to grow the targeted oxides and subsequently removed after the formation of pores [21, 32–36]. Although the hard-templating approach provides a versatile tool applicable to a number of oxides, it often suffers from low efficiency and high cost as pointed out in literature [17].
Numerous efforts have been devoted to synthesizing crystalline mesoporous oxides through soft-templating method where the metal precursor and organic templates (e.g. polymers and surfactants) can self-assemble into ordered liquid crystalline forms in the sol–gel conversion [37–42]. Although soft organic templates are not thermally stable enough to confine the crystallization of oxides, previous studies suggest that conversion of those organic templates to inorganics, e.g. carbon [39, 43], can resolve the stability challenges to grow mesoporous oxides at high temperature. Soft-templating synthesis is advantageous because the pore size and the wall thickness of porous oxides are readily controllable, as compared to the hard-templating method. On the other hand, our group has developed the use of hybrid polymer templates to overcome the poor thermal stability of organic polymers. The method is simply based on the design of organosilane-containing block copolymers (BCPs), poly(ethylene oxide)-block-poly[3-(trimethoxysilyl)propyl methacrylate] (PEO-b-PTMSPMA) [44–50]. The PTMSPMA block consists of trimethoxysilyl moieties that can hydrolyze to form polysilsesquioxane and further thermally convert to inorganic silica-like structures [51, 52]. Very similar to soft-templating synthesis, the BCP PEO-b-PTMSPMA can assemble with metal precursors along with the sol–gel conversion during evaporation-induced self-assembly (EISA) [50]. At elevated temperature, the PEO block will decompose and the residual silica from the PTMSPMA block serves as 'hard' templates to grow crystalline oxides. Those organosilane-containing polymer templates combine the advantages of soft- and hard-templating syntheses to tune the porosity within crystalline oxide frameworks. Without the use of any inert gas atmosphere, our templates allow the thermal engineering to improve the crystallinity of porous frameworks up to 1000 °C in air. We have demonstrated the use of hybrid polymer templates to grow a few crystalline mesoporous oxides, e.g. TiO2 [45, 50] and titanates [44]. While the interaction of Ti4+ ions and PEO has been well-understood, the synthetic strategy has been largely limited to Ti-containing crystalline oxides.
We herein report the facile synthesis of crystalline mesoporous ceria (mCeO2) using hybrid polymer templates of PEO114-b-PTMSPMA224. Ceria has been a fundamentally important oxide used in a broad range of catalysis mostly as a support for metal catalysts [53–58]. The synthesis of mesoporous ceria, however, has been limited to the hard-templating approach only [59–62]. In the current synthesis, the delicate interaction of PEO and Ce3+ ions can be controlled by solvent composition of water and ethanol. By weakening interaction of PEO and Ce3+ ions, we show the co-self-assembly of hybrid polymer templates and Ce3+ ions during EISA. Those hybrid polymer templates can stabilize the porous frameworks of mCeO2 while crystallizing at 900 °C. A similar synthetic strategy can be extended to mesoporous Co3O4. We further demonstrate crystallinity-dependent catalytic activity of mCeO2 using electrochemical oxidation of sulfite.
2. Experimental section
2.1. Materials
Monomethoxy poly(ethylene oxide) (PEO114-OH, 5000 g mol−1), N, N'-dicyclohexylcarbodiimide, N, N, N', N'', N''-pentamethyldiethylenetriamine (PMDETA), dimethylamino pyridine, 2-bromoisobutyryl bromide, copper(I) bromide (CuBr), 3-(trimethoxysilyl)-propyl methacrylate (TMSPMA), anisole, dichloromethane (CH2Cl2), hexane, and ethanol were purchased from Sigma-Aldrich and used without further purification unless otherwise noted. Cerium nitrate hexahydrate (Ce(NO3)3 6H2O) purchased from Alfa Aesar was used as received. Deionized water (high-Q, Inc. 103S Stills) with a resistivity of >10.0 MΩ was used in all experiments.
2.2. Synthesis of hybrid polymer templates and mCeO2
2.2.1. Synthesis of PEO114-b-PTMSPMA224.
The amphiphilic BCP of PEO114-b-PTMSPMA224 was synthesized via atom transfer radical polymerization. Bromine-terminated PEO114 (PEO114-Br) as the macroinitiator was synthesized from PEO114-OH using our previously reported method [51]. In a typical synthesis of PEO114-b-PTMSPMA224, 2 g of PEO114-Br (0.4 mmol), 20 g of TMSPMA (80.6 mmol), 116 mg of CuBr (0.8 mmol), and 0.334 ml of PMDETA (1.6 mmol) were dissolved in anisole (16 ml) in a 50 ml round bottom flask. Then, the reaction mixture was proceeded with freeze-pump-thaw cycles three times to remove oxygen and it was recharged with nitrogen at the end. The reaction mixture was placed in an oil bath pre-heated at 65 °C for 1.5 h. After polymerization, the reaction was cooled and diluted by using CH2Cl2. The reaction mixture was then passed a short column of silica gel to remove Cu catalysts. The BCP was precipitated with hexane three times and dried under vacuum. The molecular weight was determined using proton nuclear magnetic resonance (1H NMR) using PEO114 as an internal standard. The number of repeating units of PTMSPMA was calculated to be 224 with a molecular weight of 60.7 kg mol−1, denoted as PEO114-b-PTMSPMA224. Using gel permeation chromatography (GPC) calibrated by polystyrene standards, molecular weight and the polydispersity was measured to be 10.3 kg mol−1 and 1.26, respectively.
2.2.2. Self-assembly of PEO114-b-PTMSPMA224 to prepare colloidal templates.
Self-assembly of PEO114-b-PTMSPMA224 was carried out in the mixture of ethanol and water. Briefly, 1.5 g of PEO114-b-PTMSPMA224 was firstly dissolved into 45 ml of ethanol. The solution was stirred for 3 h at room temperature to obtain a uniform solution. Subsequently, 55 ml of water was slowly added into the above ethanol solution using an addition funnel over 2 h. Water as a non-solvent for the PTMSPMA block triggered the self-assembly of PEO114-b-PTMSPMA224, i.e. polymer micelles with PEO coronas and PTMSPMA cores. To cross-link those micelles, 1 ml of triethylamine was added into the mixture and the solution was stirred for 24 h to hydrolyze of trimethoxysilyl moieties. The micellar solution was further dialyzed against ethanol. The final micellar solution was further diluted to 15 mg ml−1 with ethanol prior to use.
2.2.3. Preparation of mCeO2.
mCeO2 was synthesized by using the EISA method and polymer micelles as templates. In the typical synthesis process, 4 ml of Ce(NO3)3 solution (50 mM in ethanol) was mixed with 8 ml of polymer micelles (15 mg ml−1 in ethanol). After adding 2 ml of water, the solution was stirred for another 1 h in the hood. The transparent solution showed lightly yellowish color and keep constant during stirring process. The solution mixture was homogenous and then transferred into a petri dish. The solution was dried at 40 °C overnight and then annealed at 100 °C for 24 h to completely remove solvents. The gel was further calcinated at 400 °C, 500 °C, 600 °C, 700 °C, 800 °C and 900 °C for 4 h with a ramp rate of 2 °C min−1to grow the highly crystalline CeO2. To evaluate the annealing time, we also calcined the samples at 700 °C up to 48 h, to improve the crystallinity of CeO2. After calcination, all samples were washed with 2 M NaOH (55 °C) for 2 h to remove residual silica, followed by water and ethanol twice. All samples were dried at 60 °C in vacuum to form mesoporous materials showing light yellow color, photograph is given in figure S1. Those samples were labeled as mCeO2-X, where X represents the annealing temperature.
2.3. Characterization
Scanning electrode microscopy (SEM) for all mesoporous materials was recorded using a FEI Nova NanoSEM 450. High-resolution transmission electron microscopy (HR-TEM) was performed on a JEOL 2010 TEM with an accelerating voltage at 200 kV. All TEM samples were prepared via casting the ethanol containing suspension of fine-grinded samples on a carbon coated copper grid with 300 mesh. The patterns of wide-angle x-ray diffraction (XRD) were recorded on a Rigaku Ultima IV diffractor at 40 kV, 44 mA with radiation of Cu Kα with a wavelength of 1.5406 Å. The Brunauer–Emmett–Teller (BET) surface area of mCeO2 was measured on an Anton Paar Chemisorption and Physisorption Gas Sorption Analyzer system under nitrogen. The pore size and its distribution were analyzed using the Barrett–Joyner–Halenda (BJH) method. GPC measurements were performed on a Waters GPC-1 (1515 HPLC Pump and Waters 717Plus Autoinjector) equipped with a Varian 380-LC evaporative light scattering detector, a Waters 2487 dual absorbance detector and three Jordi Gel fluorinated divinylbenzene (DVB) columns (1 K–100 K, 2 K–10 K and 1–500 Å). X-ray photoelectron spectroscopy (XPS) results were collected on a ThermoFisher K-Alpha XPS spectrometer with an Al Kα source, pass energy of 25 eV and step size of 0.1 eV. Tetrahydrofuran (THF) was used as elution solvent and polystyrene standards used for molecular weight and Mw distribution calibrations. 1H NMR spectra were recorded by using a Bruker Avance 400 MHz spectrometer.
2.4. Electrochemical measurements
The CH Instrument 627E electrochemical workstation with a standard three-electrode cell was used for all catalytic reactions. A graphitic carbon rod was the counter and calomel electrode (SCE) (saturated with KCl) was the reference electrodes. A pyrolytic graphite (PG) electrode coated with catalyst ink was used as a working electrode. To make the catalysts ink, mCeO2 (5 mg) was dispersed in 1.5 ml mixture of water and ethanol with a volume ratio 4 to 1 and containing 5 wt% Nafion. The ink was sonicated after mixing for 30 min to get a uniform solution. About 10 µl of this ink was drop-cast onto the PG electrode and dried in air overnight at room temperature before electrochemical testing. Linear sweep voltammetry (LSV) scans were iR-compensated and recorded at scan rate of 10 mV s−1 in 0.5 M PBS buffer containing sodium sulfite. Electrochemical impedance spectroscopy (EIS) was done at frequencies from 100 to 0.01 kHz and 5 mV AC voltage amplitude at potential of 1 V vs the reversible hydrogen electrode (RHE). The reported potential was converted to RHE for all tests using the Nernst Equation: ERHE = ESCE + 0.0591 × pH + 0.244.
3. Results and discussion
Synthesis of mCeO2 was templated by polymer micelles of PEO114- b-PTMSPMA224 according to our previous reports [50, 51]. Polymer micelles of PEO114-b-PTMSPMA224 were first prepared by self-assembly in the water/ethanol mixture. The PTMSPMA core could be further hydrolyzed in the presence of trimethylamine to form silica-like NPs. The diameter of polymer micelles is 22.3 ± 3.2 nm (scheme 1). The solution of polymer micelles was further dialyzed against ethanol to remove residual triethylamine and water. The preparation of mCeO2 was carried out in ethanol/water mixture through EISA where the coordination of PEO and Ce3+ ions led to the formation of gel. The ethanol/water mixture was used to tune the interaction strength between PEO and Ce3+ ions. In pure ethanol solution, PEO and Ce3+ ions interacted strongly where the addition of Ce(NO3)3 to the micellar solution resulted in precipitation of micelles. In pure water, PEO and Ce3+ ions interacted weakly. The mixing of Ce(NO3)3 and the micellar solution did not result in any apparent change in solution transmittance. We varied the concentration of water in the mixture, as a means to increase the solvation of Ce3+ ions and decrease the interaction of PEO and solvated Ce3+ ions (see below), so that a homogeneous solution of Ce(NO3)3 and the micellar solution was formed initially. The slow removal of solvents would allow the self-assembly of polymer micelles and the Ce salt. After drying at 40 °C overnight, the sol of Ce(NO3)3 and the micellar solution formed a homogeneous lightly-yellow gel. The gel was collected and calcined at elevated temperatures to crystallize CeO2. After thermal annealing, the residual silica was etched by hot NaOH to expose the pores and yield the yellow powder as CeO2 (figure S1). We denoted our mesoporous CeO2 as mCeO2-X where X represents the calcination temperature.
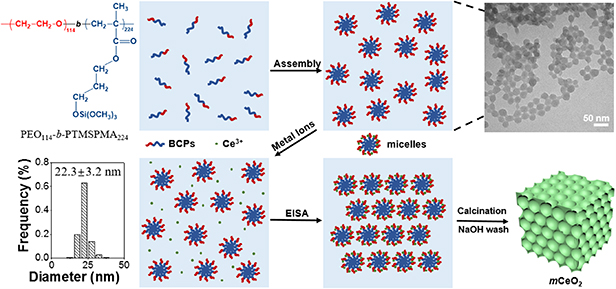
Scheme 1. Preparation of mCeO2 using EISA. The TEM image shows polymer micelles of PEO114-b-PTMSPMA224 after hydrolysis of trimethoxysilyl moieties in the presence of triethylamine (TEA). The average diameter of polymer micelles is 22.3 ± 3.2 nm.
Download figure:
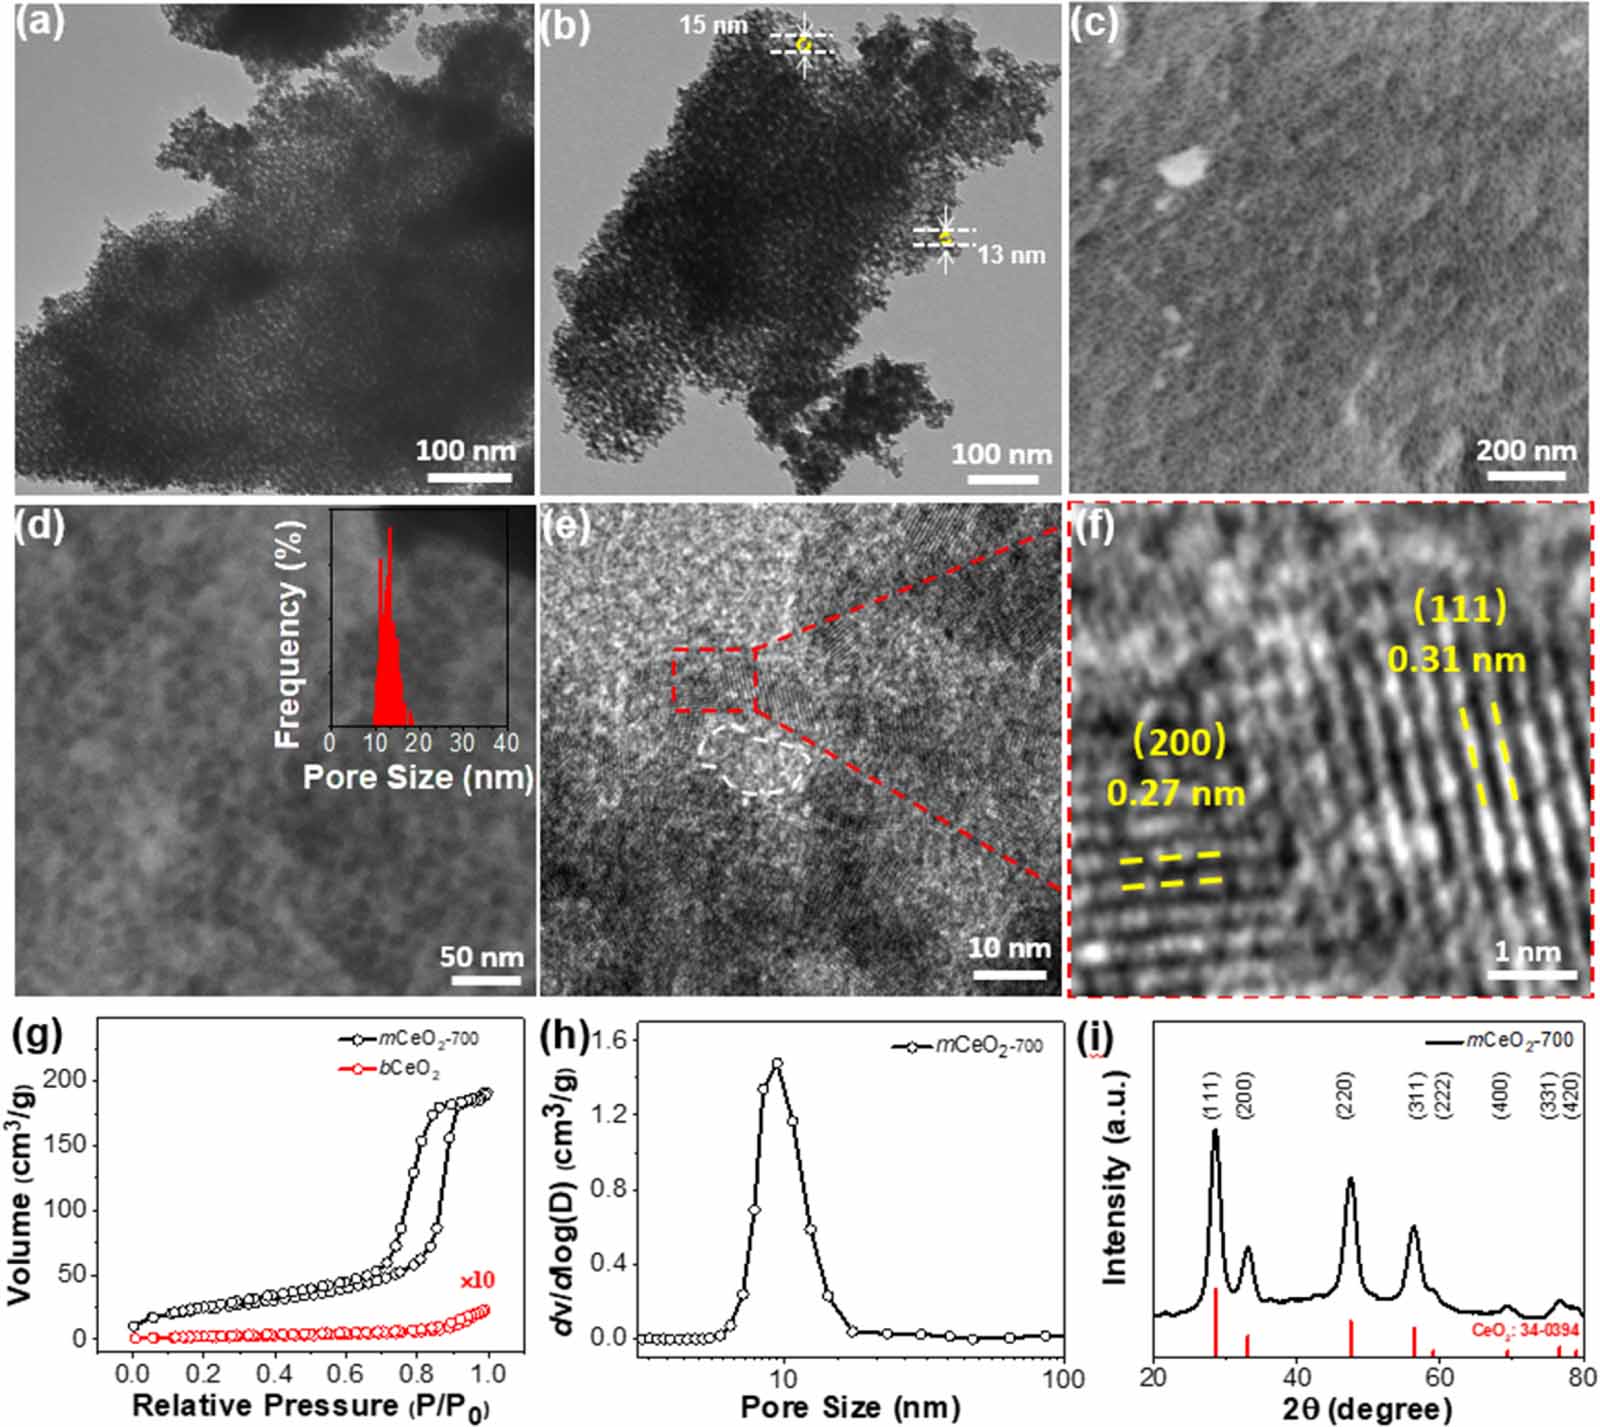
Standard image High-resolution imageUsing mCeO2-700 as an example, 90 mg of Ce(NO3)3 (50 mM in ethanol) was mixed with 8 ml of polymer micelles (15 mg ml−1 in ethanol). After adding 2 ml of water, the solution became transparent. The homogeneous solution was kept stirring at room temperature for 1 h and then transferred to a petri dish to remove solvents. The dried gel was further annealed at 100 °C for 24 h and ramped to 700 °C at a heating rate of 2 °C min−1 under air. After calcination for 4 h, the samples were washed with 2 M NaOH (55 °C) to remove residual silica. The crystalline porous frameworks of mCeO2-700 were first revealed by electron microscopy (figure 1). Figure 1(a) shows a low-resolution TEM image of mCeO2-700. Highly porous and ordered mesoporous structures were seen throughout the large piece of crystals. The pores could be seen under zoom-in TEM images in figure 1(b) and the size of pore is in the range of 10–20 nm with the typical measurement results in the image. SEM confirms the porous structures on the surface of bulky pieces (figures 1(c) and (d)). The pore size analyzed from has a narrow distribution with an average pore size of 13.0 ± 1.6 nm, in consistence with TEM observation. The size of pores was obviously smaller than the size of polymer micelles. This is due to the shrinkage induced by high temperature as reported previously [50, 63–66]. The highly crystalline framework was confirmed using HR-TEM. Figures 1(e) and (f) displays the porous structure and clear lattice fringes of CeO2. The d-spacings of 0.31 nm and 0.27 nm were assigned to (111) and (200) lattice planes of CeO2, respectively. The crystalline nature of the frameworks was also confirmed using XRD (figure 1(i)). Only cubic fluorite type CeO2-phase was seen without other impurities (JCPDS no. 34–0394). The crystalline grain size estimated from Scherrer equation is 5.6 nm. The yellow mCeO2-700 has a light-yellow color with its optical bandgap of 3.1 eV as measured from diffusion reflectance UV–vis spectroscopy [67] (figure S2).

Figure 1. Structural characterization of mCeO2. (a), (b) TEM images and (c), (d) SEM images of mCeO2-700. The inset in d shows the corresponding pore size distribution. (e), (f) HR-TEM images of mCeO2-700. (g), (h) BET N2 sorption isotherms of mCeO2-700 and bulk CeO2 with pore size distribution (h). (i) XRD pattern of mCeO2-700.
Download figure:
Standard image High-resolution imageThe porosity was confirmed using nitrogen sorption experiments by BET analysis. The sorption isotherm shows a characteristic type-IV hysteresis loop. The specific surface area of mCeO2-700 is 84.4 m2 g−1 (figure 1(g)). The pore size analyzed from BJH method is 14.0 nm, close to that measured from electron microscopy. As a control, we prepared bulk CeO2 in the absence of polymer templates using a similar procedure. Bulk CeO2 does not show significant nitrogen sorption with a low surface area of 2.6 m2 g−1 (figure S3).
The key parameter to control the synthesis of mCeO2 is the solvent ratio to tune the interaction of Ce3+ ions and polymer micelles. Unlike previous synthesis of TiO2 [50] and WO3 [25], Ce3+ ions show strong binding with PEO in ethanol. As controls, we examined the mixing of Ce(NO3)3 and polymer micelles in water/ethanol mixture with different ratios. The solution turbidity as measured by the transmission of the solution had an obvious dependence on water concentration. In the absence of water, the solution was completely turbid with its transmission <3% at 600 nm measured from UV–vis (figures S4(a) and (b)). The addition of water resulted in the decrease of turbidity. At ∼5 vol% of water, the solution became completely transparent. While, the solution kept turbid diluted by ethanol as control (figures S4(c) and (d)). As for EISA, we dried the sol with different water concentrations. Homogeneous gels were observed with a water concentration in the range of 10 vol% to 20 vol%. In additional, the use of PEO114-b-PTMSPMA224 is of critical importance to preserve the pores of mCeO2 at high temperature under air [44, 50]. Other soft templates like poly(ethylene oxide)-block-polystyrene do not provide similar thermal stability under air [68–70]. We can further extend our synthetic method to synthesize other transition metal oxides, like Co3O4 (figure S5), challenging to synthesize using the traditional EISA [71].
As enabled by the thermal stability of polymer templates, we further examined the structural and crystalline evolution of mCeO2 in the calcination temperature range of 400 °C–900 °C for 4 h (see figure S6). Figure 2 shows the typical SEM and BET results of mCeO2 obtained at 400 °C (figures 2(a) and (b)), 600 °C (figures 2(c) and (d)), and 900 °C (figures 2(e) and (f)). All mCeO2 shows remarkable thermal stability. The porous frameworks retained their structural integrity even after calcined at 900 °C. Below 800 °C, the pores were well-preserved and the average size of pores was in the range of 10–15 nm as estimated from SEM (table 1). Disordered pores with a larger polydispersity were seen for mCeO2-900. This was likely because of the thermal shrinkage of the framework at a higher calcination temperature. Nevertheless, all samples show typical type-IV isotherm with a characteristic hysteresis loop (figure 2). The pore size of mCeO2 from BET is also in the range of 10–14 nm when the calcination temperature is below 800 °C. There is a slightly decrease of pore size for mCeO2-900 to 6 nm along with the decrease of surface area. This is likely due to the overgrowth of CeO2 crystallites at high temperatures [72–74].
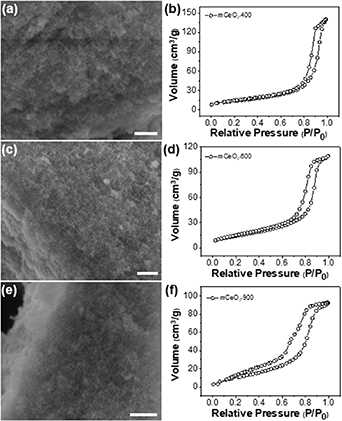
Figure 2. Porous structural information of mCeO2 calcined at various temperatures. SEM images of mCeO2 calcinated at 400 °C (a), 600 °C (c), and 900 °C (e), respectively. N2 sorption isotherms of mCeO2 calcinated at 400 °C (b), 600 °C (d), and 900 °C (f), respectively. All scale bars are 200 nm.
Download figure:
Standard image High-resolution imageTable 1. The summary of crystalline size, BET surface area, total pore volume and pore size for all catalysts.
| Sample ID. | Annealing Temperature (oC) | Annealing Time (h) | XRD crystalline size (nm)a | BET surface area (m2 g−1)b | Total pore volume (cm3 g−1)c | Pore size (nm) from BETc | Pore size (nm) from SEM |
|---|---|---|---|---|---|---|---|
| mCeO2-400-4 h | 400 | 4 | 4.5 | 53.2 | 0.14 | 10.2 | 13.4 |
| mCeO2-500-4 h | 500 | 4 | 4.8 | 49.9 | 0.13 | 10.1 | 14.5 |
| mCeO2-600-4 h | 600 | 4 | 5.3 | 52.8 | 0.18 | 11.4 | 13.3 |
| mCeO2-700-4 h | 700 | 4 | 5.6 | 84.4 | 0.31 | 14.0 | 13.0 |
| mCeO2-800-4 h | 800 | 4 | 7.9 | 65.1 | 0.21 | 11.3 | 10.9 |
| mCeO2-900-4 h | 900 | 4 | 12.2 | 45.1 | 0.16 | 6.0 | – |
| mCeO2-700-1 h | 700 | 1 | 5.0 | 73.1 | 0.14 | 7.6 | – |
| mCeO2-700-12 h | 700 | 12 | 6.6 | 96.2 | 0.34 | 14.2 | 13.8 |
| mCeO2-700-24 h | 700 | 24 | 6.1 | 87.2 | 0.26 | 11.7 | 11.6 |
| mCeO2-700-48 h | 700 | 48 | 6.1 | 63.4 | 0.18 | 11.8 | 11.9 |
aScherrer's crystallinity size. bSurface area obtained from Brunauer–Emmett–Teller (BET) measurement. cBJH desorption pore volume and pore size distribution.
The crystallinity of mCeO2 was characterized using XRD. Figure 3(a) show the XRD patterns of mCeO2 obtained at different calcination temperature. The diffraction peaks at 28.6°, 33.1°, 47.5°, 56.3°, 59.1 , 69.4°,76.7° and 79.1° are assigned to the (111), (200), (220), (311), (222), (400), (331) and (420) facets of cubic fluorite structured CeO2, respectively. With the increase of calcination temperature, there is no new peak, indicating the stable phase of cubic fluorite-type CeO2 without phase transition during thermal annealing. The elevation of the calcination temperatures had a significant impact on the XRD peak broadness. At lower temperature, broad diffraction peaks were seen and no clear peaks were observed for high-indexes facets. While, the peaks became shaper above 600 °C. This is indicative of improved crystallinity of mCeO2 frameworks. Qualitatively, the crystalline grain size calculated from Scherrer equation shows an obvious increase from 4.5 nm for mCeO2-400 to 12.2 nm for mCeO2-900 (figure 3(b)). The diffraction peaks at 69.4°, 76.7° and 79.1° became more pronounced when the calcination temperature above 800 °C, as crystalline domain grew larger. This is similar to our previous observation on TiO2. Polymer templates of PEO114-b-PTMSPMA224 were thermally converted to inorganic silica nanoparticles that are mechanically strong to prevent the overgrowth of CeO2 crystallites on the frameworks [75]. While the temperature raised beyond the glass transition of silica, the sintering of silica templates would result in the collapse of pores [76].
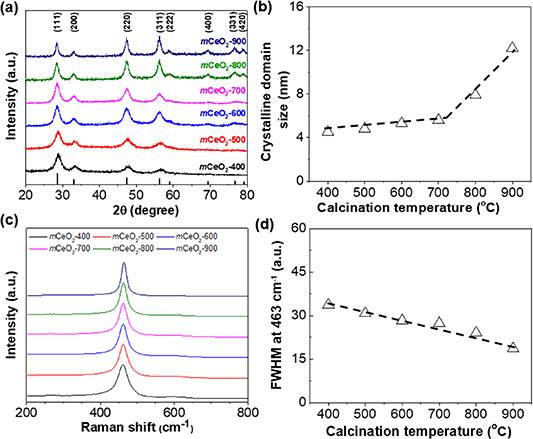
Figure 3. Crystallinity of mCeO2 calcined at different temperatures: (a) XRD patterns and (c) Raman scattering patterns. (b) Crystalline grain size calculated from Scherrer equation using the peak at 47.5° and (d) plotting peak half width at 463 cm−1 against calcination temperature.
Download figure:
Standard image High-resolution imageThe change in crystallinity of mCeO2 at different calcination temperature was also confirmed by Raman scattering. Polycrystalline ceria shows a very pronounced Raman scattering peak at 463 cm−1 assigning to the F2g band. Previous studies suggested that the peak shift and linewidth of the F2g band were dependent on the crystallinity and crystalline grain size [77, 78]. Increasing calcination temperature sharps the F2g band of ceria [79]. The peak half width at 463 cm−1 is plotted as a function of temperature in figure 3(d) where a nearly linear correlation was found. Those results suggest the improved crystallinity of mCeO2 at higher calcination temperature. Note that, there is a slightly blue shift of the F2g band to 464 cm−1, likely due to the formation of oxygen vacancies as a result of oxygen release [77].
Crystalline engineering can also be carried out through increasing thermal annealing time. At 700 °C, we systematically examined crystallization of mCeO2 by increasing the annealing time from 1 h to 48 h. Despite of similar diffraction patterns (figures S7(a) and (b)), the improved crystallinity of ceria was clear as the peaks became sharp. The crystal grain size shows a very small increase from 5.0 nm (mCeO2-700-1 h) to 5.6 nm for mCeO2-700-4 h. Interestingly, further increasing the calcination time had a limited impact on the crystal grain size. For mCeO2-700-48 h, the crystal grain size remained to 6.1 nm (table 1). The peak half width of the F2g band of ceria showed a continuous decrease along the thermal annealing (figures S7(c) and (d)). This is indicative of the thermal stability of polymer templates. While the thermal treatment enhances the crystallinity, the crystals are confined by the thermally stable and mechanically strong templates. The BET surface areas and total pore volume of mCeO2-700 at different annealing times are shown in figure S8. All mCeO2-700 samples exhibited typical mesoporous isotherms. The surface area was largely preserved at longer annealing time. mCeO2-700-12 h exhibited a high surface area of 96 m2 g−1; while that of mCeO2-700-48 h slightly decreased to 63 m2 g−1. Similar results were seen from SEM (figure S9).
We further evaluated the catalytic activity of mesoporous ceria for electrochemical oxidation of sulfite. Sulfite usually produced from flue gas desulfurization [80] is an excellent scavenger readily used in photocatalysis. We first used the LSV to examine the activity of mCeO2 and bCeO2 deposited on pyrolyzed graphite (PG). Figure 4(a) shows the typical LSV curves at a scan rate of 10 mV s−1 in 0.5 M of phosphate buffer (pH ∼7) containing 1 M of Na2SO3 [81]. mCeO2-700 is very active with a much higher anodic current density (j), as compared to the bare PG electrode and that with bCeO2. At 1.0 V vs RHE, mCeO2 has a j of 32 mA cm−2, that is roughly 48 times higher than that of bCeO2. The improved catalytic activity is attributed to the large surface area and porosity of mCeO2. To confirm the activity arising from the oxidation of sulfite, LSVs at different concentrations of Na2SO3 were also collected (figure 4(b)). In comparison with the background scan at 0 M of Na2SO3, the anodic oxidation current increased with the concentration of Na2SO3. This is similar to other reports of n-type semiconductors showing similar catalytic oxidation of Na2SO3 [82].
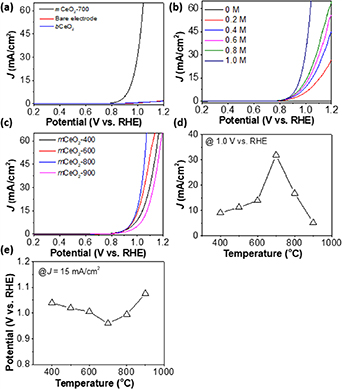
Figure 4. Electrochemical oxidation of sulfite using mCeO2 catalysts. (a) LSV curves of mCeO2-700, bare electrode, and bCeO2. (b) LSV scans of mCeO2-700 at different concentration of Na2SO3. (c) LSV scans of mCeO2 calcinated at different temperatures. All LSVs were collected at a scan rate of 10 mV s−1 in 0.5 M phosphate buffer (pH 7) containing 1 M of Na2SO3. (d) Plotting j at potential of 1.0 V vs RHE against calcination temperature. (e) Plotting potential at current density of 15 mA cm−2 against calcination temperature.
Download figure:
Standard image High-resolution imageThe activity of mCeO2 had an obvious correlation with its crystallinity. When the calcination temperature is below 700 °C, improving crystallinity enhances the activity of mCeO2. For mCeO2-400, the j is 9 mA cm−2 at 1 V and the j of mCeO2-600 increased to 13.9 mA cm−2 that is about 1.5 times compared to that of mCeO2-400. While mCeO2-700 has much better activity as compared to those samples calcined at low temperature, further increase of the calcination temperature would also decrease the activity of mCeO2. For example, mCeO2-900 has a j of 5.1 mA cm−2 at 1 V, only 15% of mCeO2-700 (figures 4(c) and (d)). While mCeO2-900 would form larger crystallinity than mCeO2-700, we attributed the loss of activity to the increase of grain sizes (figure 3(b)). The increase of crystalline grains would lead to the overgrowth of ceria that exposes less Ce sites on the surface. This also be confirmed from the potential to reach j of 15 mA cm−2 (figure 4(e)). For mCeO2-700, 0.96 V is needed to reach j of 15 mA cm−2; while, that of mCeO2-400 increased to 1.04 V.
While crystallinity is critical for the activity of mCeO2, the annealing time also shows an impact on the activity (figure 5(a)). mCeO2-700-1 h that has a j of 6.1 mA cm−2 at 1 V was less active compared to mCeO2-400-4 h. The activity of mCeO2-700-12 h was among the highest with a j of 42.3 mA cm−2 at 1 V, approximately 7 times more active as compared to mCeO2-700-1 h and 62 times more active as compared to bCeO2 (figure 5(b)). Further increasing the calcination time would lead to the decrease of activity, similar to those at a higher temperature. It is presumably due to the decrease of surface area at a longer calcination time.
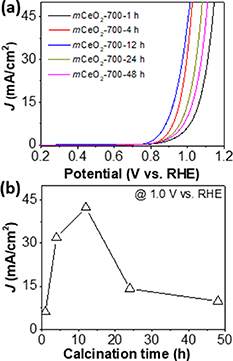
Figure 5. Electrochemical oxidation of sodium sulfite using mCeO2 catalysts annealed at different time. (a) LSV curves of mCeO2-700 annealed at different time. (b) Plotting current density against calcination hours at potential of 1.0 V vs. RHE. All LSVs were collected at a scan rate of 10 mV s−1 in 0.5 M phosphate buffer (pH 7) containing 1 M of Na2SO3.
Download figure:
Standard image High-resolution imageEIS was used to study the charge transfer kinetics. Figure 6 shows the EIS results measured in saturated Na2SO3 solution at 1 V vs RHE. The equivalent circuit fits perfectly with the Nyquist plots for all mCeO2 (figure 6(b)). Not surprisingly, mCeO2-700 exhibits the lowest electron transport impedance with the charge transfer resistance (Rct) of 35.7 Ω (figure 6(c)). The trend in Rct was aligned with the catalytic activity of mCeO2. Below 700 °C, high-temperature annealing improves the charge transfer rate constant, which is inversely proportional to Rct. The heterogeneous apparent electron transfer rate constant (kapp) characterizes the intrinsic activity of electrochemical active species, and kapp was calculated from [83, 84]:

Figure 6. Electrochemical impedance analysis of mCeO2. Nyquist plots of (a) bCeO2 and (b) mCeO2 calcinated at different temperatures. (c) Summary of charge transfer resistance (Rct) and heterogeneous apparent electron transfer rate constant (kapp) for all catalysts. All EIS were measured in saturated Na2SO3 in 0.5 M phosphate buffer at potential of 1 V.
Download figure:
Standard image High-resolution image
where the R is the gas constant (8.314 J K−1 mol−1), T is the temperature (298 K), n is the number of electrons transferred in the reaction, which is n = 2 for electrooxidation of SO3
2− to SO4
2−. F is Faraday's constant, Rct is the charge transfer resistance in Ω, A is the area of the working electrode, and C is the concentration of Na2SO3. The results are summarized in figure 6(c). mCeO2-700 and mCeO2-800 have a close kapp of 44.4  10−7 cm s−1 and 42.8
  10−7 cm s−1, respectively, that is close to 2 times as compared to mCeO2 calcined at a lower temperature. Increasing the crystallinity while retaining their porosity is of critical importance. mCeO2-700-12 h shows a kapp of 101.1
 10−7 cm s−1 suggesting that the electron transfer rate at the surface of mCeO2 is about 5-times faster than for less crystalline samples like mCeO2-400. In addition, the porosity of mCeO2 contributes significantly to the activity. As compared to bCeO2, mCeO2-700-12 h shows about 84 times faster charge transfer rate. Other than the improvement of crystalline, the surface oxidation state of Ce may contribute to the overall catalytic performance. Although it is close to the commercial one, mCeO2-700-1 h and mCeO2-700-12 h still showed Ce3+ of 28 and 32 at%, respectively, as measured from XPS (see figure S10). The increase of Ce3+ ions on the surface is indicative of surface oxygen vacancy that usually enhances the binding of substrates. Therefore, the balance of crystallinity and porosity (surface area) of mCeO2 catalysts contributes to the improved electrochemical catalytic activity.
4. Conclusion
The results above demonstrate a facile and useful method to synthesize ordered mesoporous ceria with high crystallinity and thermal stability. The use of organosilane-containing polymer micelles could provide thermally stable and mechanically strong templates to prevent the collapse of mesoporous frameworks during calcination. We showed the simple EISA process by controlling the interaction between templates and metal precursors. At 700 °C, mCeO2-700 has a specific surface area of 84 m2 g−1 with a pore size of 14 nm. mCeO2 was active for electrochemical oxidation of sulfite. With porosity, mCeO2-700 showed a higher anodic current density of 32 mA cm−2 at 1 V vs RHE, roughly 48 times higher than that of bCeO2. Using EIS, we measured the intrinsic activity of mCeO2 through apparent electron transfer rate constant. mCeO2-700-12 h with a perfect balance of crystallinity and porosity had an electron transfer rate of 10−5 cm s−1, that is about 84 times faster compared to bCeO2 and 5 times faster compared to mCeO2 with a lower crystallinity.
Acknowledgments
J H is grateful for the financial support from National Science Foundation (CEBT-1705566). The HR-TEM studies were performed using the facilities in the UConn Thermo Fisher Scientific Center for Advanced Microscopy and Materials Analysis (CAMMA). Low-magnification TEM and SEM images were obtained at the Biosciences Electron Microscopy Facility at the University of Connecticut. This work was also partially supported by the Green Emulsions Micelles and Surfactants (GEMS) Center of the University of Connecticut.
Supplementary data (2.0 MB PDF)