

Abstract
A largely automated extreme weather event (EWE) attribution system has been developed that uses the Weather Research and Forecast numerical weather prediction model to simulate EWEs under current and pre-industrial climate conditions. The system has been applied to two extreme precipitation events in Aotearoa New Zealand with the goal of quantifying the effect of anthropogenic climate change on the severity of these events. The forecast simulation of the target event under current climate conditions constitutes the first scenario (ALL). We then apply a climate change signal in the form of delta fields in sea-surface temperature, atmospheric temperature and specific humidity, creating a second 'naturalised' scenario (NAT) which is designed to represent the weather system in the absence of human interference with the climate system. A third scenario, designed to test for coherence, is generated by applying deltas of opposite sign compared to the naturalised scenario (ALL+). Each scenario comprises a 22-member ensemble which includes one simulation that was not subject to stochastic perturbation. Comparison of the three ensembles shows that: (1) the NAT ensemble develops an extreme event which resembles the observed event, (2) the severity, i.e. maximum intensity and/or the size of area affected by heavy precipitation, changes when naturalising the boundary conditions, (3) the change in severity is consistently represented within the three scenarios and the signal is robust across the different ensemble members, i.e. it is typically shown in most of the 22 ensemble members. Thus, the attribution system presented here can be used to provide information about the influence of anthropogenic climate change on the severity of specific extreme events.
Export citation and abstract BibTeX RIS

Original content from this work may be used under the terms of the Creative Commons Attribution 4.0 license. Any further distribution of this work must maintain attribution to the author(s) and the title of the work, journal citation and DOI.
1. Introduction
Following extreme weather events (EWEs) that cause severe impacts, the question of whether these events can be attributed to human-induced climate change has become increasingly important for policymakers, scientists, and the public. The nascent field of EWE attribution has experienced rapid growth recently, with weather and climate service providers aiming to issue attribution statements within days of an event occurring (National Academies of Sciences et al 2016, Herring et al 2022).
Systematic near-real-time attribution assessments are challenged by the wide variety of extreme events, the geographical heterogeneity of data availability (near-real-time weather data, long-term climate records and impact data), and the need to ask different questions—and therefore also use different tools—in different contexts (Hegerl et al 2010, Pall et al 2011, Takayabu et al 2015, Clarke et al 2022, Stone et al 2022). For large-scale events such as heat waves, droughts and synoptic-scale extreme precipitation events, analyses of the frequency and severity of such events in ensembles of global climate models configured to simulate both present-day and pre-industrial conditions can be used to infer the impact of climate change on the analysed class of events (Stott et al 2004)—a probabilistic 'risk-based' framing of the attribution question (see also Philip et al 2020, van Oldenborgh et al 2021). This method, however, relies on robust simulation of the processes that govern the analysed extreme event within global climate models and, therefore, is specifically useful for attribution of large-scale events. As the resolution of climate models improves, such an approach becomes suitable for smaller-scale events. However, currently the availability of such simulations is limited, especially in the Southern Hemisphere, thereby complicating attribution analysis of regional-scale events (e.g. Tradowsky et al 2022).
If one is to attribute smaller-scale events, such as orographic precipitation and precipitation events with convective characteristics, using global climate models, then some extrapolating assumptions are required to draw conclusions about these smaller-scale characteristics from larger-scale features. For such events, an alternative approach can be applied, which, while not able to determine any changes in the frequency of such events, can be used to analyse how the severity/magnitude of the event has been affected by anthropogenic climate change. A variety of studies have tested such an approach, e.g. Takayabu et al (2015), Pall et al (2017), Reed et al (2020).
In Aotearoa New Zealand (hereafter New Zealand), there are several causes of extreme precipitation including, on a regional scale, (i) atmospheric rivers, i.e. long narrow plumes of high water vapour transport, such as that which caused the Buller flooding event in mid-July 2021 (see Reid et al 2021, for a discussion of the connection between atmospheric rivers and flooding in New Zealand), (ii) ex-tropical cyclones or sub-tropical lows that arrive in New Zealand accompanied by an air mass with very high moisture content originating in the sub-tropics (such as Cyclone Gabrielle in mid-February 2023), and (iii) very slow or stalling frontal systems that cause heavy precipitation to continue for many hours or even days (e.g. causing the Canterbury flooding event in May 2021). Such heavy precipitation events may result in flooding and landslides, especially when synoptic weather features slow down or stall, thus prolonging heavy precipitation in a region, and/or when air masses with very high moisture content are forced to rise over New Zealand's mountainous terrain, resulting in orographic enhancement of precipitation. On smaller space and time scales, localised or small-scale extreme precipitation in New Zealand is typically driven by convective processes in the atmosphere and often by thunderstorms. These convective events are generally of shorter duration with impacts affecting a much smaller area, especially in the case of isolated or air-mass thunderstorms such as those commonly occurring inland in summer driven by daytime heating over the land.
Here, we present results from a largely-automated attribution system that has been developed to simulate specific EWEs in New Zealand under different climate scenarios to determine the impact of anthropogenic climate change on the severity of such events. The system has been designed for New Zealand to address the specific challenges arising from location, orography and the meteorological setting. The study addresses research questions regarding whether the approach of using forecast-model simulations to simulate the change in severity provides a valid method to attribute precipitation events in New Zealand to climate change. An overview of the attribution framework developed in New Zealand based on two-approaches, i.e. a probabilistic method and the forecast-model-based system, was presented in Tradowsky et al (2022). Here, a detailed description of the forecast-model-based attribution system is provided prior to presenting results for two extreme precipitation events, one on the East Coast and one on the West Coast of New Zealand. The paper finishes with a summary and discussion.
2. Method
We wish to determine how the severity of an EWE has been affected by anthropogenic climate change. Instead of running a global climate model that calculates large-scale dynamics explicitly and uses sub-grid parameterisation schemes to extrapolate to the small-scale, as is typically done for probabilistic attribution studies, we use a high-resolution limited area weather forecast model to explicitly calculate the small-scale dynamics under inferences of what the global context might have been under different climatic conditions. This more conditioned 'storyline approach' was suggested in Trenberth et al (2015) and Shepherd (2016) and has been applied in a variety of other studies (e.g. Takayabu et al 2015, Pall et al 2017, Reed et al 2020).
We perform simulations using the Weather Research and Forecast (WRF) model (Skamarock et al 2019) taking its lateral and surface boundary conditions from a global forecast of the large-scale synoptic conditions prevailing during the analysed EWE. These simulations follow one of the forecast configurations used by MetService's (New Zealand's national meteorological service) operational forecasting system, which has been tuned to New Zealand's specific meteorological situation. The WRF simulations are run under three different sets of initial conditions (so-called scenarios): boundary conditions representative of the observed event from the operational global model (ALL), i.e. unperturbed fields of the global forecast; counterfactual initial and boundary conditions perturbed according to attributable human influence to reflect an atmosphere–ocean state absent human interference with the climate system (NAT; see section 2.1); and a further counterfactual (ALL+) to test for the coherence of the approach. In the ALL+ scenario those perturbations that are subtracted from the initial and boundary conditions for the NAT scenario are instead added. Figure 2 of Tradowsky et al (2022) provides a graphical overview of these simulations while table 1 provides a summary. All WRF simulations are initialised from global forecasts produced by the Global Forecast System (GFS, Wang et al 2019), and use those global forecasts to update boundary conditions throughout the WRF simulation period. For each of the NAT, ALL and ALL+ scenarios, in addition to generating a control forecast in which no perturbations are applied to the GFS initial and boundary conditions, we also generate 21 member ensembles of forecasts where the initial and boundary conditions are perturbed with a set of repeatable perturbations across the three scenarios, as explained further in section 2.3, which provides additional details on the construction of these scenarios.
Table 1. Overview of the WRF simulations.
| Name of scenario | Boundary/initial conditions | Details |
|---|---|---|
| ALL | GFS | Uses boundary and initial conditions from the Global Forecast System (GFS). |
| NAT | GFS− | Boundary conditions are prescribed from GFS but with delta fields applied to remove an anthropogenic attributable signal, as detailed below. Delta fields are applied to the following boundary condition fields at each time step of the simulation:
 Vertically resolved temperature, humidity and geopotential height. Vertically resolved temperature, humidity and geopotential height.
 Sea surface temperature, soil temperature and skin temperature. Sea surface temperature, soil temperature and skin temperature.
|
| ALL+ | GFS+ | Uses boundary conditions based on GFS but adds the attributable warming estimates to GFS, i.e. the anthropogenic warming signal is doubled. |
2.1. Estimated climate change signal
The attributable warming signal applied as delta fields to the GFS boundary conditions for the NAT and ALL+ scenarios is the benchmark 'Nat-Hist/CMIP5-est1' estimate used by the Climate of the 20th Century Plus (C20C+) Detection and Attribution project (Stone and Pall 2021), a subproject under the World Climate Research Programme. The anthropogenic skin temperature signal is estimated as the difference between (i) the average skin temperatures across 51 simulations of historical climate change from 19 global climate models, and (ii) the average skin temperatures from another 51 simulations of the same models but run under natural historical conditions. The climate model simulations were produced as part of the Coupled Model Intercomparison Project Phase 5 (Taylor et al 2012). The signal varies smoothly spatially and between calendar months. We use the same sources and calculations to estimate the delta fields for (vertically resolved) air temperature and specific humidity throughout the atmosphere. Full details of the method are provided in Stone and Pall (2021).
2.2. Applying adjusted boundary conditions to WRF
The delta fields are interpolated horizontally and vertically onto the GFS grid. As delta fields are only available from 1000 hPa to 10 hPa, delta values at 10 hPa are repeated for pressures less than 10 hPa. To convert the C20C+ absolute humidity to the GFS forecast's relative humidity, the absolute humidity was calculated from GFS fields prior to applying the air temperature delta and the absolute humidity delta. The perturbed absolute humidity field was then converted back to relative humidity and constrained to the range from 0% to 100%. Unlike for air temperature, the specific humidity delta was not repeated above the 10 hPa pressure level but set to zero, as humidity perturbations at these levels will not materially impact the development of weather systems in the troposphere on short time frames. The 2 meter temperature, skin temperature, and soil temperature in GFS are perturbed with the C20C+ skin temperature delta fields. Geopotential heights were recalculated after applying the perturbations to other variables; a geopotential height difference delta was applied to the geopotential height differences between layers, calculated by applying the hydrostatic equation to the temperature delta that was applied to the associated layer.
2.3. Setup of the WRF ensembles
The WRF modelling system used for the simulations analysed here is based on WRF version 4.2.1, which is run in a 24 km/8 km two-way nesting configuration, including 51 vertical levels. Two stochastic schemes were considered for generating the ensemble perturbations:
- (i)The stochastic kinetic energy backscatter (SKEB) scheme, as described in Berner et al (2011), which addresses model uncertainties arising from unresolved subgrid-scale processes (e.g. diffusion/model truncation) by adding stochastic, small-amplitude perturbations to the rotational wind and temperature fields at each time step to correct the kinetic energy spectra.
- (ii)The stochastically perturbed parameterisation tendency (SPPT) scheme, as described in Berner et al (2015), which represents model uncertainties attributable to physics parameterisation schemes of processes that are not well simulated by the resolved model dynamics, such as deep convection. SPPT works by perturbing the net physical tendencies of temperature, zonal and meridional winds, and humidity at each grid point and time step with random increments. By design, the perturbations are large where the physical tendencies—and presumably their uncertainty—are large, and they have very little effect when and where the tendencies are small.
Independent of the perturbation scheme applied, the ensemble member number is used as a seed within the random number stream for the stochastic scheme and is a function of the initialisation time. In this way, each scheme provides a repeatable perturbation for the three scenarios under consideration. Initial experiments showed that the SPPT scheme performed better in capturing precipitation accumulations than SKEB and was therefore applied in the simulations presented here.
The ensembles are initiated using MetService's cloud-based WRF Ensemble Prediction System (EPS), which is operated on Amazon Web Services and is separated from the production system to avoid interfering with the operational forecasts. An on-demand dashboard is used to create the WRF configuration files for the 22 ensemble members, including one non-perturbed control member, and to trigger the calculations. While the SPPT implementation in WRF provides various parameters to tune the amplitude of the changes, for this work the supplied defaults were used.
3. Results
While the WRF simulation and attribution system can be applied to a variety of EWEs including heat waves, the results are particularly interesting for extreme precipitation events as the attribution of New Zealand's precipitation events is more challenging due to the steep orography and the limited availability of climate model simulations suitable for a probabilistic attribution of such events (see e.g. Tradowsky et al 2022). Therefore, two extreme precipitation events are analysed below, one impacting areas east of the Southern Alps while the other one affected the West Coast of the South Island. Both events received the highest weather warning level by New Zealand's MetService, i.e. an impact-based red warning, and both led to severe impacts, including infrastructure damage that isolated communities. Furthermore, these events occurred recently, broke observational rainfall records, and were caused by the interaction of synoptic-scale weather systems with orography. Their characteristics present unresolved challenges for other attribution approaches given observational and climate model resources currently available in New Zealand and, therefore, are examples of extreme events for which this forecast-model-based attribution system is most valuable.
Prior to initiating the ALL, NAT and ALL+ scenarios of WRF simulations, MetService meteorologists evaluate whether the global GFS simulations adequately represent the large-scale synoptic situation that led to the EWE and whether the operational WRF simulations were able to represent the event sufficiently well. This is achieved by performing a subjective but well-informed expert analysis of the operational modelling of the event, compared with the observed event, i.e. a comparison of precipitation intensity, duration, distribution and total accumulation between the operational WRF model and observations. As for other attribution approaches (see e.g. the model evaluation section in Philip et al 2020 and Tradowsky et al 2023), the ability of the model to simulate the processes that lead to the target extreme event is a precondition for the analysis. Given that we simulate a specific event, it is possible to require that the event is represented within the simulations. If this condition is met, the ALL, NAT and ALL+ scenarios are produced. The ALL scenario is also visually evaluated against observations to confirm that these regional-scale simulations, which slightly differ from the operational forecast as they do not assimilate observations, also adequately represent the EWE. This decision again relies on the expert judgement of trained meteorologists from New Zealand's MetService. We also evaluate whether the EWE is apparent in the NAT and ALL+ simulations. While the NAT and ALL+ events may be more or less intense, it is a prerequisite for our analysis that they occur in approximately the same location and at the same time through the same meteorological mechanisms. The decision on whether the requirements are met, is based on expert judgement (see Tradowsky et al 2022, for a discussion on expert group meetings to discuss and analyse these simulations). If this is not the case, these simulations are assumed to represent a different event rather than the same event under different boundary conditions such that it would be unclear how to interpret any cross-scenario comparison. Given the event is represented in the scenarios, we then compare the ALL and NAT ensembles, across pairs of perturbations applied using SPPT (i.e. compare ensemble member 1 of ALL with ensemble member 1 of NAT), to investigate how the severity of the EWE was affected by climate change. Because we are examining events for which conditions were optimal for producing an extreme (under the ALL scenario), there may be a selection issue at play. In a nonlinear chaotic system, it is quite possible that any modification—such as the application of delta fields to the boundary conditions for the NAT scenario—will break the optimisation of those conditions. The ALL+ scenario serves as a check against this situation: if the difference between ALL+ and ALL is not coherent with the difference between ALL and NAT, we then conclude that our scenario is suffering from substantial selection bias.
The following two sections present example analysis workflows for two recent EWEs: a heavy precipitation event on the East Coast of New Zealand's South Island in May 2021, mainly affecting the Canterbury region, and a severe precipitation event on the West Coast, impacting the Buller and Marlborough Districts in July 2021.
3.1. Extreme precipitation event Canterbury 2021
The extreme precipitation in Canterbury over the period 29–31 May 2021 produced historic flooding. The event was caused by a slow-moving low near central New Zealand that directed an easterly flow onto the South Island, with a subtropical feed of moisture delivering prolonged heavy precipitation. The event prompted MetService to issue the second-ever red warning and a state of emergency was declared in response to the flooding and widespread impacts, including power outages and damage to roads and bridges. The Insurance Council of New Zealand lists the losses due to the event insured with private insurance companies at NZ$46.4 million (www.icnz.org.nz/industry/cost-of-natural-disasters/, last accessed 13 March 2023).
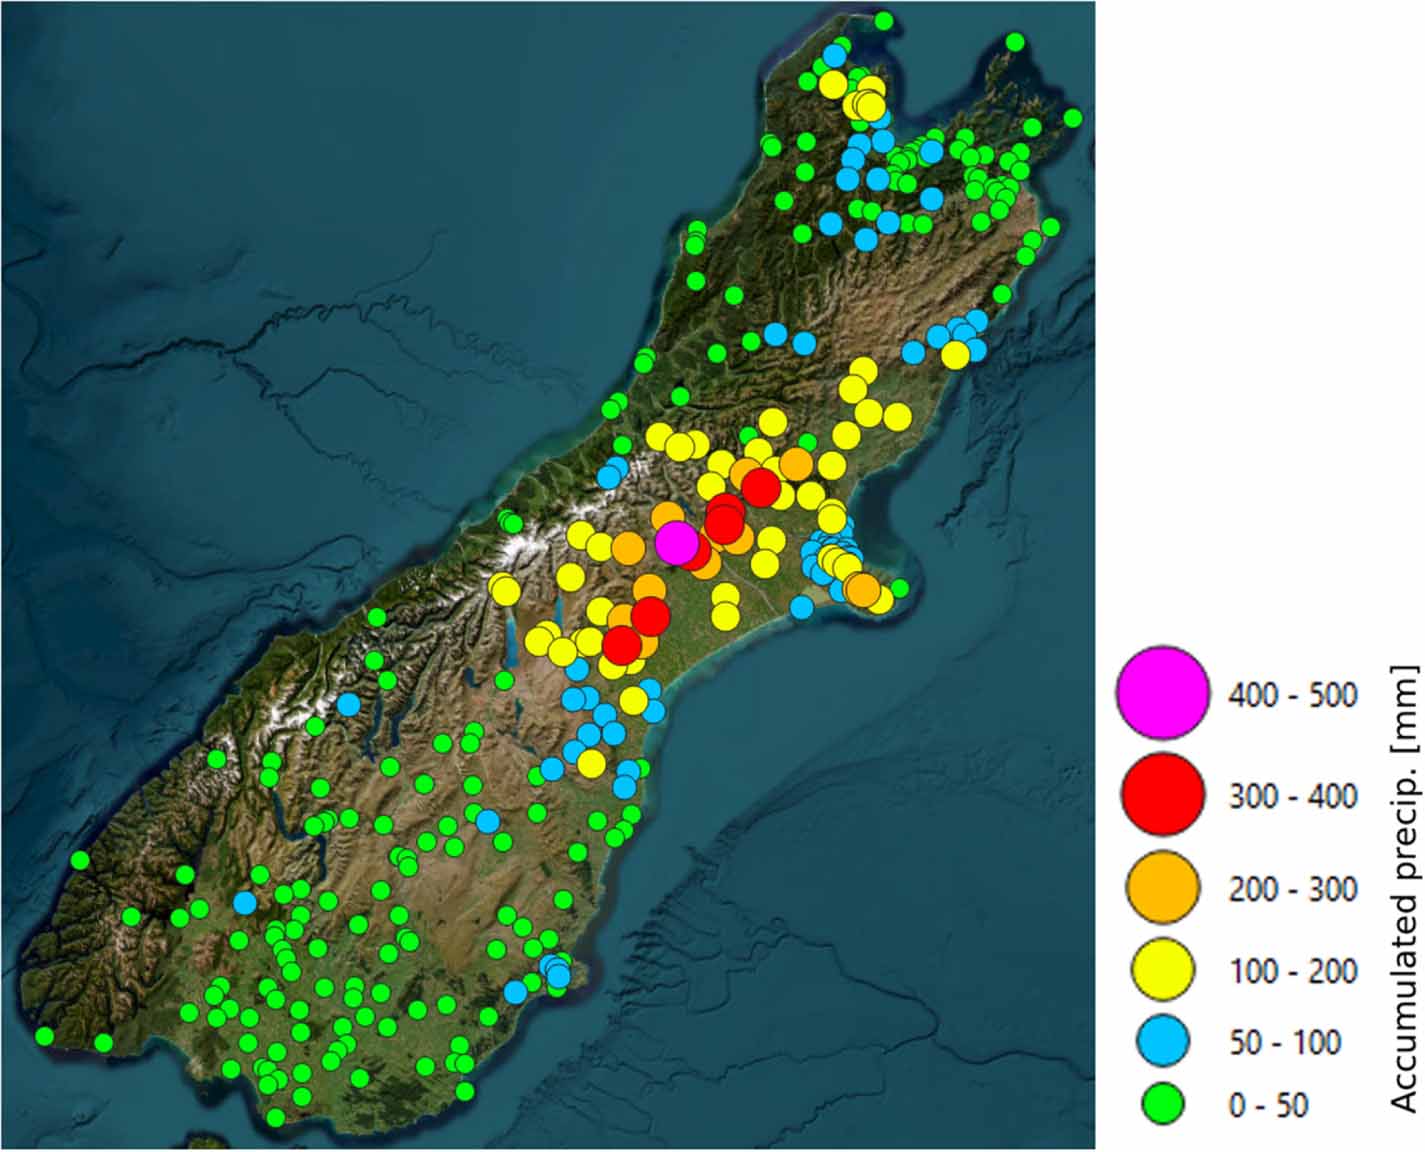
Figure 1 shows the 48 h accumulated precipitation at observing sites throughout the South Island of New Zealand. Precipitation accumulations above 200 mm were widespread along the Canterbury foothills, with maximum accumulations of more than 400 mm at the Mt Somers observing site.

Figure 1. Precipitation (precip) accumulated over the 48 h from 28 May 2021, 21 UTC to 30 May 2021, 21 UTC at individual observing sites. The presented data include observing sites operated by MetService, the National Institute of Water and Atmospheric Research (NIWA), Fire and Emergency New Zealand (FENZ), and by Regional and City Councils.
Download figure:
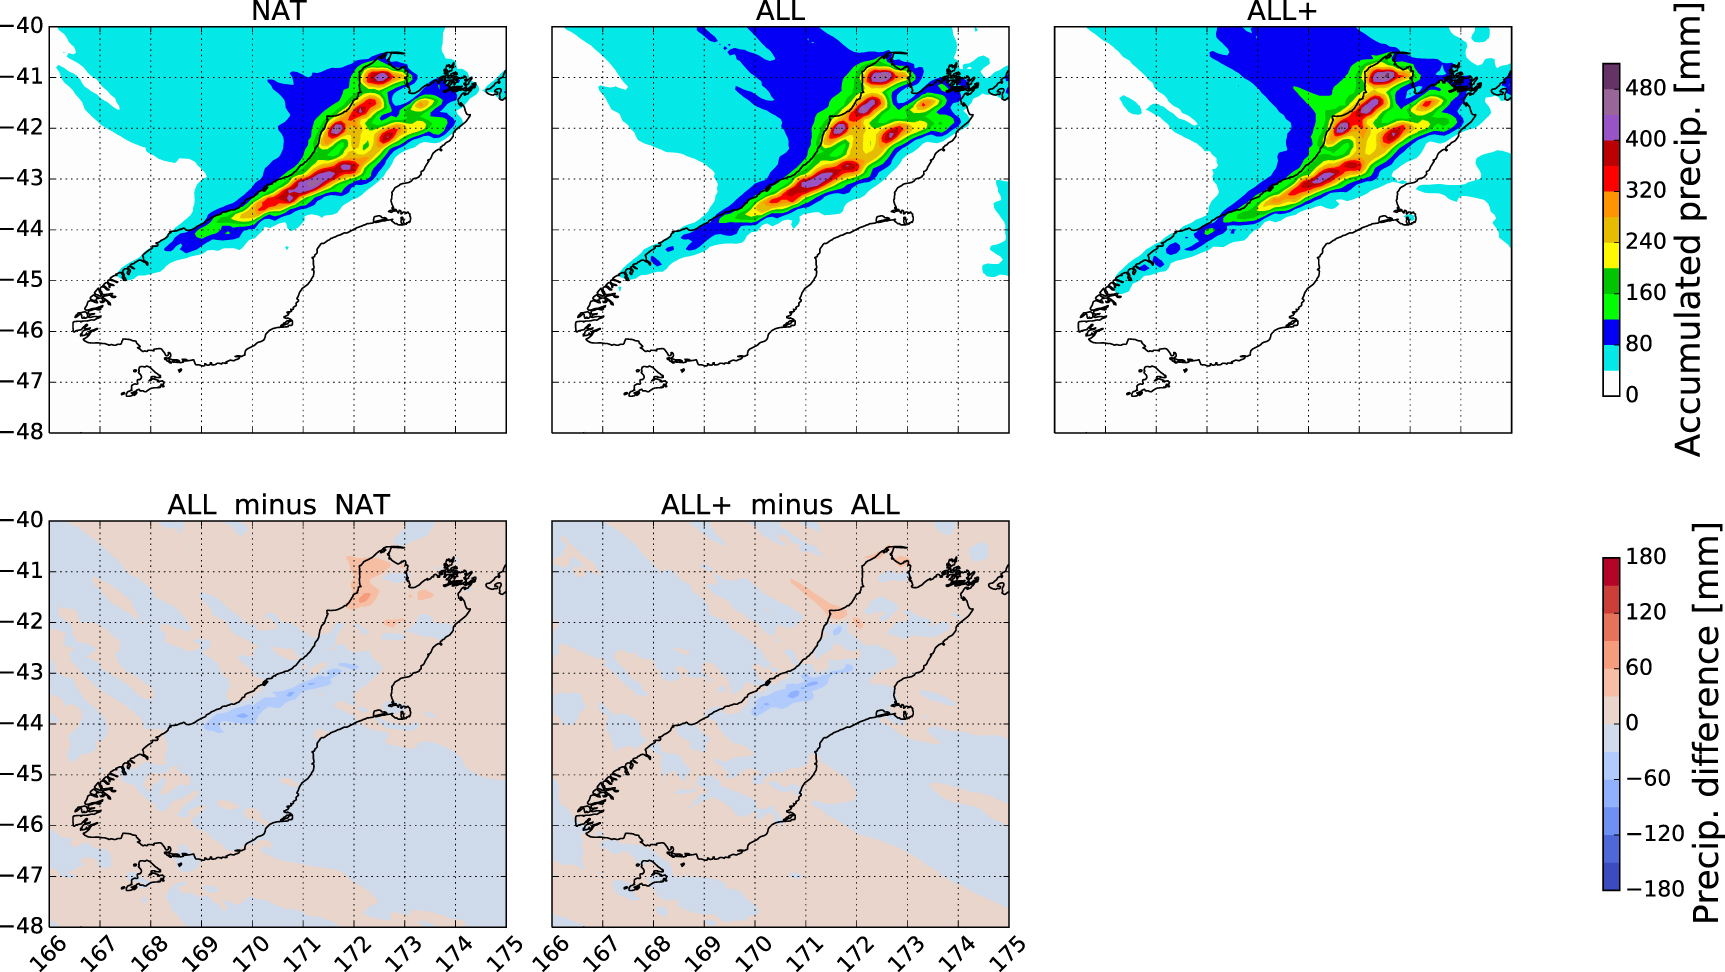
Standard image High-resolution imageWRF simulations for the three scenarios (NAT, ALL and ALL+) were prepared shortly after the event. The first 10 h of the simulation were discarded as they provide spin-up for the model. Figure 2 shows the ensemble mean 2 day accumulated precipitation fields for each of the three scenarios and their respective differences. Similar to the observations, precipitation accumulations exceeding 200 mm are widespread with some locations reaching more than 300 mm within 2 days in the ensemble mean. While the ALL minus NAT difference field shows that more precipitation fell under current climate conditions than would have been the case under pre-industrial climate conditions within Canterbury, a signal of opposite sign (though weaker) is seen further south in Otago. The ALL+ minus ALL comparison shows a similar pattern, indicating coherence in the simulation. This pattern reflects a northward expansion in the event from NAT to ALL and again to ALL+ (strictly speaking, the expansion is northeastward, but we follow New Zealand's conventions in referring to this direction as northward along the island). We examine the reason for this expansion in section 3.1.2.
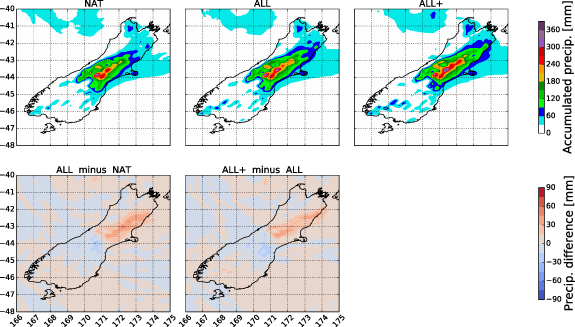
Figure 2. Ensemble means and the differences between them for precipitation in the NAT, ALL and ALL+ scenario accumulated over the 48 h from 28 May 2021, 21 UTC to 30 May 2021, 21 UTC.
Download figure:
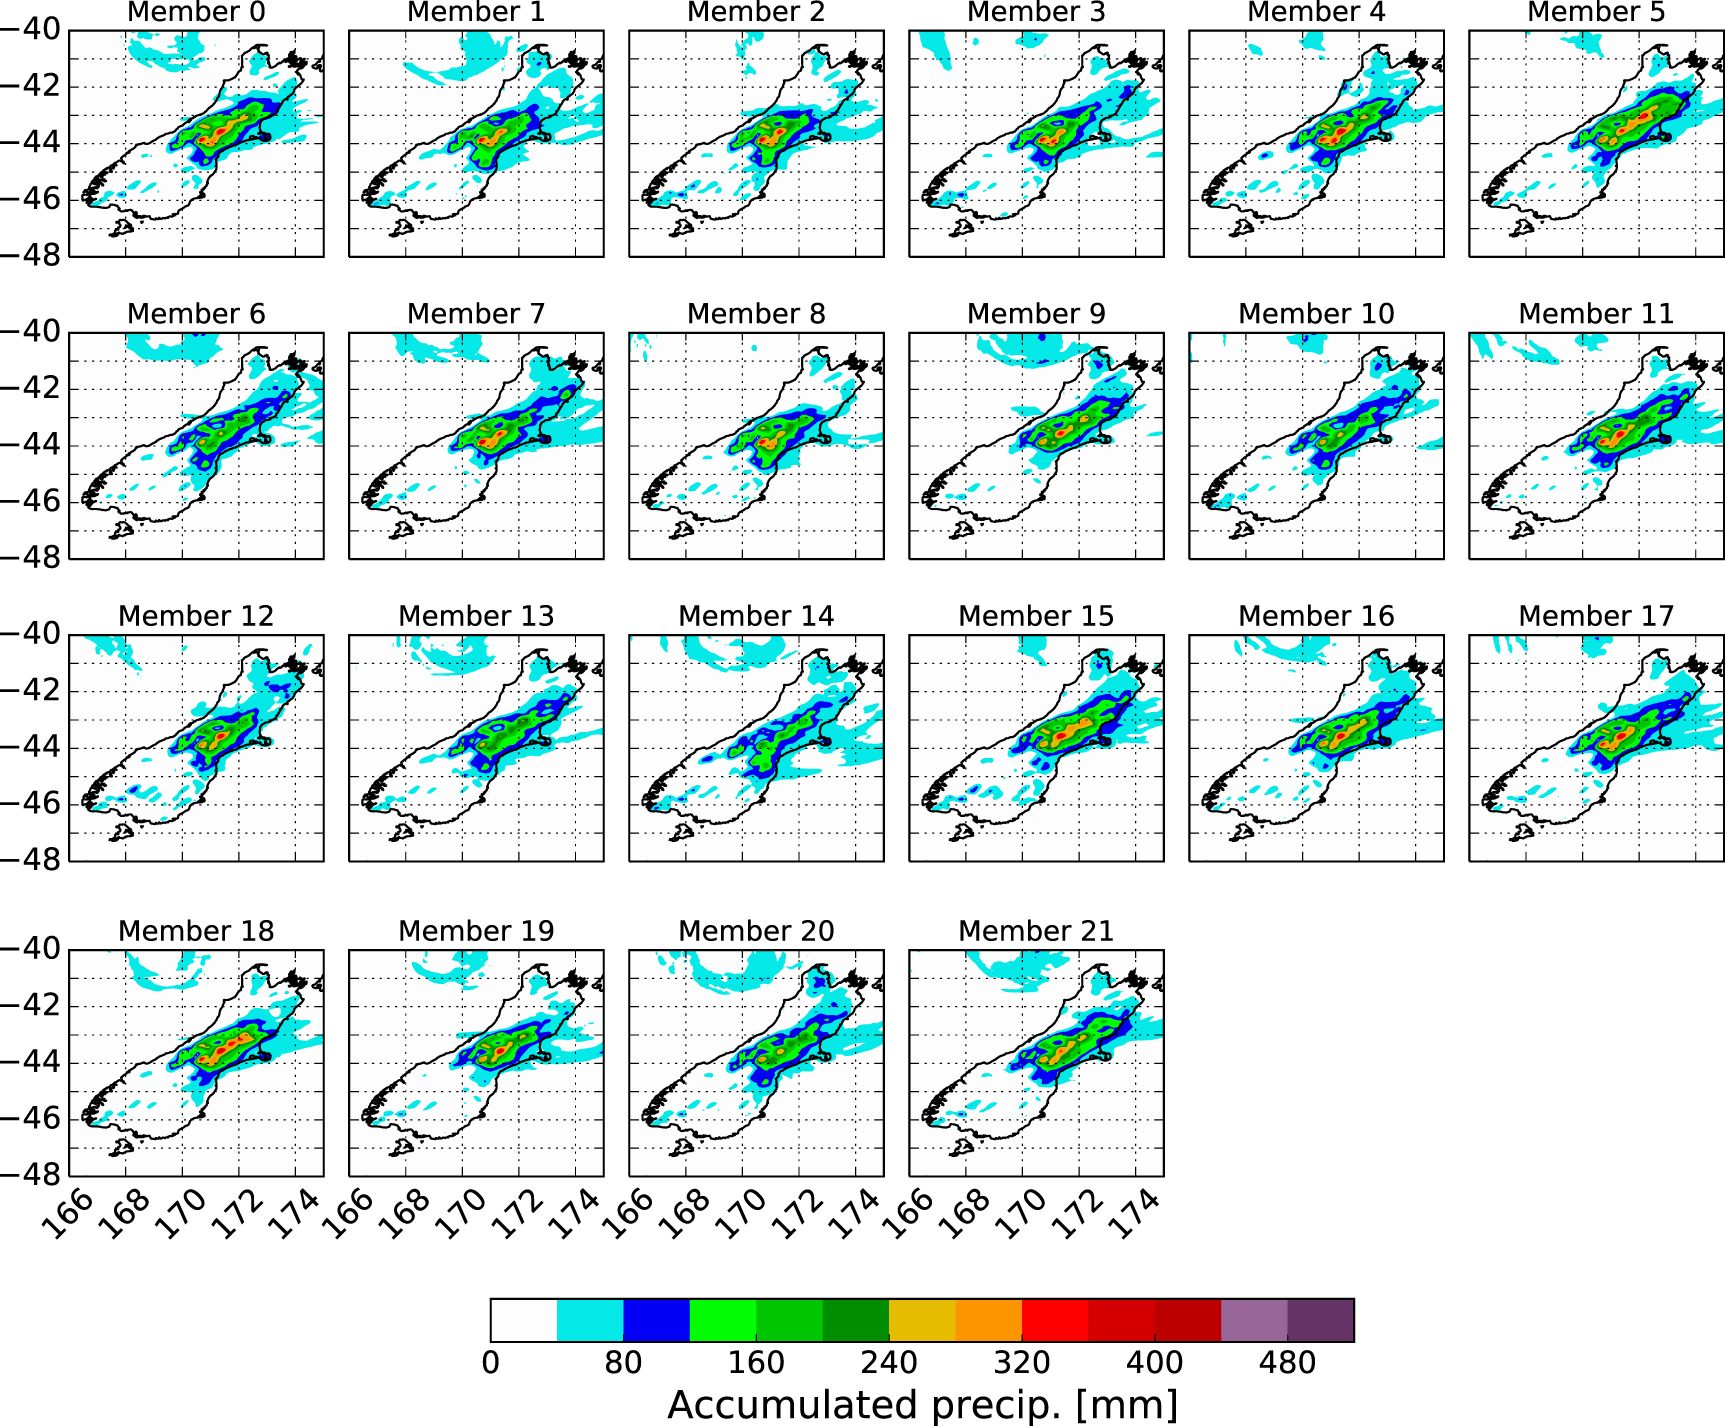
Standard image High-resolution imageExamining the individual ensemble members can provide insights into the sensitivity of the WRF simulations to the (perturbed) boundary conditions. To that end, figures 3 and 4 show 2 day accumulated precipitation fields from each member for the ALL and NAT scenarios, respectively. While each WRF simulation generates a precipitation-producing weather system, there are obvious differences in the morphology of the precipitation fields. For example, ensemble members 13 and 14 show less extreme precipitation than the other ensemble members. Consider also the difference in north–south extent of the event between ensemble member 5, where the 120 mm contour spans about 2∘ of latitude, and ensemble member 19, where the 120 mm contour spans about 1.5∘ of latitude. As the same SPPT-generated perturbations are applied to the nth ensemble member across each of the three scenarios, anomalies in ensemble members are seen across each of the scenarios. For example, ensemble member 14 also shows lower precipitation in the NAT scenarios (and in ALL+, which is not shown here).
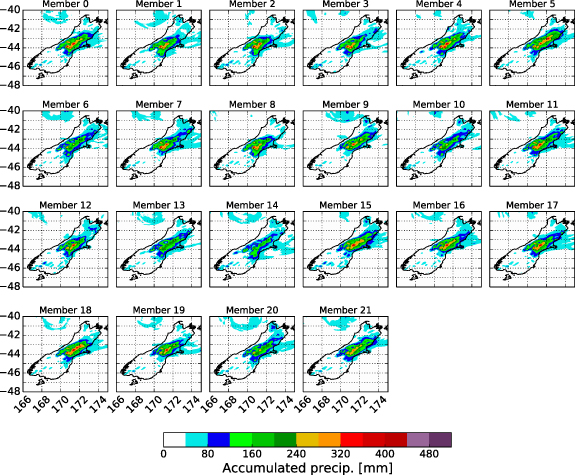
Figure 3. Precipitation accumulated over the 48 h period from 28 May 2021, 21 UTC to 30 May 2021, 21 UTC as presented in the individual ensemble members for the ALL scenario.
Download figure:
Standard image High-resolution image
Figure 4. As figure 3, but for the NAT scenario.
Download figure:
Standard image High-resolution image3.1.1. Estimation of the attributable signal in the Canterbury precipitation event
To quantitatively estimate how the severity of precipitation has changed as a result of anthropogenic greenhouse gas emissions, an area is first selected based on a mask that includes all grid points which accumulated at least a given amount of precipitation. This mask can either be prepared individually for each individual ensemble member from any scenario (hereafter individual masks), or it can be shared between all scenarios and all ensemble members, i.e. a union of the 66 individual masks is used. This so-called shared mask includes any grid point with precipitation accumulations reaching at least the selected threshold in any one ensemble member of any one scenario. Figure 5 shows the NAT, ALL and ALL+ ensemble mean 2 day accumulated precipitation fields calculated using the shared mask for two precipitation thresholds, i.e. 100 mm and 200 mm (calculations also done for 150 mm and 250 mm but not shown here). The precipitation intensity (in mm/grid point) is larger in the scenarios that include climate change than in the pre-industrial NAT scenario and the region of heavy precipitation moves slightly northwards from NAT to ALL to ALL+. A similar figure produced using the individual masks (not shown here) shows that the area with precipitation above each selected threshold increases from the NAT to ALL and ALL+ scenario.

Figure 5. Ensemble means of 2 day (28 May 2021, 21 UTC–30 May 2021, 21 UTC) accumulated precipitation within the shared mask for NAT, ALL and ALL+. The mask includes all grid points that reached more than (a) 100 mm and (b) 200 mm accumulated precipitation within any ensemble member.
Download figure:
Standard image High-resolution imageThere are two ways to summarise the analysis results of precipitation within individual and shared masks i.e. the individual masks can be used to test whether the area affected by heavy precipitation has changed, and the shared mask can be used to test whether the intensity of precipitation is affected. Both of these results are presented below. Using the individual masks, figure 6 shows the number of grid points that are within the mask of a selected precipitation threshold for NAT, ALL, ALL+ in the ensemble mean (top) and for the individual 22 ensemble members (bottom). The number of grid points increases with increasing anthropogenic warming (from NAT to ALL to ALL+) both in the ensemble mean and in each of the ensemble members. Occasional exceptions to this behaviour occur for precipitation above 250 mm where only very few grid points are within the mask. Using the shared mask, figure 7 shows the average precipitation across all grid points within the mask. There is a robust increase in the 2 day accumulated precipitation averaged over the shared mask area from the pre-industrial NAT ensemble to the ALL and ALL+ ensembles, both in the ensemble mean (figure 7(a)) and in each of the individual ensemble members (figure 7(b)).

Figure 6. Total number of grid points with 2 day (28 May 2021, 21 UTC–30 May 2021, 21 UTC) accumulated precipitation during the Canterbury event exceeding 100, 150, 200 and 250 mm, respectively, across the three scenarios for the ensemble mean (a) and the individual ensemble members (b). Masks used are determined individually for every ensemble member and separately for the ensemble mean.
Download figure:
Standard image High-resolution image
Figure 7. Average 2 day (28 May 2021, 21 UTC–30 May 2021, 21 UTC) accumulated precipitation for the Canterbury event within the three scenarios for the ensemble mean (a) and the individual ensemble members (b). The results are based on the shared mask for thresholds of 100, 150, 200 and 250 mm.
Download figure:
Standard image High-resolution imageBased on the robustness of these results, the simulations were considered suitable as the basis for an attribution statement about the severity of the event. Using the shared mask, the percentage change in 2 day accumulated precipitation between the ALL and the NAT scenario was calculated and shown in figure 8. While the percentage increase in accumulated precipitation from NAT to ALL depends slightly on the analysed area (as defined by the shared spatial mask for 100, 150, 200 and 250 mm) the median lies around 12% increase in 2 day accumulated precipitation due to anthropogenic climate change. The range of the whiskers increases with increasing precipitation threshold being analysed, i.e. with decreasing number of grid points included in the analysis. An attribution statement for this event was released to the public on 9 December 2021, see EWERAM (2021).

Figure 8. Intensity change, i.e. the percentage change in 2 day (28 May 2021, 21 UTC–30 May 2021, 21 UTC) accumulated precipitation within a shared mask, from NAT to ALL for Canterbury event across the four precipitation thresholds selected. The orange line shows the median and the box gives the range from the first to the third quartile. The whiskers extend to the furthest data point that lies within 1.5 times the interquartile range shown by the box. Values outside of this range are shown as individual points.
Download figure:
Standard image High-resolution image3.1.2. Testing the sensitivity to different parameterisations of the large-scale attributable change signal
In the experiment presented above the extreme precipitation event extended northeastward from the NAT to the ALL to the ALL+ scenario. If that expansion results from local increased precipitation efficiency then we can argue that we are still examining the same event across the three scenarios (Pall et al 2017). However, if the expansion represents a shift imposed by larger scale changes in the dynamics, then the premise to examine the same local event (i.e. precipitation at an observing site) would become questionable; noting, however, that in this study we do not focus on site-specific changes. Such a shift could be imposed by the application of delta fields that vary with longitude and latitude (as was done for the results presented above), and in this case specifically meridional gradients in the delta fields which may have induced some meridional forcing of the system as a whole. To explore this further, an identical set of simulations was performed but now with a spatial mean (165∘ E–180∘ E, 48∘ S–34∘ S) delta field applied—the simulations were identical in that the same stochastic perturbations applied to generate the nth ensemble member in the standard simulations presented above were used to generate the nth ensemble member in these modified 'no gradient' simulations. Zonal means (from 169∘ to 174∘ E) of precipitation, accumulated from 21:00 UTC on 28 May 2021 to 21:00 UTC on 30 May 2021 (2 day accumulations) are shown in figure 9 for each of the three scenarios and for these two delta fields. While this cross-section includes precipitation falling over a wider area, the core of the extreme between 43∘ S and 44∘ S (compare figure 2) is clearly visible. Accumulations to the south of the core (south of 44∘ S), as well as the small accumulations to the north of 42∘ S, are not affected by the imposition of either set of delta fields (with either sign). As described above, the application of the delta fields with gradients produces a notable decrease of precipitation in the NAT scenario over the core and the northern flank (44∘ S–42∘ S), with a comparable increase for the ALL+ scenario. The application of the deltas without gradients, however, halves those attributable changes. Hence, it appears that the interaction of local precipitation dynamics with the different prescribed delta fields can induce spatial heterogeneity in the attributable precipitation results. Such heterogeneity can, for example, be caused by temperature gradients which, by virtue of the thermal wind equation, affect the position and the strength of any wind jets and hence affect the flux of moisture into the associated catchments and the location of precipitation. Furthermore, in this Canterbury event case, the regional spatial gradients present in our standard delta fields have had a quantifiable impact on the results which happen to project onto that dynamically-induced heterogeneity (e.g. a shift in the weather system into a mountainous region that amplifies the precipitation). While this analysis shows some sensitivity to the exact setup of attributable change delta fields, the general conclusion of an attributable increase in precipitation (from NAT to ALL) appears to be robust.

Figure 9. Zonal mean 2 day (28 May 2021, 21 UTC–30 May 2021, 21 UTC) accumulated precipitation for the simulations presented in previous sections (faded blue solid line) that used the spatially varying delta fields, and for the simulations where gradients in the delta fields over New Zealand were removed (faded red dashed line), for all three scenarios. The bold (non-faded) lines show the ensemble means. For the ALL scenario, given that no delta fields are applied and the stochastic noise applied to create each ensemble member is the same across ensemble pairs, the blue and red-dashed lines are co-located. The black lines in the NAT and ALL+ panels show the ensemble mean from the ALL panel. The underlying map of New Zealand, which is true to the latitude shown in the y-label, provides background regarding the area and topography over which the zonal mean is calculated.
Download figure:
Standard image High-resolution image3.2. Extreme precipitation event Buller and Marlborough Districts 2021
An extreme precipitation event occurred over the upper South Island from 15 to 18 July 2021. The event resulted from a prolonged northwest flow with a sub-tropical feed of moisture that caused severe flooding in the Buller District and parts of Marlborough. The 63 h accumulated precipitation exceeded 400 mm at some sites in the ranges of Westland and Tasman (see figure 10). The flow in the Buller River, measured at 7640 m3 s−1, was the highest flow ever measured in New Zealand; larger flooding did however occur in the Buller River in 1926, before the observational record started (https://niwa.co.nz/news/the-largest-flood-flow-ever-measured, last accessed 14 March 2023). As the event unfolded, states of emergency were declared in the Buller District on 16 July and in the Marlborough District on 17 July (see www.civildefence.govt.nz/resources/previous-emergencies/declared-states-of-emergency/, last accessed 14 March 2023). Flooding forced the evacuation of hundreds of properties in the Buller and Marlborough Districts and made some homes uninhabitable. The property damage insured with private insurance companies listed by the New Zealand Insurance Council was NZ$17.35 million (www.icnz.org.nz/industry/cost-of-natural-disasters/, last accessed 13 March 2023), which is significant given that the event occurred in an area that is sparsely populated. As a result of the flooding and slips, numerous roads were closed, with significant road damage reported in parts of the Marlborough Sounds.

Figure 10. Rainfall accumulated over the 63 h from 15 July 2021, 09 UTC to 18 July 2021, 00 UTC at individual observing sites. The presented data include observing sites operated by MetService, NIWA, FENZ, and by Regional and City Councils.
Download figure:
Standard image High-resolution imageThe WRF simulations for this 'Buller precipitation event' were initialised at 0000 UTC on 15 July 2021. The first ten time steps of each ensemble member were considered as a spin-up period and were excluded from further analysis. Figure 11 shows the ensemble mean precipitation for each scenario (NAT, ALL and ALL+) and their respective differences, accumulated over the course of the event from 15 July 2021, 09 UTC to 18 July 2021, 00 UTC. The most severe precipitation occurred over the northern half of the West Coast, northwards of Franz Josef/Waiau. The difference between the scenarios shows that the precipitation increases from the NAT to ALL to ALL+ scenario in the northern half of the area affected by heavy precipitation, but decreases in the southern parts of the weather system from NAT to ALL to ALL+. While it may appear that the event shifts northwards from NAT to ALL to ALL+, lagged correlation analysis shows no meridional offset between the ensemble means of NAT, ALL and ALL+ at 00 UTC on 18 July 2021 (the time step shown in figure 11). As for the Canterbury precipitation event, each ensemble member reproduces a precipitation event over the northern part of the South Island, indicating no significant selection bias (figures not shown here). Thus, we proceed with using the precipitation accumulations of the Buller event for an attribution analysis.
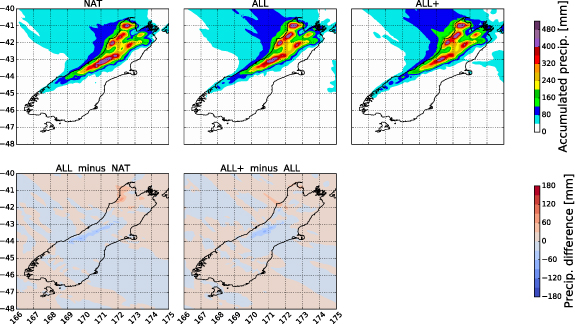
Figure 11. Ensemble means and the differences between them for the NAT, ALL and ALL+ scenario for precipitation accumulated from 15 July 2021, 09 UTC to 18 July 2021, 00 UTC (63 h).
Download figure:
Standard image High-resolution image3.2.1. Estimation of the attributable signal for the Buller precipitation event
For the attribution of this event, the 63 h accumulated precipitation above selected thresholds of 100, 150, 200, and 250 mm has been analysed using the individual and shared masks to quantify the effect of climate change on spatial extend and on intensity of the event. Figure 12 shows the total number of grid points within individual mask defined by the precipitation thresholds (see definition of masks in section 3.1.1). In the ensemble mean, the grid points within a given precipitation threshold increase from NAT to ALL to ALL+ for all but the highest precipitation threshold of 250 mm, where the number of grid points remains constant. Most of the individual ensemble members replicate this behaviour with some variability at the higher thresholds, where the number of grid points is lower by design. The enhanced precipitation on the northern flank and reduced precipitation on the southern flank of the event within a region of significant topography, complicates the interpretation of the change in the number of grid points within a mask, as the amount of precipitation above the highest mountain range is decreased, which is likely the reason that the amount of grid points that receive more than 250 mm of accumulated precipitation remains constant from NAT to ALL to ALL+.
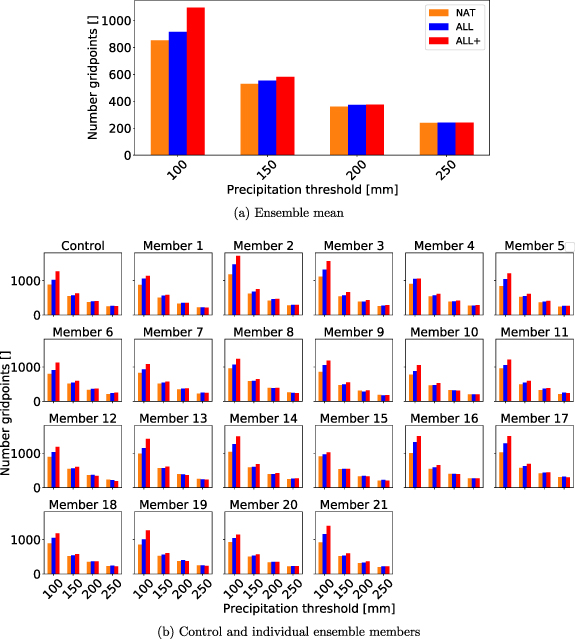
Figure 12. Total number of grid points with 63 h (15 July 2021, 09 UTC–18 July 2021, 00 UTC) accumulated precipitation during the Buller precipitation event exceeding 100, 150, 200 and 250 mm, respectively, across the three scenarios for the ensemble mean (a) and the individual ensemble members (b). Masks used are determined individually for every ensemble member and separately for the ensemble mean.
Download figure:
Standard image High-resolution imageTo analyse how the intensity has changed, the 63 h accumulated precipitation averaged over the shared mask is shown in figure 13. The average precipitation per grid point increases from NAT to ALL to ALL+ for the lower thresholds of 100 and 150 mm. At the higher threshold of 200 and 250 mm, less consistency is found between individual ensemble members such that no clear tendencies from NAT to ALL to ALL+ emerges for these thresholds. Therefore, for this event, we conclude that while climate change led to an increase in the area affected by heavy rainfall and increased the precipitation intensity over locations of moderate intensities, there is no clear climate effect on the most extreme precipitation values.

Figure 13. Average 63 h (15 July 2021, 09 UTC–18 July 2021, 00 UTC) accumulated precipitation for the Buller event within the three scenarios for the ensemble mean (a) and the individual ensemble members (b) based on the shared mask for thresholds of 100, 150, 200 and 250 mm.
Download figure:
Standard image High-resolution image
4. Summary and discussion
This paper presents an attribution system based on a numerical weather prediction model that can be used to evaluate how anthropogenic climate change has affected the severity of a specific EWE. WRF simulations generated for two extreme precipitation events occurring in New Zealand are analysed to provide examples of the functionality. These simulations are performed under three different scenarios based on three sets of boundary conditions, i.e. standard boundary conditions extracted from the GFS global numerical weather prediction model (ALL), naturalised boundary conditions (NAT) which have had the attributable climate change signal subtracted from the GFS fields, and boundary conditions with an added climate change signal (ALL+). The ALL+ ensemble is used to test the robustness of the results for the analysed event. The precipitation events analysed here were selected as they broke records, led to severe impacts and are challenging to attribute using a probabilistic approach to extreme event attribution. We assessed the extent to which the severity of the precipitation occurring in these events was affected by climate change, i.e. the following question is addressed: if the observed synoptic event would have occurred in a world without anthropogenic global warming, how would the magnitude of the precipitation comprising that event have differed? As such, the analysis makes no inferences about changes to the frequency of such events. We test whether the severity of the event has changed by analysing whether (i) the area affected by heavy precipitation and (ii) the precipitation intensity has changed. While for both events we see an impact of climate change on the severity, the results are more robust for the Canterbury precipitation event than for the Buller precipitation event. The robustness of results is tested by checking whether the individual ensemble members show a consistent change signal, and through the analysis of the ALL+ scenario which should present a consistent signal when no significant selection bias affects the simulations.
For one of our case studies we examined the sensitivity to spatial gradients in the imposed delta fields by running the same simulation with delta fields that are constant over the analysis domain. We draw two lessons from this sensitivity test. The first lesson is that spatial morphology of the delta fields applied to the forecast model is material, even if they may not matter to qualitative conclusions. Most forecast-based studies to date have used a single spatially-varying field, whether derived from climate model experiments or observed trends. Our sensitivity analysis demonstrates that the nature of the attributable delta fields can be quantitatively important. The second lesson is that it does not seem reasonable to assume that the estimated attributable change using this forecast-based methodology should be spatially homogeneous at the local scale. Changes in local precipitation efficiencies may have a major role in affecting the local footprint (Pall et al 2017, Wang et al 2022).
For both of our case studies, the location of intense precipitation morphed spatially because of the applied anthropogenic forcing (northward expansion or shift for both events). Does this mean that the event is as different under the NAT scenario that we may not be comparing like with like? We argue it depends on the specific nature of the attribution question (see also Stone et al 2021). If our question would concern the impact at a specific location (e.g. rainfall at a location in the Buller River Basin), then any geographic shift in the location of the event from NAT to ALL presents a selection bias: having selected this location because it is the site of maximum impact, any shift will constitute a shift away from that location and a reduction of the impact at that location. By analysing a region defined by the event itself using masks, as presented above, we can avoid this issue to some extend. If the comparison is not sufficiently like-for-like, then the attribution analysis is biased and flawed. We have attempted to develop protocols for assessing what is 'sufficient', but much work remains to be done. However, we might instead be concerned about how the imprint of a large-scale weather system on New Zealand has been altered because of global greenhouse gas emissions. As an example, we might consider the recent passage of Cyclone Gabrielle just to the north of the country. If it were a smaller system in the natural scenario whilst taking the same track, then the attributable precipitation imprint might present a southward expansion/shift of the area experiencing extreme precipitation. In this situation, an expansion or shift would be an integral part of the answer to our attribution question. This nuanced distinction in interpretation poses a communication challenge as we move this workflow into an informative operational mode.
There are several perspectives on how the forecast-model-based attribution approach contrasts with other attribution methods (Otto et al 2012, National Academies of Sciences et al 2016, Stott et al 2017, Stone et al 2021, 2022). An additional perspective is through analogy and contrast with large-ensemble modelling using global climate models (e.g. for New Zealand, Rosier et al 2015, Harrington et al 2016). Global climate models simulate the global-scale circulation explicitly, but are forced to represent local processes through bulk parameterised approximations. Because of this, they are designed to accurately quantify the attributable change in the likelihood of a type of weather system, but are questionable for estimating the attributable change in local magnitude. The weather forecast-model experiment inverts all of these properties. While the local scale is explicitly simulated, the global scale is, in effect, parameterised with an averaged approximation; it is designed to quantify the attributable change in the local magnitude, but can say nothing about the event's likelihood. Whilst the weather-forecast experiment mimics the 'design storm' method common in catastrophe modelling, it has only recently started being used in event attribution research. Just as it has taken a long time for researchers to understand the limitations of parameterisation schemes in global climate models, we are starting the process of understanding the 'global parameterisations' used in the forecast-model-based attribution methodology.
The EWE attribution system presented here has been developed within the 'Extreme Weather Event Real-time Attribution Machine' (EWERAM) project. The methodology can be applied to produce simulations of a specific weather event under three climate change scenarios and, given the event is robustly represented in all scenarios, an attribution statement can be drafted based on the results. As such, the method could be applied to a different region and using a different model, following careful evaluation of the system's capability within the given region. EWERAM set out to develop a system which could be used in an operational setting after the end of the project (Tradowsky et al 2022). To address the challenges of how such a system should be designed in New Zealand's context, the project included experts from five institutions, which proved to be beneficial in combining different areas of expertise (climate scientists, operational meteorologists, extreme weather specialists), but at the same time led to some challenges in setting up a workflow. While the project has come to an end, the system to produce simulations as presented above is working and there is the ambition to further use the system to analyse events. During that process, we will work through some of the challenges of a timely attribution system, such as how the nuanced results we find can be explained to a lay-audience for which the results of these attribution studies are designed. Similarly to how the knowledge about what is possible in a probabilistic event attribution approach was collected in van Oldenborgh et al (2021), we will gain knowledge about the system with any further event that we are analysing. As such, the time frame needed to produce an attribution statement will likely decrease to provide answers within a time frame that is relevant to interested parties. The need for attribution information has increased over the last few years and we will strive to address attribution questions that are important to decision makers in New Zealand and provide answers that are informative to the needs of New Zealanders.
Acknowledgments
This research was funded by the New Zealand Ministry of Business, Innovation and Employment under the EWERAM project (Contract Number BSCIF1801). We would like to thank Peter Kreft and Mark Schwarz for expert meteorological input/analysis of the events discussed here. Furthermore, we would like to thank the entire EWERAM team and Luke Harrington for useful discussions as part of the expert group meetings. We also acknowledge the Regional and City Councils, FENZ, NIWA and MetService for the provision of observational precipitation data that were used in plots.
Data availability statement
The data that support the findings of this study are available upon reasonable request from the authors. The WRF simulations add up to a significant amount of data and we believe they are better suitable to share after reasonable request to the producer of the data.