

Abstract
The authors investigate the statistical relationships between interannual variations in economic losses from Tropical Cyclones (TCs), basin-wide metrics of TC activity, and indicators of large-scale climate variability in the North Atlantic basin. The results show substantial and statistically significant correlations between the economic losses and some seasonal TC activity metrics, namely the accumulated cyclone energy and power dissipation index. These results suggest that accurate seasonal forecasts of these metrics can be taken as relevant to potential TC losses, even though the metrics in question do not take into account whether storms make landfall, let alone where they do so. The authors suggest that the degree of correlation obtained might be considered a baseline against which to measure some aspects of the performance of catastrophe models.
Export citation and abstract BibTeX RIS

Original content from this work may be used under the terms of the Creative Commons Attribution 4.0 license. Any further distribution of this work must maintain attribution to the author(s) and the title of the work, journal citation and DOI.
1. Introduction
Tropical Cyclones (TCs) are among the most devastating natural hazards, causing catastrophic losses to infrastructures and assets (Mendelsohn et al 2012, Klotzbach et al 2018, Camargo and Wing 2021). Assessing TC risk is important to the reinsurance industry, governments, and humanitarian organizations, among others. Here, by 'risk', we mean the probability of loss of a given magnitude. In this study, we focus on economic losses in the North Atlantic basin.
In the reinsurance industry—and sometimes in other contexts—TC risk is estimated using catastrophe models (e.g. Grossi et al 2005, Michel-Kerjan et al 2013). These models embody what is essentially a Monte Carlo method, in which large numbers of synthetic events (here, TCs) are generated to represent the geophysical hazard, that is, the probability of occurrence of a given wind speed or flood depth (Grossi 2005). These are combined with estimates of exposure (the assets at risk) and vulnerability (the fraction of asset value that will be destroyed if wind speed or flood depth exceeds a given value) to generate desired statistics of loss, such as average annual loss or probable maximum loss. In catastrophe models, only landfalling storms are generally of interest since storms which do not make landfall cause no damage on land.
On the other hand, much effort in academic and government climate science goes into predictions of basin-wide annual statistics of TC activity that are only indirectly, if at all, related to damage. Examples are Accumulated Cyclone Energy (ACE) (Bell et al 2000), the Power Dissipation Index (PDI) (Emanuel 2005), or the number of storms exceeding given intensity thresholds. Climate change studies look at trends in these indices over the historical period (e.g. Emanuel 2005, Vecchi and Knutson 2008, Klotzbach and Landsea 2015, Walsh et al 2016, Kossin et al 2020, Klotzbach et al 2022b, Wu et al 2022) or consider how these statistics may change under various future climate scenarios (Villarini and Vecchi 2013, Bacmeister et al 2018, Villarini et al 2019, Roberts et al 2020), while sub-seasonal and seasonal-to-interannual prediction systems predict them a few weeks or months ahead of time, using either statistical or dynamical models (Chen and Lin 2013, Caron et al 2015, Lee et al 2020, Camargo et al 2021, Befort et al 2022). Many studies have analyzed the relationships of these statistics to some indices of large-scale climate variability, such as the El Niño–Southern Oscillation (ENSO) phenomenon, the North Atlantic Oscillation (NAO), Atlantic Multidecadal Oscillation (AMO), Atlantic Meridional Mode (AMM), etc (e.g. Camargo and Sobel 2005, Zhang and Delworth 2006, Camargo et al 2010, McCloskey et al 2013, Boudreault et al 2017, Chiacchio et al 2017, Patricola et al 2018). Such basin-wide statistics are generally considered easier to predict than TC losses because losses depend sensitively on whether, and if so where, storms make landfall. It is possible for an active season (in terms of basin-wide statistics) to cause relatively small losses. Conversely, a relatively quiet season can cause significant losses if one or two intense storms happen to make landfall in places with large exposure and vulnerability.
A number of previous studies have addressed aspects of the relationships between TC activity, or climate modes that affect it, and losses (Murnane and Elsner 2012, Geiger et al
2016, Klotzbach et al
2022a). These include case studies (Czajkowski and Done 2014); temporal variations in TC losses themselves, or proxies of them and how the rising losses may relate to climate change (Narita et al
2009, Emanuel 2011, Mendelsohn et al
2012, Hsiang et al
2017) or rising exposure (Pielke 2007, Klotzbach et al
2018). Pielke (2007) evaluated future economic losses from TCs for various societal and climate scenarios, while Weinkle et al (2018) compared the normalized and actual historical TCs losses using two different approaches—inflation and wealth per capita methods—for the U.S. from 1900 to 2017. Klotzbach et al (2018) analyzed the relationship between U.S. landfalling hurricane frequency and intensity with hurricane-related damage along the US coast. Klotzbach et al (2020) showed the relationship between surface pressure and normalized hurricane damage. Lavender et al (2022) used climate models to investigate the trends in the number of TCs, ACE, and PDI and how it relates to a proposed damage index called damage potential climate index ( ). These studies have generally focused on long-term trends to assess the relative roles of climate change versus changes in exposure.
Here, we instead quantify to what extent basin-wide statistics of TC activity are associated historically with estimates of economic loss from TCs on an interannual basis—that is, we focus on year-to-year fluctuations rather than on long-term trends. Since basin-wide TC statistics are generally considered more predictable on a range of time scales than losses, this quantification might be useful for risk assessment, particularly to the extent that risk assessment on a seasonal-to-interannual basis is of interest. Our study is most directly comparable to Klotzbach et al (2018), who used composites to examine relationships between modes of large-scale climate variability and TC losses as well as the drivers of long-term trends in losses. Our focus differs in that we investigate the interannual correlations between basin TC activity and losses directly.
We also suggest a test that could be applied to catastrophe models: if given the actual tracks and intensities of all the storms occurring each year over the historical record, can such a model produce a time series of the annual total, basin-wide losses that is better correlated with the actual basin-wide losses than are simple basin-wide TC statistics such as those examined here, even though the latter includes no information about whether, let alone where, any storm made landfall? This would not test the component of the catastrophe model that generates synthetic storm tracks, nor the accuracy of the absolute magnitudes of the losses generated by the model, nor its performance on portfolios smaller than the entire basin. Nonetheless, because basin-wide TC statistics are so much more straightforwardly modeled than losses are, either using statistical or dynamical models—because the TC statistics considered here do not involve exposure, vulnerability, or even the specific properties of the TCs—the answer to this question strikes us as worth knowing. We do not attempt to answer this question here for any catastrophe model. Rather, we examine a number of basin-wide TC statistics from historical data and examine their relationships to historical losses in order to generate the baseline to which a catastrophe model could be so compared. We also include various large-scale climate indices that are known to be related to TC activity in the analysis. These indices are generally considered even more predictable than TC activity is.
2. Data and method
2.1. Loss data
Total economic losses for historical TCs were collected from 1970 to 2020 using two data sources: (a) Emergency Events Database known as EM-DAT (EM-DAT 2021) for all countries surrounding the North Atlantic Basin, and (b) Swiss Re public annual catastrophe reports and their proprietary Catastrophe Database. No loss was reported for the year 1977 or 1986 in the EM-DAT data, nor for 1973, 1977, 1978,1981, or 1986 in the Swiss Re data. We excluded these years from our analysis but verified that assigning values of zero loss to the missing data instead (i.e. assuming that the reason no loss was reported is that none occurred) does not affect the results significantly (not shown). We also collected the normalized U.S. historical TC losses for the period 1987–2017 from Weinkle et al (2018), who studied hurricane losses in the period 1900–2017 after applying the normalization approach proposed by Pielke and Landsea 2018 (CL18) (Pielke and Landsea 1998) to adjust historical loss data for inflation, per-capita wealth, and population of the affected counties.
2.2. TC metrics
The TC metrics given in tables S1 and S2 were calculated using the National Hurricane Center Atlantic hurricane best-track dataset (Landsea and Franklin, 2013) for 1970–2020. These data include only TCs; extratropical storms are not included and were not considered in this study. Various metrics of TC activity were considered, including the number of storms in various categories on the Saffir-Simpson scale, the number of days with active storms for specific categories, Accumulated Cyclone Energy (ACE; Bell et al
2000), and the Power Dissipation Index (PDI; Emanuel 2005), which are integrated measures of TC frequency, duration, and intensity. The ACE index for a basin is defined as the sum of the squares of the estimated 6-hourly maximum sustained surface wind speeds in  for all TCs in the basin with tropical storm intensity or greater (i.e., 34 kt or higher, tropical depressions not included) summed over all 6-h periods that the windspeed is ⩾ 34 kt. Similarly, the PDI is calculated in a similar manner, but using the cube of the wind speed instead of the square.
Herein, landfall was assessed by applying a 0.18 degrees latitude and longitude land–sea mask and counting the number of storms that crossed from ocean to land between  and
and  N, and
  W (Nakamura et al
2009). We calculate landfall ACE and landfall PDI, considering three definitions: all landfalling storms and all landfalls (ALL landfall ACE and PDI), only the storms and landfalls that occur at tropical storm intensity or higher (TS landfall ACE and PDI), and maximum value (maximum landfall ACE and PDI), which only considers the landfall with maximum intensity for each storm. Note that in the first two cases, we include multiple landfalls for each storm (including those with wind speed lower than 34 kt in for the 'ALL' case), while the latter considers only a single landfall per storm.
W (Nakamura et al
2009). We calculate landfall ACE and landfall PDI, considering three definitions: all landfalling storms and all landfalls (ALL landfall ACE and PDI), only the storms and landfalls that occur at tropical storm intensity or higher (TS landfall ACE and PDI), and maximum value (maximum landfall ACE and PDI), which only considers the landfall with maximum intensity for each storm. Note that in the first two cases, we include multiple landfalls for each storm (including those with wind speed lower than 34 kt in for the 'ALL' case), while the latter considers only a single landfall per storm.
To explore the relationship of the TC metrics and losses with climate, we consider multiple standard climate indices, which are well known to be associated with Atlantic hurricane activity, relating the ENSO and Atlantic variability at various timescales to Atlantic hurricane activity (e.g. Boudreault et al 2017). The climate indices used are listed in table S3 and were considered for the peak of the hurricane season, August to October (ASO).
The Niño3.4 index (Barnston et al 1997) is a standard index for ENSO and was downloaded from the Climate Prediction Center (CPC) website at: www.cpc.ncep.noaa.gov/data/indices/ersst5.nino.mth.91-20.ascii. The time-series AMO, also known as Atlantic Multidecadal Variability or AMV (e.g. Enfield et al 200; Ting et al 2011) dataset was obtained from https://psl.noaa.gov/data/timeseries/AMO/. Similarly, the AMM; Vimont and Kossin, 2007 data used for the analysis was collected from https://psl.noaa.gov/data/timeseries/monthly/AMM/. The main development region is defined as the mean Sea Surface Temperature (SST) limited by 10∘ N, 25∘ N, 80∘ W, and 20∘ W and was calculated using the SST dataset https://iridl.ldeo.columbia.edu/. Moreover, the data for NAO was obtained from https://psl.noaa.gov/data/20thC_Rean/timeseries/monthly/NAO/.
2.3. Correlation analysis
We calculated the Spearman's rank correlation coefficients (ρ) (Spearman 1904) between the historical loss data and each of the basin-wide TC metrics, landfalling TC metrics, and climate indices for the North Atlantic basin. We also calculated the Kendall rank correlations (Kendall 1938) and the Pearson correlations (Pearson, 1895) between the same variables; the results of the latter are presented in the Supplementary Information. As the sample size for these analyses is small, we used a non-parametric Mann-Whitney U test to evaluate whether the variables exhibited statistically significant correlations at the 95% confidence level (Mann and Whitney 1947).
3. Results
Figure 1 shows time series of basin-wide economic losses from TCs in the North Atlantic Basin from EM-DAT and Swiss Re for 1970–2020. The two datasets provide similar results (less than 10% difference) for most years in the study period. There are a few years in which the difference exceeded this threshold, e.g. 2012. Possible reasons for this difference are uncertain and could be associated with data collection methods and/or considering the insured and uninsured losses. Hereafter, we show only results obtained using the EM-DAT data. We also performed a least-squares linear trend analysis over these datasets to evaluate the temporal trend in losses over the Atlantic basin. The statistical significance of this analysis was also reported at the 5% level. As shown in this figure, there is a significant increasing trend in the basin-wide losses when no normalization is applied. The same analysis was performed for historical U.S. losses, presented in the Supplementary Information.
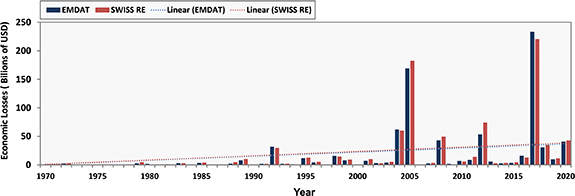
Figure 1. Comparison of economic losses caused by TCs for the North Atlantic basin from 1970 to 2020 according to EM-DAT and Swiss Re.
Download figure:
Standard image High-resolution imageFigure 2 shows Spearman rank correlations between the EM-DAT loss dataset and (a) the TC metrics for the whole basin, (b) the climate indices, and (c) the landfalling TC metrics, all for the North Atlantic basin and the period 1987–2020. Figure 2(a) demonstrates a significant correlation between losses and both ACE and PDI at the basin scale, with  values of 0.73 and 0.70, respectively. Figure 2(c) shows significant correlations, with
  values around 0.7, between losses and the landfalling TC metrics. Figure 2(b) also demonstrates a significant correlation, with a
  of 0.53, between losses and AAM. The correlations between the losses and the other climate indices are low and statistically insignificant.
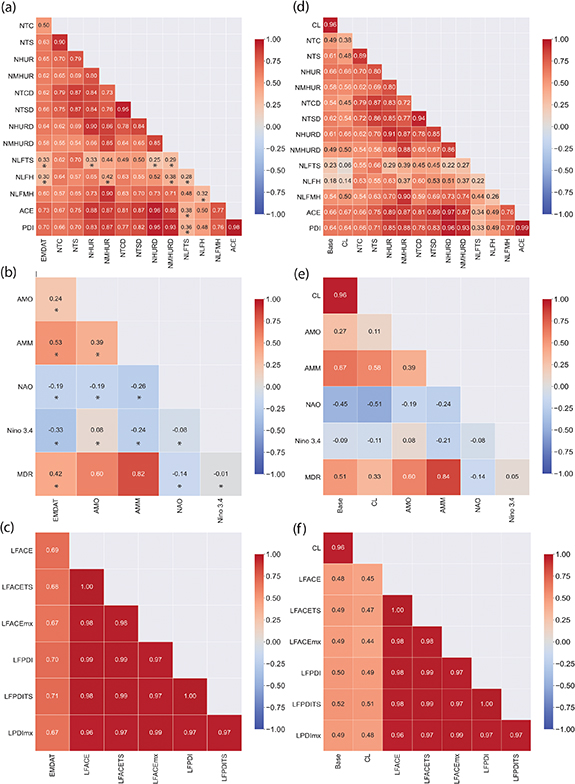
Figure 2. This figure shows the spearman correlation for the EM-DAT North Atlantic basin losses and: (a) TC metrics, (b) climate indices, and (c) landfalling TC metrics for the period of 1987–2020. All the variables are statistically significant (p-value < 0.05) except for the ones with a star. Also, we performed spearman correlation for the EM-DAT (base) and normalized (CL) U.S. losses from Weinkle et al (2018) and: (d) TC metrics, (e) climate indices, and (f) landfalling TC metrics for the period of 1987–2020. The definitions of the variables in this figure are presented in the
Download figure:
Standard image High-resolution imageSince reported basin-wide losses are not normalized to consider the effect of rising exposure, we also investigated how using normalized rather than absolute losses affects these correlation values. As coastal communities experience population growth and economic development (Hemmati et al 2020, 2021a, 2021b), the same TC can be expected to cause more significant losses now, in general, than if it occurred in the past. Since normalized losses for the whole North Atlantic basin are not available, and the U.S. reported losses constitute 93.5% of the total North Atlantic Basin's losses (EM-DAT), we performed the Spearman rank correlation using the normalized U.S. historical losses from (Weinkle et al 2018) as well as absolute U.S. historical losses from EM-DAT. Figures 2(d)–(f) show the correlations between the normalized U.S. economic losses and (d) the TC metrics for the whole basin, (e) climate indices, and (f) landfalling TC metrics from 1987 to 2020. As comparisons between these and figures 2(a)–(c) demonstrate, normalizing the losses affects Spearman's rank correlation coefficients somewhat differently in each case. For instance, this coefficient remains the same for PDI, increases for ACE, and decreases for the number of tropical storms and hurricanes with normalizing economic losses. The correlations between losses and both climate indices and landfalling TCs metrics drop when considering normalized compared to absolute losses. However, normalization does not change the results dramatically, as correlations between normalized U.S. losses and several TC metrics, such as ACE and PDI, remain significant.
Figure 2 also revealed the correlation between various TC metrics for the whole basin, the climate indices, and the landfalling TC metrics. For instance, figure 2(a) shows a significant correlation between ACE or PDI and the number of days with hurricanes active (NHURD). This relation is clear in figure 2(c) among the TC metrics for the U.S. as well. Comparison of figures 2(a)–(c) and (d)–(f) implies that the Spearman's rank correlation coefficient changes spatially among various as it may remain constant, increase, or decrease by changing the study domain from the whole Atlantic basin to the U.S. Moreover, figure 2 demonstrated that years with greater basin-wide TC activities are more likely to have major landfalling hurricanes that cause severe losses as there is a high correlation among ACE or PDI and the number of landfalling storms with major hurricane intensity (NLFMH).
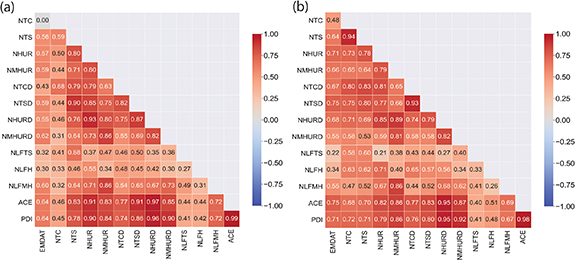
Finally, we performed a sensitivity analysis of the start date used to define the study period. Figure 3 shows the Spearman rank correlations between the EM-DAT losses and the TC metrics for different periods of 1970–2020 and 2000–2020. As demonstrated, the Spearman correlation coefficient of losses and ACE and PDI changes from 0.64 to 0.75 and 0.71, respectively, by changing the start date from 1970 to 2000. It should be noted that although there is a significant correlation between the number of TCs (NTC) and losses for 2000–2020, the analysis demonstrated no correlation among these variables for the period of 1970–2020. Based on the analysis, there is a significant negative correlation between NTC and losses for the period of 1970–2000 and its combination with the data from 2000–2020 resulted in this point. Our analysis has shown that this negative correlation between the loss and NTC from 1970–1990 can be associated with an incomplete database or lack of landfalling storms with substantial damages.
Figure 3. Sensitivity analysis for the whole basin TC metrics with respect to start date of dataset for the periods of: (a) 1970–2020, and (b) 2000–2020.
Download figure:
Standard image High-resolution image
4. Conclusions
In this study, we have investigated statistical relationships between historical economic losses due to TCs and metrics of TC activity for the whole North Atlantic basin (including storms which did not make landfall), as well as the same metrics computed just for landfalling storms. Also, we investigated the relationships between the losses and several climate indices thought to be relevant for North Atlantic TC activity. We performed three types of correlation analysis, computing the Spearman's rank correlation (presented in the main manuscript) and the Kendall and Pearson correlations (presented in the Supplementary Information).
The analysis showed a significant correlation ( of around 0.7) between the basin-wide ACE and reported losses from 1987 to 2020. PDI also has a significant correlation (
 of around 0.7) with the reported losses. These results imply that greater losses can be expected in a more active TC season than in a less active one. This result might be considered intuitive, but it is not obvious, in fact, given that many storms do not make landfall, and those that do may either strike areas in which exposure and/or vulnerability are high or low, factors not captured at all by the TC or climate metrics. Among the TC metrics considered, ACE and PDI are the two that are most highly correlated with the losses (ρ values around 0.7) compared to all other TC metrics, including the number of tropical storms and hurricanes, and the number of hurricane days, etc.
This study implies that seasonal forecasts of TC activity, in as much as they have some skill in predicting some of the basin-wide TC metrics considered here, can also, to some extent, be considered forecasts of economic losses from TCs. While, again, this is intuitive, we had not seen it demonstrated quantitatively.
As discussed in the introduction, the results also could be used as a baseline against which to measure the skill of catastrophe models. If given the tracks and intensities of all storms in the basin each year, we expect that the model should be able to produce a time series of total economic losses that is more highly correlated with the time series of actual reported losses than are simple basin-wide metrics such as PDI or ACE, as the latter includes no information about where or even if any storm made landfall. Because of uncertainties associated with exposure, vulnerability, and the particular hazards associated with each storm (e.g. the precise structure of the wind field, flooding, etc.) it is not entirely obvious that this will always be the case, or to what extent, and it strikes us as an interesting question.
Acknowledgment
This research has been supported by the 'Swiss Re Foundation' with Project ID 6437.
Data availability statement
The U.S. normalized losses used in the analysis of this paper is obtained from (Weinkle et al 2018) which is accessible through https://doi.org/10.1038/s41893-018-0165-2. The data that support the findings of this study are available upon reasonable request from the authors.
: Appendix
Table S1. Basin-wide TC metrics.
| NTC | Number of Tropical Cyclones (NTC) includes tropical depressions, tropical storms and hurricanes. |
| NTS | Number of Tropical Storms and Hurricanes |
| NHUR | Number of Hurricanes (cat 1–5) |
| NMHUR | Number of Major Hurricanes (cat 3–5) |
| NTCD | Number of days with tropical cyclones active |
| NTSD | Number of days with tropical storms and hurricanes active |
| NHURD | Number of days with hurricanes active (cat 1–5) |
| NMHURD | Number of days with major hurricanes active (cat 3–5) |
| NLFTS | Number of landfalling storms with intensity of tropical storm or higher |
| NLFH | Number of landfalling storms with hurricane intensity (cat 1–5) |
| NLFMH | Number of landfalling storms with major hurricane intensity (cat 3–5) |
| ACE | Accumulated cyclone energy |
| PDI | Power dissipation index |
Table S2. Landfalling TC metrics.
| LFACE | ACE at landfall for all storms and landfalls (includes all landfalls if a storm has multiple landfall) |
| LFACETS | ACE at landfall only for storms that make landfall as tropical storm or hurricane intensity (includes all landfalls from a storm) |
| LFACEmx | ACE at the landfall of maximum intensity for each storm (one landfall per storm) |
| LFPDI | PDI at landfall for all storms and landfalls (includes all landfalls if a storm has multiple landfall) |
| LFPDITS | PDI at landfall only for storms that make landfall as tropical storm or hurricane intensity (includes all landfalls from a storm) |
| LPDImx | PDI at the landfall of maximum intensity for each storm (one landfall per storm) |
Table S3. Climate indices.
| AMO | Atlantic Multidecadal Oscillation |
| AMM | Atlantic Meridional Mode |
| NAO | North Atlantic Oscillation |
| Nino 3.4 | Nino3.4 anomalies |
| MDR | Atlantic Main development region (MDR) SST |
Supplementary data (0.7 MB PDF)