

Abstract
Plastic waste is one of the most pressing global environmental challenges. As the world's largest plastic waste generator and importer, China has implemented various policies to promote sustainable plastic waste management. However, the quantitative understanding of China's application-specific plastic waste recycling and its infrastructure development is still quite limited. Here, we build up a unified framework to investigate the recycling and the corresponding infrastructure status of five commodity plastics in China, which are polyethylene, polypropylene, polyvinyl chloride, polystyrene and acrylonitrile-butadiene-styrene (PE, PP, PVC, PS, ABS) from 2000–2019. We find that: (1) in total, China consumed around 981.4 million tons (Mt) of the five commodity plastics from 2000–2019, generating 590.4 Mt of plastic waste, only 27% of which was recycled, 34% was landfilled and 32% was incinerated; (2) PP (∼30%) and PE (∼28%) have the highest recycling rate in China, which is related to their huge consumption base, while PS and ABS have the lowest recycling rate at only ∼26%; (3) the waste recycling performance is determined by its applications, and the worst recycling rates (<20%) are the packaging and commodity sectors due to their poor collection, while higher recycling rates (⩾30%) are found in the building and construction, agriculture and transportation sectors due to the special waste collection systems in these sectors; (4) our further examination of the recycling potential reveals that around 56% of packaging waste can be recycled by adjusting waste management infrastructure (in the collection, pre- and end-processing). Our results can help bridge information gaps and support policymaking to improve sustainable plastic waste management.
Export citation and abstract BibTeX RIS

Original content from this work may be used under the terms of the Creative Commons Attribution 4.0 licence. Any further distribution of this work must maintain attribution to the author(s) and the title of the work, journal citation and DOI.
1. Introduction
Plastics are important polymer compounds synthesized from monomers and have contributed to great convenience in modern society (Laskar and Kumar 2019). China, as the world's largest producer and consumer, plays an important role in the global plastic value chain. Specifically, polyethylene (PE), polypropylene (PP), polyvinyl chloride (PVC), polystyrene (PS) and acrylonitrile-butadiene-styrene (ABS) are the main five commodity plastic materials, which account for 68% of China's total plastic demand (China Plastics Processing Industry Association 2018), each of whose five commodity plastics has become fundamental necessities in daily life for various applications, such as packaging, transportation, agriculture, building and construction (B&C), etc (Gu et al 2017). Due to the complexity and difficulty of plastic recycling, the rapid increase in plastic consumption is accompanied by large amounts of plastic waste generation. At the end of the plastic life cycle, plastic waste can cause serious environmental consequences and severe health risks to humans, making it one of the most pressing environmental challenges (Ma et al 2020).
China is considered one of the largest contributors to the final disposal of plastic waste and these disposal processes bring about environmental pollution (Jambeck et al 2015). To address these pressing waste issues, China has introduced a series of policies to regulate domestic plastic waste (GOCSC 2017, NDRC 2021). In 2020, the Ministry of Ecology and Environment and National Development and Reform Commission released suggestions on further strengthening the treatment of plastic pollution (NDRC 2020) to emphasize the need for systematic improvement of recycling to tackle plastic waste issues. An in-depth understanding of waste recycling of specific plastic types and adjustment of basic recycling infrastructure is urgently needed to improve the implementation of these policies and plastic life cycle management in China (Hamilton et al 2019).
Plastics recycling is considered an efficient way to reduce plastic emissions, and has attracted growing attentions in terms of informing and guiding plastic waste management (Hopewell et al 2009). Recycled plastics can be used as renewable alternative materials to reduce the use of raw materials (Gu et al 2017). On a global scale, plastics recycling remains at a relatively low level with only 9% of plastic waste having been recycled in 2015 (Geyer et al 2017). For plastic packaging, only 14% of waste has been collected, and even less can get into the subsequent processes including the pre- and end-processing (Ellen McArthur Foundation 2016). There are also some studies on plastic recycling in developed countries and regions (Plastics Europe 2019, Faraca and Astrup 2019). About 40% of post-consumer plastic packaging can be recycled due to the new separate collection policy in Finland (Dahlbo et al 2018). EU directives also show that the high plastic concentration in waste electrical and electronic equipment highlights the value of recycling (Buekens and Yang 2014). Recycling performance is mainly dependent on the processing capacity and technology level of waste management infrastructure.
As the largest plastic waste generator, China has built some basic recycling infrastructure to produce the second plastic materials. Some studies show that the overall recycling rate of plastics reaches about 30% (Luan et al 2020). However, plastic recycling performance of specific plastic types in different applications has not been well explored in China due to its data being quite limited. At present, plastic life cycle quantification and recycling rate estimation are acquired by the statistics department without distinguishing the different applications and plastic types, which hampers the exploration of specific plastic recycling and adjustment of respective waste basic infrastructure (Goran et al 2010, Millette et al 2019). Thus, there is a need to introduce first-hand data and a quantification framework for each specific plastic type to bridge the data gaps and enrich the foundation of each plastic waste quantification and management.
To fill these gaps, this study aims to develop a unified quantification framework to identify the recycling status and potential of plastic waste systematically, and improve the waste management systems of five commodity plastics (i.e. PE, PP, PVC, PS, and ABS) to: (a) estimate the recycling performance of the different applications of plastics and seek the weak links restricting the recycling ability; (b) use recycling data to account for the plastic stocks and flows from 2000–2019; (c) evaluate the recycling potentials of the plastics by adjusting recycling infrastructure; (d) put forward the strategies of the current waste management system according to the quantitative analysis results. Accordingly, the remaining structure of the paper consists of the following sections: section 2 describes the estimation of the recycling rate and data sources; section 3 presents the main results related to the recycling flows and status; section 4 mainly summarizes the challenges, potential and strategies of plastic waste management; in section 5, the conclusions are reached and policy recommendations for sustainable life cycle management are provided.
2. Materials and methods
2.1. Framework
We build a framework to estimate the recycling rate for different types of plastics in different applications and quantify the plastic metabolism for life cycle management. The system boundary is shown in figure 1; the spatial boundary is the geographical border of Mainland China, and the temporal boundary is 2000–2019. Five types of commodity plastics (i.e. PE, PP, PVC, PS, and ABS) have been investigated in this study. Plastic products include films, bottles, injection products, containers, tubular materials, etc. The recycling of plastics waste includes a series of key procedures from collection and separation to recycling. To better verify the recycling rates of plastic waste, the collection, pre- and end-processing stages have been investigated in this study (as shown in the top of figure 1). The material cycle of plastic is divided into five life cycle stages, including production, fabrication, manufacturing, use and waste management. Based on recycling estimation and life cycle quantification, life cycle management has been put forward (as shown in the bottom of figure 1).
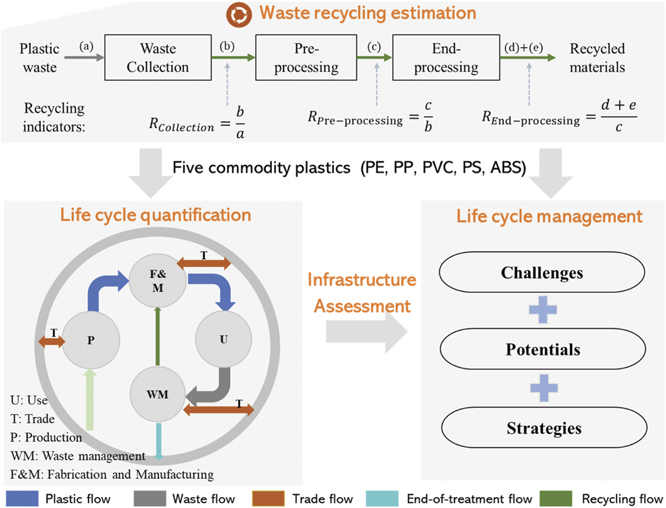
Figure 1. Definition of a recycling process with respect to the plastic life cycle. Light blue lines denote the input and output of waste plastics under different processes. (a) End-of-life (EOL) products; (b) collected EOL products; (c) recycled EOL products; (d) recycled EOL products used in fabrication; (e) recycled EOL products used in production. Gray hollow cycle denotes the plastic life cycle (including production, fabrication, manufacturing, use, waste management and trade), and the description of each stage can be found in the supporting information (https://stacks.iop.org/ERIS/2/025002/mmedia) (figure S1).
Download figure:
Standard image High-resolution image2.2. Estimation of plastic recycling rate
Recycling is an important link to close the plastic cycle loop but is hard to be measured due to the lack of information related to the waste management system. At present, in China, there is a lack of a unified framework and ample data sources to clarify the present recycling status and challenges of plastic waste. The previous recycling rate is generally estimated using the following approach: recycling rate = waste collected/waste generation, which does not consider the loss entering the recycling facility. They cannot show the recycling status and provide the corresponding suggestions for different plastic types (Chen et al 2019, Liu et al 2020). Here, we follow the framework of Graedel (2011), Reck and Graedel (2012) and Ciacci et al (2015) to divide the waste management system into three sub-stages including collection, pre- and end-processing. Collection refers to the transfer of EOL products from the consumers to a suitable recycling facility; pre-processing refers to the treatment of the above-mentioned waste by sorting, separation, shredding and cleaning; end-processing is transferring the above-mentioned pretreated waste to secondary materials through melting, extrusion and pelletizing (figure 1). The overall recycling rate is calculated by multiplying the efficiencies in those three sub-stages (Graedel 2011):

Here, RCollection is the collection rate (CR); RPre_processing is the pre-processing rate (PR); REnd_processing is the end-processing rate (ER).
To improve the result of the recycling rate estimation, we trace the efficiency rates of each application for each type of plastic. Application areas have been divided into seven categories, including B&C, transportation, electronics, packaging, agriculture, commodity, etc. Around 115 processes (5 × 7 × 3) were assessed in total.
2.3. Plastic life cycle quantification
To better distinguish the detailed situation of plastic recycling for each of the five plastic types, we conduct a dynamic material flow analysis from 2000–2019 as a case study. The material cycle of plastic is divided into five life cycle stages, including production, fabrication, manufacturing, use and waste management (figure 1).
The production stage starts with the processing of fossil fuels (i.e. oils, natural gas and coal) to monomers, e.g. ethylene, propylene and butadiene. The monomers are then processed into polymers. Next, polymers are fabricated into semi-finished products through different production processes, including blow, injection, extrusion and other fabrication processes. Outflows of these processes are converted into specific plastic products and then consumed by various in-use sectors and applications, including B&C, transportation, electronics, packaging, agriculture, commodity etc. The inflows and outflows of those stages all follow equation (2), which is performed under the principle of mass balance (the total flows entering each stage should be equal to the total flows leaving):

Here, i denotes the index for each of the life stages; Pj
denotes the index for each type of plastic, including PE, PP, PVC, PS and ABS; z denotes the index for each year from 2000–2019;  is the plastic j contained in material flow demand by life stage i to be produced for year z;
  is the import of plastic j embodied in plastic commodities in stage i for year z;
  is the plastic j contained in final products generated from stage i to the consumption for year z;
  is the export of plastic j embodied in plastic commodities in stage i for year z;
  is the loss of plastic j in stage i for year z.
2.4. Data sources and uncertainty analysis
Various data is needed to estimate and quantify the recycling rate and characteristics of plastics in their whole life cycle. Meanwhile, data gaps exist in the estimation of recycling. Our quantification is supported by collecting and synthesizing various data from survey data, statistical yearbooks, industry reports, published books, scientific literature, etc. The data of the collection of different plastic types in packaging and commodity is obtained by sampling and sorting municipal solid waste (MSW), and the CRs are 20% for PE, PP, PVC, PS and ABS. The sampling methods can be found in the supporting information (S1.2). The CRs in other applications are obtained from Buekens and Yang (2014), Duan and Li (2016), MARA (2017), Sooa et al (2017) and Sormunen and Kärki (2019b). The corresponding data in the pre- and end-processing is obtained from Faraca et al (2019a) and Faraca et al (2019b). Considering the various collection strategies used in the collection phase (mixed collection, separated collection, etc), we mainly obtain the collection data from domestic literature and reports, while the processing phase is similar across countries, and the process data lacking in China refers to that of other countries. The detailsare shown in table 1.
Table 1. The data sources for recycling estimation.
| Application | References |
|---|---|
| Packaging | Field data acquisition; (López et al 2011, Briassoulis et al 2013); (Horodytska et al 2018) |
| Agriculture | (Horodytska et al 2018); (Shonfield 2008, WRAP 2009, Ragaert et al 2017) |
| Commodity | Field data acquisition; (Horodytska et al 2018) |
| B&C | (Gu et al 2017, Sormunen and Kärki 2019a) (Rigamonti et al 2014, Duan and Li 2016) |
| Transportation | (Finnveden et al 2000, Shonfield 2008) (Kreißig et al 2010) |
| Electronics | (Buekens and Yang 2014) (van Velzen 2014) |
| Others | (Horodytska et al 2018) (Takou 2017) |
The detailed description of type-specific recycling data collected can be found in the supporting information (tables S1–S5).
In general, the total production and consumption of plastics, as well as the different applications of plastic products, are taken from the China Plastics Industry Yearbook (China Plastics Processing Industry Association 2018). The share and amount of plastics are taken from the China Chemical Industry Yearbook (China Petroleum and Chemical Industry Association 2018). The imports and exports of plastic products are taken from the United Nations commodity trade statistics database by different coefficients (UN Comtrade 2016). The data for landfill and incineration of plastic waste is taken from data sets on the landfill and incineration of MSW (Ministry of Housing and Urban-Rural Development P R C 2020).
Similar to other material flow analysis studies, our results are inherent with considerable uncertainties, which are treated through the following two steps: first, we allocate the uncertainty levels for each input parameter according to the degree of confidence based on its corresponding data sources, which are graded into three levels, i.e. low, medium and high with coefficients of variation of 2%, 5% and 10%, respectively (Buchner et al 2015, Liu et al 2019); second, we perform Monte Carlo simulation 100 000 times to assess the potential ranges of our results.
3. Results
In this section, we apply the unified framework to map China's plastic recycling flows from 2000–2019 using the estimated recycling data for different applications, and then explore the weak links influencing plastic recycling. Finally, we analyze the consumption of downstream applications for recycled plastics, and compare the current processing and recycling capacity of plastics in China.
3.1. Plastic stocks and flows from 2000–2019
We collect the production and consumption data of the five commodity plastics from 2000–2019 to analyze the material metabolisms (figure 2). The polymer amounts produced from China and from other countries are around 684.6 and 284.7 Mt, respectively, with 3.6% of them (34.9 Mt) lost in the production process. The total production of resins is 934.3 Mt, and the resin amounts of PE, PP, PVC, PS and ABS are about 321.9, 261.6, 222.2, 59.1 and 69.5 Mt, respectively. Combined with the recycled amounts (162.2 Mt), the total consumption of the five commodity plastics is around 1096.5 Mt. In the fabrication and manufacturing stage, extrusion molding is the main technology used to process plastic products (400.9 Mt of plastics can be processed), followed by injection and blow molding. About 12.1 Mt of plastics has been released into the environment due to the varying quality of the plastic processing equipment in the enterprise. Among the products, around 102.8 Mt of plastic products are exported to other countries in various forms (e.g. packaging materials, electronic products, building materials, etc). About 981.6 Mt is consumed domestically. It is estimated that 447.3 Mt of plastics accumulates in stock, and the in-use stock of packaging, agriculture, commodity, B&C, transportation, electronics, etc is about 81.6, 34.5, 23.8, 167.2, 47.6, 72.8 and 19.8 Mt, respectively.

Figure 2. China's five commodity plastics material flow analysis from 2000–2019. Values are in 106 tons (Mt); the colors of flows indicate the different stages in the plastic life cycle; the sizes of the flow arrows are proportional to the magnitudes of the flows.
Download figure:
Standard image High-resolution imageThe waste amounts generated from China and other countries are around 534.2 and 56.2 Mt, respectively. Of the total plastic waste generation (590.4 Mt), about 27% has been recycled, 34% landfilled, 32% incinerated and 6% mismanaged. To be specific, it is estimated that 162.2 Mt of plastic waste has been recycled, around 191.4 Mt of plastic waste has been incinerated and 200.3 Mt of plastic waste has been landfilled, while the mismanaged amount of plastics is estimated to be around 36.5 Mt. Here, mismanaged waste includes littering, illegal treatment (open burning and dumping), accidental release, etc. Notably, around 80% of imported waste can be recycled as secondary materials due to the limitation of technology level. According to the uncertainty analysis, it is found that the relative uncertainties in our results remain within the range from 0.8%–3.6%, which is acceptable for plastic stocks and flows quantification. Nevertheless, further investigation is highly recommended if new reliable data sources emerge.
3.2. Plastic recycling performance in China
Figure 3 shows that the average recycling rate of the five commodity plastics is about 27%, of which the recycling rate of PE, PP, PVC, PS and ABS accounts for about 28%, 30%, 27%, 26% and 26%, respectively. As the most produced and consumed type of plastic, most of PE and PP have been recycled owing to their huge consumption base. The recycling rates of PS and ABS are lower than those of PP and PE. However, with the development of reverse logistics on household appliances and automobile areas, recycling rates of PS and ABS are also increasing. In addition, the recycling rate is relatively high in the transportation and agriculture sectors with their recycling rate reaching over 40% due to bulky waste, which is easy to collect and process. Relatively low recycling rates are found in the packaging and commodity sectors. The recycling rate of PVC is 27%, and it is widely used in the B&C sector. The supplementary results also show the application-specific CR, pre-processing and ER of five commodity plastics (figure S2). It is evident that the PR of PVC is higher than that of PE and PP, and its PR reaches 90%. In the end-processing stage (melting, adding the additives, and pelleting), its rate is ranging from 68%–77%, while PVC has the lowest ER due to the strong processing smell. Luan et al estimated the overall recycling rate using the MFA methods with the rate reaching 32%, and the value is higher than the average type-specific recycling rate (Luan et al 2020). In addition, Liu et al also applied the MFA to estimate the rate of PVC (25.5%), which is similar to our results (26%) (Liu et al 2020). The comparison shows that the type-specific recycling rate of plastic waste was more accurate.
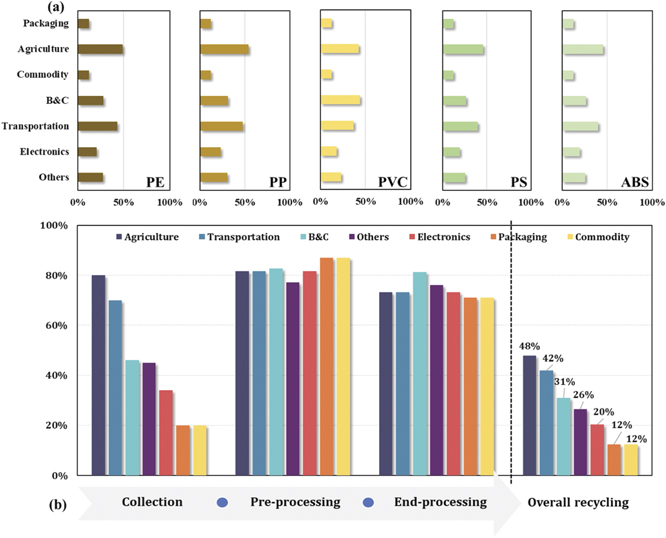
Figure 3. Type-specific recycling rate of plastic waste and three important links about overall plastic recycling in China. Figure 3(a) shows the recycling rate of different types of plastic in different applications. Dark brown bars denote the recycling rate of PE in different applications, light brown bars denote the recycling rate of PP in different applications, bright yellow bars denote the recycling rate of PVC in different applications, green bars denote the recycling rate of PS in different applications and light green bars denote the recycling rate of ABS in different applications. Figure 3(b) shows the CR, PR, ER and overall recycling rate of the five commodity plastics in different applications.
Download figure:
Standard image High-resolution imageThe recycling is largely determined by the weakest link through equation (2), and it will influence the overall recycling status. Figure 3(b) shows the CR, PR, ER and recycling rate of the five commodity plastics in different applications. The applications with the lowest CRs that do not exceed 20% are packaging and commodity, and the application with the highest CR is agriculture (80%). The PRs and ERs show an overall good situation in all applications (rates >70%). To create a useful comparison among different applications, we divide the applications into three main categories according to the different recycling rates of plastic waste: (1) applications with recycling rates <20% (worst situation); (2) applications with recycling rates ⩾20% and ⩽30% (fair situation); and (3) applications with recycling rates >30% (better situation). In the first category, there are two applications, packaging and commodity, which represent the worst situation, considering the poor collection system and most of the low-value plastic waste that entered the MSW system and were transported to landfill or incineration plants. Two applications—electronics and others—belong to the second group, showing a fair condition, and their recycling needs to meet the new and more ambitious recycling target in the current management system. In the last category, B&C, transportation and agriculture present a relatively satisfactory situation as they have already achieved recycling rates of 31%, 42% and 48%, respectively, because they have special collection and recycling systems and allow more bulk waste to be better recycled.
3.3. Applications of plastic waste in China
The cumulative recycled amount of the five commodity plastics is around 174.8 Mt from 2000–2019, of which 32% comes from imported plastic waste and 68% is domestically recycled plastics. At present, recycled plastics are mainly used together with primary raw materials to produce plastic products due to limited plastic recycling and processing infrastructure. The recycled waste can be used to produce films, injection products, containers, tubular materials, wiredrawing, coatings, cables, etc (figure 4(a)). Recycled plastics are most widely used in film and injection products, accounting for 36% and 28%, respectively, followed by containers (12%) and tubular materials (12%). Figure 4(b) shows that East China (23%), South China (21%) and North China (20%) are the three major regions of recycled plastic consumption. According to the report released by the China Resources Recycling Association (2019), with increasing interests due to the investment attraction policy and the improvement of recycling facilities, the plastic products industry is expected to move to the central region in the future.
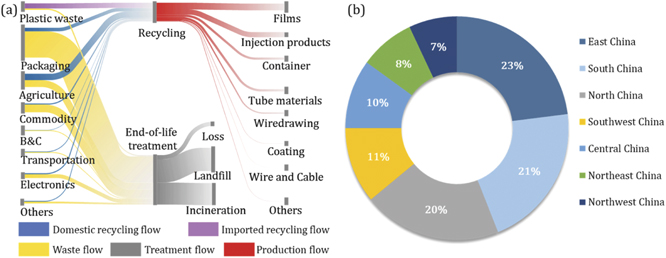
Figure 4. Downstream applications and consumption of the recycled five commodity plastics from 2000–2019. Unit: Mt.
Download figure:
Standard image High-resolution image3.4. Plastic recycling change due to the trade ban
Imported recycled plastics along with domestic recycled plastic waste (figure 2) is used in the fabrication process for producing plastic products. Imported plastic waste is an important source of materials for the plastic recycling industry, but the import ban imposed in 2017 had an immediate effect on China's trade structure (GOCSC 2017, Liang et al 2021). Figure 5 shows that the total recycled amount increased steadily from 2000–2017, and the total recycled amount increased from 2 to 13 Mt. Since imported waste dropped sharply in 2018, there has been a decline in the total recycled amount to 10.5 Mt, creating an import gap (due to a shortage of imported plastic waste produced for secondary plastic products, domestic waste plastics needs to be recycled to make up the gap) and causing a shortage of recycled plastics. Improving the domestic recycling system, especially recycling infrastructure, has become the main solution to make up for the gap in plastic recycling resulting from the import ban. However, current waste recycling mainly depends on informal recycling facilities that bring some environmental impact (China Resources Recycling Association 2019). China's plastic waste management systems should be further established to increase recycling transparency and reduce informal recycling by waste-pickers.

Figure 5. Domestic and imported recycling and downstream applications of the five commodity plastic waste. Unit: Mt.
Download figure:
Standard image High-resolution image3.5. Plastic waste treatment capacity in China
The recycling performance and processing capacity of the enterprise are important indicators when it comes to improving the waste management infrastructure. Figure 6(a) shows the comparison of the waste generation, recycling, and processing capacity from 2010–2019. Data on the capacity is taken from a report from the China plastic recycling industry (China Plastics Processing Industry Association 2018). Before 2018, the processing capacity of plastic for formal recycling facilities in China was much lower than domestic waste generation, creating a huge mismatch as demonstrated by the gaps between the light blue and dark blue bars on the graph due to various waste management infrastructures. However, after 2018, with the continuous entry of new technology, China's recycling plastic industry showed a trend of comprehensive management, in-depth processing, and intelligent mechanization with good waste management infrastructure. Another thing to note is that before 2015, the recycling amount was always greater than the capacity due to the importation of plastic waste. After 2015, the recycling amount has always been less than the capacity, and a mass of plastic waste was landfilled or incinerated from 2015–2019. The mismatch between recycling and processing capacity creates a notable amount of mismanaged or discarded EOL plastic. The concern regarding the excessive production capacity can be addressed by limiting the production of informal waste recycling facilities, and the government reactivating the unutilized processing capacity and enhancing the recycling rate of plastic waste to turn waste into valuable secondary materials. Figure 6(b) shows that East China has the largest capacity, reaching 35% of the total processing capacity in China, followed by South China (28%) and North China (20%). The advanced modification technology in this part of the region is conducive to the processing and upgrading of recycled plastic particles. Under the guidance of a series of policies, the construction of infrastructure has been rapidly developed, the scale of the recycling industry has been significantly expanded, and its technological level has been constantly improved, providing support for circular and low-carbon economic development (China Resources Recycling Association 2019).

Figure 6. Interconnection between EOL waste, recycling and processing capacity. (a) Comparison of the EOL waste generation, recycling amount and processing capacity from 2010–2019; (b) distribution of regional processing capacity in 2019.
Download figure:
Standard image High-resolution image4. Discussion
4.1. Guiding infrastructure adjustment for plastic circularity
Notably, there remains a huge gap between the waste generation (590.4 Mt plastic waste) and recycling (only 162.2 Mt recycled waste) in China's current waste management system. As shown in figure 3(b), the recycling is largely determined by the weakest link through equation (2), and it will influence the overall recycling status. Specifically, the recycling rates of packaging and commodity represent the worst situation (only 12%). The CR, PR and ER of packaging are 20%, 87% and 71%, respectively (baseline). To explore the recycling potential, we take packaging as an example to consider three situations by adjusting domestic recycling infrastructure based on the current recycling performance: (1) the CR of packaging reached the level of the agricultural department (80%); (2) packaging has the highest plastic PR, assuming that the PR is maintained at 87% (as shown in figure 3(b)); (3) the ER of packaging reached the level of the B&C department (81%). Based on this, we set four scenarios to compare the recycling changes, as shown in figure 7.

Figure 7. Comparison between different recycling scenarios. CR: collection rate; PR: pre-processing rate; ER: end-processing rate; unit: Mt.
Download figure:
Standard image High-resolution image
Figure 7 shows the variation of the recycling rates in different scenarios. Currently, the CR is 20%, and the recycled amount is 100.7 Mt, accounting for 12% of the total packaging waste amount (baseline scenario). When the CR is 80% and the PR and ER increase to 87% and 81%, the recycled amount can reach 459.7 Mt, accounting for 56% of the total packaging waste amount (scenario three). These results demonstrate that with collection and processing combined, the recycling level can reach the best situation, and packaging recycling can reach the packaging waste new strategy (50% packaging waste by weight will be recycled in 2025) released by the European Commission.
4.2. Strategies to improve China's plastic waste management
Domestic waste recycling requires the interdepartmental cooperation of producers, processors and waste managers after the implementation of the import ban. On the one hand, prolonging the product lifetime and seeking the appropriate terminal application can reduce the amount of waste, and the use of disposable plastic materials should be reduced and biodegradable materials should be advocated. On the other hand, some urgent action needs to be taken to promote plastic waste recycling and close the plastic loop. In the collection stage, the improvement of collection efficiency depends on cooperation between residents and the government, including residents' behavior regarding waste classification and policy initiatives (e.g. extended producer responsibility system) issued by the government (Shan and Yang 2020). Knowledge of waste-sourced classification should be publicized to accelerate proper waste collection in different applications (Brooks et al 2018). By combining with the 'Internet +' recycling mode, an environmental deposit system should be constructed. Furthermore, eco-designs promoting product recyclability are important for boosting end-of-life plastic collection (van Nes and Cramer 2003, Rivera and Lallmahomed 2015). In terms of the pre- and end-processing stages, sorting and reprocessing technology should be increased to further reduce the reprocessing loss (Eriksen and Astrup 2019). Notably, the most important premise underlying these strategies above is that effective basic recycling infrastructure and waste management systems are put in place. In the future, the development trend of infrastructure in the recycled plastic industry is efficient sorting equipment, cleaning equipment, extrusion equipment and an intelligent monitoring system, which will greatly improve the pre-and end-processing capacity. Overall, an organized waste collection system and improved recycling infrastructure, as an important part of the waste recycling system, can reduce the dispersion of EOL plastic in the environment.
5. Conclusion
This study investigates five commodity plastics in Mainland China as an example to evaluate the recycling performance of different types of plastic. The key conclusions are summarized as follows: (1) from 2000–2019, the total consumption of five commodity plastics was around 981.4 Mt, and packaging and agriculture sectors are the main domestic waste generation sources due to the short lifetime of their products; (2) the total amount of plastic waste was about 590.4 Mt, of which about 27% was recycled, 34% was landfilled and 32% was incinerated; (3) the recycling rates of the five commodity plastics are 28%, 30%, 27%, 26% and 26%, respectively; (4) different applications of plastics can be grouped into three categories according to their recycling rates: packaging and commodity with recycling rates <20%, electronics and others with recycling rates ⩾20% and ⩽30%, and B&C, transportation and agriculture with rates >30%; (5) improved recycling infrastructure, and policy incentives are conducive to improving recycling potential; and (6) our analysis can serve as a source of reference regarding the current situation of plastic recycling in China, and provide insight into policymaking for manufacturers, recyclers and governments on sustainable waste management. In the long term, recycling data helps quantify plastic emissions into the environment and assess the environmental impact caused by land and marine pollution.
Furthermore, some limitations also exist. Further studies should consider the additives to evaluate recycling performance and its environmental impact. In addition, we can investigate the socio-economic driving factors that influence waste plastic recycling. Currently, the recycling data has been acquired from the literature and reports in this article, and it is important to further improve the quality of the data from field investigation. Overall, the analysis in this paper may lay the foundation for future research related to environmental impact caused by increasing plastic waste and sustainable waste management in China.
Acknowledgments
This work was supported by the National Key Research and Development Program of Ministry of Science and Technology (Grant No. 2017YFC0505703), the National Natural Science Foundation of China (Grant No. 52070178) and Projects of International (Regional) Cooperation and Exchanges NSFC ( Grant No. 71961147003).
Data availability statement
All data that support the findings of this study are included within the article (and any supplementary information files).
Appendix:
The plastic life cycle quantification process and data are listed in the supporting information.