
Abstract
The long-time retention issue of resistive random access memory (RRAM) brings a great challenge in the performance maintenance of large-scale RRAM-based computation-in-memory (CIM) systems. The periodic update is a feasible method to compensate for the accuracy loss caused by retention degradation, especially in demanding high-accuracy applications. In this paper, we propose a selective refresh strategy to reduce the updating cost by predicting the devices' retention behavior. A convolutional neural network-based retention prediction framework is developed. The framework can determine whether an RRAM device has poor retention that needs to be updated according to its short-time relaxation behavior. By reprogramming these few selected devices, the method can recover the accuracy of the RRAM-based CIM system effectively. This work provides a valuable retention coping strategy with low time and energy costs and new insights for analyzing the physical connection between the relaxation and retention behavior of the RRAM device.
Export citation and abstract BibTeX RIS

Original content from this work may be used under the terms of the Creative Commons Attribution 4.0 license. Any further distribution of this work must maintain attribution to the author(s) and the title of the work, journal citation and DOI.
1. Introduction
Nowadays, resistive random access memory (RRAM) with high density and the ability for in-memory computing is proposed to realize high-speed and low-power multiplication accumulation (MAC) systems [1], thus significantly improving the speed and energy efficiency of artificial intelligence (AI)-related works [2]. However, the reliability challenges of RRAM, especially the resistance drift effect known as relaxation and retention [3] (figure 1), may seriously degrade the performance of RRAM-based neural networks [4].

Figure 1. Schematic of relaxation and retention behavior of RRAM devices.
Download figure:
Standard image High-resolution imageExtensive research efforts have been put into the statistical characteristics and physical mechanism of the analog resistance drift effect. Perez et al investigated the retention behavior of a filamentary RRAM array for the first time, presenting statistical research on analog filamentary RRAM retention following a normal distribution and a physical mechanism based on defect theory and Brownian motion [5]. Xi et al established a multi-filament formation and rupture model for the underlying mechanism of the relaxation effect [6].
Based on these investigations, plenty of compact models with compensation strategies for retention degradation have been proposed to provide useful device–system codesign guidelines. Liu et al developed a physics-based compact model capturing the stochastic degradation behaviors and a device-to-system simulation framework [7]. Huang et al presented an analytic model for the statistical state instability and retention behaviors of the RRAM array by modeling three kinds of atomic motion [8].
Researchers also try to mitigate the retention degradation problem by optimizing array-level programming strategies. In the forming operation, imposing a large current, long pulse width, or high temperature to provide higher forming energy has been proved to result in a lower retention degradation by forming stronger conductive filaments (CF) in RRAM devices [9]. In the writing operation, Chen et al demonstrated effective programming pathways using longer write pulses to replace higher current-pulse amplitudes [10].
Different from the above methods which aim to reduce the impact of retention degradation in advance, the periodical re-programming method aims at recovering the resistance drift of RRAM devices after retention loss happens. Given the randomness of retention behavior [11, 12], the latter can achieve better precision. However, the extra time and energy costs are non-negligible, especially in high-precision programming strategies like in situ training [13]. Incremental step pulse programming (ISPP) methods [5, 14] can significantly reduce the power and delay product (PDP) through the read-pass strategy while reading the whole large-scale array also create substantial overhead.
In this work, we propose to predict the retention characterization of RRAM devices by analyzing their relaxation behavior, then update seriously drifted devices according to the prediction results. Instead of separating relaxation and retention behavior as different characteristics [6], our experiment demonstrates the existence of a connection between them and captured this connection by AI algorithms. To the best of our knowledge, this is the first time a device-level prediction-based periodic update strategy has been realized. Compared with the array-level operations, it is both power-efficient and time-efficient for analog RRAM crossbar arrays to operate just a few specified devices.
To realize the retention prediction, two key innovations are introduced here. First, a convolutional neural network (CNN) model is used to learn the relationship between the relaxation and retention features of RRAM devices. Secondly, a new method is proposed to form an evaluation index of the resistance degradation effect adopted to fix the CNN-based prediction model. Both the neural network architecture and the evaluation index are determined by massive comparative experiments. Based on these innovations, a retention-prediction strategy is experimentally demonstrated on an RRAM-based computation-in-memory (CIM) chip and shows the ability to recover performance degradation effectively with low updating cost.
2. Method
2.1. RRAM-based multilayer perceptron (MLP) neuromorphic CIM system
A fully integrated RRAM CIM chip is used to characterize the retention behavior of RRAM devices and the influence on the accuracy of neural networks [15]. The RRAM devices [15] were fabricated with a TiN/HfOx/TaOx/TiN stack, as shown in figure 2(a), showing continuous conductance-tuning capability in both potentiation (SET) and depression (RESET) operations. After programming to a specified conductance level, the read current of the RRAM device will fluctuate over time (figure 2(b)). Figure 2(c) shows the current distributions of RRAM devices with different programming targets at different times. Whiskers and dotted lines in this picture show that all distributions appear dispersed over time, then tend to be stable after about an hour. On the other hand, since the length of boxes representing the interquartile range remains almost unchanged, it can be concluded that the conductance of most devices remains steady over time with little degradation. Thus, updating a few seriously drifted devices can be an effective method for recovering accuracy.

Figure 2. Characteristic of RRAM built on an MLP chip. (a) Schematic of RRAM device consisting of the TiN/TaOx/HfOy/TiN stack. (b) Time-variant read currents of all RRAM devices programmed to target of 400, 1600, 2800, and 4000 nA. (c) Current distribution of all devices at 0, 30, 60, 90, and 120 min after programming.
Download figure:
Standard image High-resolution imageThe CIM chip was built by integrating peripheral circuits (input/output buffers, analog-to-digital converters (ADCs), etc) and two RRAM arrays (constructed as sign-weighted two transistors two resistors (SW-2T2R) and one transistor one resistor (1T1R) structure, respectively) based on the above device structure, as shown in figure 3(a). Each differential device pair represents a seven-level signed weight, equaling the D-value of four-level positive and negative devices. Both positive and negative devices were programmed through the ISPP [16] and the bilateral-verify scheme. The time cost for programming is 20 us per device (40 pulses × 500 ns pulse width), and the voltage settings for programming are as follows: Vg_set = 1.4–2 V; Vd_set = 2.7 V; Vg_reset = 2.6 ∼ 4.6 V; and Vs_reset = 2.5 V. The time cost for reading is 2.4 us each time (1 pulse × 2400 ns pulse width), and the voltage settings for reading are Vg_read = 4 V; |Vds_read| = 0.2 V. This chip can perform image classification with two-layer perceptron models (figure 3(b)). The weight in the network is trained ex situ with PyTorch, then rescaled and quantized to seven levels to meet the conductance window of the differential RRAM pair. The software accuracy of this quantized model was 97.58%. After transferring the ex situ-trained weights to RRAMs on the chip, the in situ inference accuracy descends from 94.43% to 90.8% in 1 h, then down to 89.43% in 2 h (figure 3(c)). The accuracy decreases logarithmically with respect to time, which is consistent with previous research on the conductance states of similar RRAM devices [17].

Figure 3. Structure and performance of the proposed RRAM-based MLP neuromorphic CIM system. (a) Structure of two RRAM arrays and peripheral circuits integrated on the chip. (b) Algorithm architecture of MLP neural network. (c) Inference accuracy on Modified National Institute of Standards and Technology (MNIST) data set as a function of the delay time.
Download figure:
Standard image High-resolution image2.2. Structure and workflow of CNN-based retention prediction framework
The neural network architecture based on the convolutional layer and fully connected layer in our prediction model is illustrated in figure 4(a). The input 1-D sequences [I0, I1, ..., I99] are the difference between read currents and their target currents, representing the relaxation behavior [6] of each device. The output is a probability value that indicates the device has a poor retention characteristic, and is '0' or '1' according to its predictive retention characteristic. The training label is obtained by sorting the drift currents of the devices in 1 h. The top x% devices have the label '1' and others '0'. The hyperparameter 'x' is determined by the simulation results of updating different proportions of weights presented in the next section. Through these settings, the retention prediction task is converted into a binary categorization problem with input time series, which is demonstrated to fit the CNN architecture well [18]. Since only the top layer of the MLP RRAM chip is fine-tuned, which has proved to be effective in optimizing the retention problem in RRAM arrays [7], the number of samples used to train the CNN model is 16 000 (2000 devices per chip × 8 targets per device), and the size of the test set is 2000 (2000 devices per chip × 1 target per device). Figure 4(b) shows the whole work process of our proposed framework. To get the training data sets for the CNN model, each device on the training chip is programmed to eight target conductance states, reading 100 times within approximately 1 s and 60 times at about 1 h after programming, respectively. Before applying the model on a new chip, we need to program each RRAM device to the target conductance state (decided by the pre-trained algorithm model) and read 100 times within 1 s to get the input relaxation behavior. Then we can predict the retention behavior of each device and decide whether a device needs to be reprogrammed to recover the recognition accuracy in practical applications. The network structure can be fine-tuned to fit various application scenarios like other material systems. Besides, to verify the validity of the CNN prediction model, we also developed a randomly predicted model and models based on the mean or the standard deviation (std) values of the relaxation sequences.

Figure 4. Structure and workflow of the CNN-based prediction model. (a) Structure of the CNN-based neural network for x = 30. (b) Training and refreshing mechanism of our refreshing system.
Download figure:
Standard image High-resolution image3. Results
3.1. Retention prediction by the CNN model
To estimate the prediction effect of our CNN-based neural network, we calculated the absolute value of the difference between the current read after the refresh period and the target current loaded in the programming system (named drift current below) of each RRAM device. The highest classification accuracy is ∼91%, and the probability density distribution of drift currents in the whole array and device lists with different refresh percent is shown in figure 5. The drift currents of most devices selected by the CNN models are significantly higher than others. This proves that our CNN models can accurately predict which devices have poor retention behaviors.

Figure 5. Probability density distribution of average drift currents in selected device lists and the whole array.
Download figure:
Standard image High-resolution image3.2. Selected refreshing strategy
Figure 6 compares the simulation accuracy with refresh percent of 10% on the MLP network with different refresh times, repeating on 60 groups of current sequences to provide statistically significant results. Both initial accuracy and after-refresh accuracy decrease as time increases, which is consistent with the retention behavior of RRAM devices, and demonstrates the effectiveness of our prediction model.

Figure 6. Performance comparison of refreshing at different time with 10% refresh percent on the MLP network.
Download figure:
Standard image High-resolution imageTo determine the proper ratio (hyperparameter 'x' mentioned in section 2.2) of devices to be refreshed, we first simulated the strategy with an MLP on the MNIST data set and a residual network (ResNet-20) on the Canadian Institute for dvanced Research (CIFAR-10) data set. By comparing the current weights with target values, a certain proportion of devices with the severest deviation are selected and replaced by the target values. Figure 7 shows the simulated accuracy with different refresh percent. Each simulation was repeated on 60 groups of read currents to enhance the credibility. The result shows that only updating 5% of weights can already make a significant accuracy improvement, and updating 20% of weights can almost reach the best accuracy. Given the unavoidable non-ideal factor in actual circuits and the prediction error of our prediction model, the value of 'x' is determined as 10%–30%.

Figure 7. Performance improvement of replacing 5%–50% weights in (a) MLP for MNIST and (b) ResNet-20 for CIFAR-10.
Download figure:
Standard image High-resolution imageFigure 8 presents the accuracy improvement of the models with 10%–30% refresh percent on the MLP and ResNet-20 network simulation, repeating on 20 groups of current sequences. Average simulation accuracy based on different groups of measured currents is labeled as hardware accuracy in the figure, and simulation accuracy based on target currents is labeled as software accuracy. All models show a certain effect on accuracy recovery. Overall, the CNN model performs better than other approaches, particularly at low refresh percent. Since all models perform better and gradually reach the software accuracy as refresh percent increases, the difference between CNN and other models shrinks concomitantly as expected. These results reveal the potential connection between the relaxation and retention degradation, including direct correlation captured by statistic methods, and indirect correlation only available in the CNN model, which will be further discussed in section 4.

Figure 8. Comparison of different classification strategies (described in Section 2.2) in (a) MLP and (b) ResNet-20 simulation. The length of the error bars represents the interquartile ranges for accuracy in each group of simulations.
Download figure:
Standard image High-resolution image3.3. Effect on hardware inference accuracy
Improvement of hardware inference accuracy based on the models is shown in figure 9. To compensate for the accuracy variation among different operation cycles, the effects of all models are evaluated by the following index:


Figure 9. (a) Inference accuracy improvement on RRAM-based MLP chip. (b) Accuracy improvement ratio evaluation of different models.
Download figure:
Standard image High-resolution imageTo recover the degraded inference accuracy, 10%–30% of devices with the worst retention behavior predicted by the models will be reprogrammed. The results measured on the real RRAM chip show that the CNN model consistently performs best among all models, while the mean model and std model failed to obtain a better result than the random model. It is also important to notice that since relaxation sequences used to fit these models are measured in the preceding cycle, the CNN model can be considered to have a certain tolerance for cycle-to-cycle variation [19].
The efficiency of the proposed framework based on the ISPP scheme is shown in table 1. In the ISPP scheme, after reading and comparing with the target value, devices with drift less than a given threshold (named P-device below) will be skipped in the current and following cycles, while the severely degraded one (named N-device below) will be set or reset by incremental pulses determined by the verify strategy. According to the time cost of programming and reading operations described in section 2.1, the time cost of reprogramming on our chip is about 2.4 μs per P-device (read only) and 112 μs per N-device (read then program, five cycles on average). Owning to our retention prediction-based reprogramming strategy, the accuracy can be almost recovered by only reprograming a few parts of N-devices. Although there are also some P-devices that were selected to be reprogrammed, the time cost for them is very small. A certain degree of misjudgment of the P-devices can even improve the efficiency of the framework. As with time, the power consumption is also proportional to the number of reprogramming P-devices and N-devices.
Table 1. Time-saving effect and performance of CNN-based prediction method.
| Device type | P-device (2.4 μs/device) | N-device (112 μs/device) | Total | |||
|---|---|---|---|---|---|---|
| Pick-up percent (%) | Device number | Total time (ms) | Device number | Total time (ms) | Time (ms) | Ratio |
| 10 | 89 | 0.21 | 111 | 12.4 | 12.65 | 0.22 |
| 20 | 195 | 0.47 | 205 | 23.0 | 23.43 | 0.41 |
| 30 | 330 | 0.79 | 270 | 30.2 | 31.03 | 0.54 |
| Whole-array | 1516 | 3.64 | 484 | 54.2 | 57.85 | 1 |
4. Discussion
The applicability of the proposed model can be discussed in a broader context of RRAM array-level retention optimization strategies. Three broad refreshing strategies can be considered: in situ training [16, 20], whole-array re-programming, and prediction-based selective re-programming proposed in this article. The advantages and limitations of these models are highlighted in figure 10. In situ training is supported by the backpropagation (BP) algorithm used to calculate the update weight (ΔW) of each device, which can significantly cover the device-to-device variation thus updating each device precisely. However, an additional complex circuit structure is necessary to realize the BP algorithm on a chip, which also means a higher updating cost. By comparison, the re-programming method is easier to achieve, while undifferentiated programming may be redundant for most devices with little degradation and insufficient for seriously drifted devices. Even though verify schemes [13] are widely used to partly cover the device-to-device variation, verifying every device also means massive cost, especially in large-scale RRAM arrays. More importantly, frequent reading may cause read disturbance to RRAM devices as well [14].

Figure 10. Comparison of key considerations for major array-level retention optimization strategies. The proposed approach is described by the red line.
Download figure:
Standard image High-resolution imageSince our prediction-based model is generated directly from the relaxation and retention data sets of each device, it is entirely responsible for covering device-to-device variation without on-chip operations besides programming. In this work, we have shown that CNN-based neural network models can pick up seriously degraded devices by analyzing relaxation data effectively. Moreover, since the prediction progress is completed fully by software, it can be fine-tuned to meet different performance requirements in the application.
The behavior of our CNN-based prediction model can be explained by its judgment of different types of curves. Figure 11 shows some typical relaxation sequences with different prediction results. Stable and volatile curves are drawn in orange and blue lines, respectively, in order to show the variation of the datas ets. We can obtain some possible explanations from the results. The existence of a stable part and relatively small fluctuation range in the current curves presented in figures 11(a) and (c) may help them to be judged as P-devices in the prediction model, while devices drawn in figure 11(c) have a sudden conductance change after the stable part, which may cause severe drift after that. In contrast, the curves presented in figures 11(b) and (d) with many sharp fluctuations, especially near the end of the current sequence, were judged as N-devices by the prediction model. We can also conclude from these two panels that sharp fluctuations with constant magnitude have more probability to have severe retention degradation.

Figure 11. Typical relaxation sequences with different prediction results. (a) Real P-device, predicted as P-device. (b) Real P-device, predicted as N-device. (c) Real N-device, predicted as P-device. (d) Real N-device, predicted as N-device.
Download figure:
Standard image High-resolution imageThe connection between the short-term relaxation and long-term retention degradations is important. Typical variation trends of read current in the hour after programming are drawn in figure 12. Good I–T curves are presented in figure 12(a) with negligible relaxation and retention degradation. In addition, some curves show a direct connection between relaxation and retention degradation. The first kind of connection is shown in figure 12(b), where conductance changes abruptly within 1 s and then remains stable for a long time, which will cause long-term current deviation. This sharp and one-way change will lead to an inaccurate mean value and one large gradient, which can be captured by mean and CNN models, respectively. Besides, figure 12(c) presents some devices with durative fluctuations, which can be detected by the large standard deviation value and gradients. However, there are also a great number of inexplicable current curves as illustrated in figure 12(d). Some devices remain stable within 1 s but drift seriously over a long duration as shown in the blue and orange lines. In contrast, other devices have large swings in a short time, then return to the target conductance after tens of minutes, as shown in the gray and yellow lines. The significant difference between relaxation and retention degradation made it difficult to predict retention behavior by simple statistical indicators, while the convolution operation has the ability to pick multidimensional information from the relaxation current sequence. The accuracy and interpretability of our CNN-based prediction model can be further optimized with the understanding of the physical connection between relaxation and retention degradation.

Figure 12. Typical variation trends of RRAM read current after programming. (a) Ideal curves with negligible relaxation and retention degradation. (b) Jumping abruptly within 1 s then remains stable for a long time. (c) Fluctuating severely and continuously. (d) Irratic curves with significant different trends before and after 1 s.
Download figure:
Standard image High-resolution image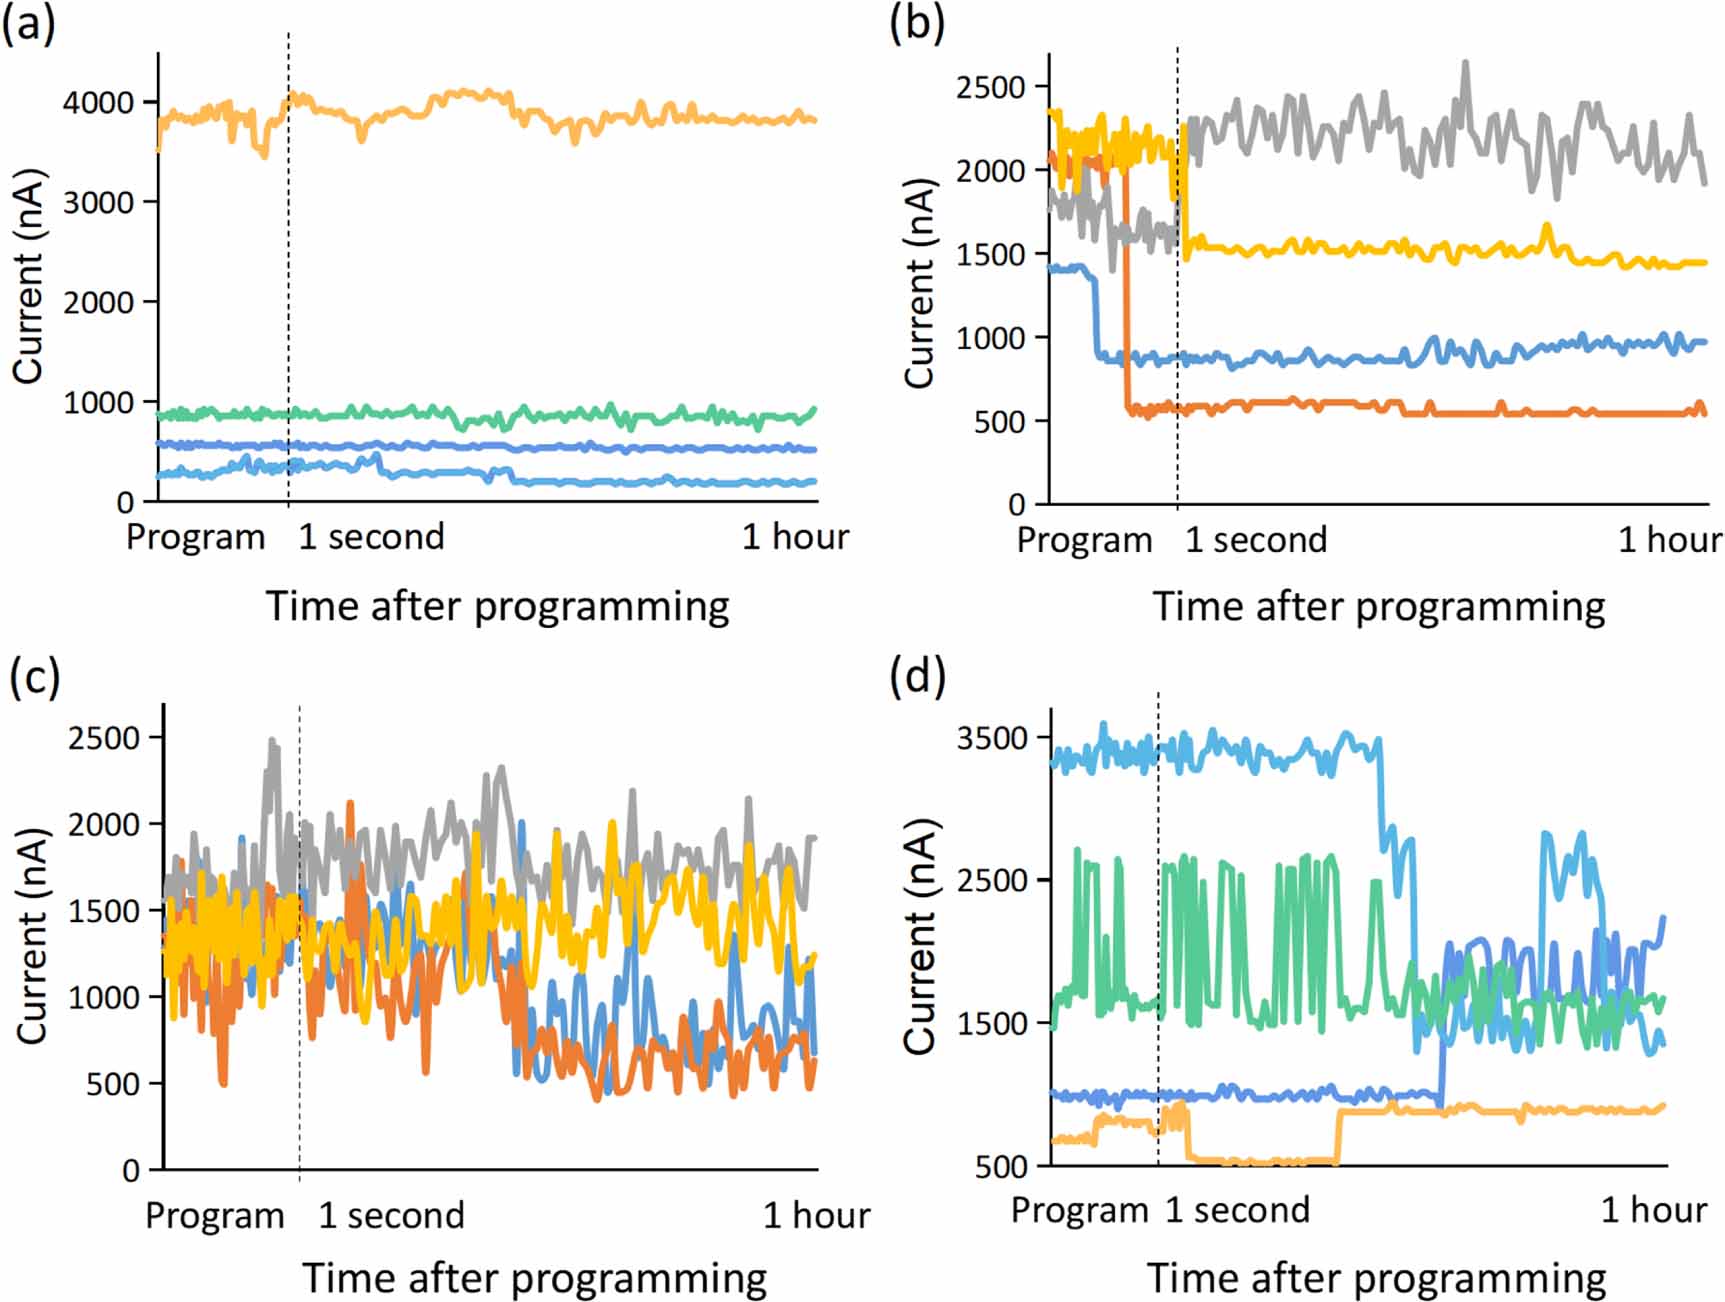
Apart from the data-based connection, this work also highlights a potential relevance between the physical mechanism of relaxation and retention behavior. It is important to point out that the training and test data sets used in our model are sampled from different chips, thus it is reasonable to infer that the relaxation–retention relationship can be universal in different arrays with few device-to-device variations.
5. Conclusion
In this work, we develop a selective reprogramming framework for RRAM-based CIM systems to recover the accuracy loss caused by the resistance drifting of RRAMs. The strategy is based on a CNN model that can predict whether a device has poor retention according to its relaxation behavior. Using this method, only reprogramming 10% of devices can almost recover the accuracy, and leads to high time and energy efficiencies. Furthermore, the CNN model can be used to reveal the potential connection between the relaxation and retention degradation of the RRAM.
Data availability statement
The data cannot be made publicly available upon publication because no suitable repository exists for hosting data in this field of study. The data that support the findings of this study are available upon reasonable request from the authors.