
Abstract
167Er3+ doped solids are a promising platform for quantum technology due to erbium's telecom C-band optical transition and its long hyperfine coherence times. We experimentally study the spin Hamiltonian and dynamics of 167Er3+ spins in Y2O3 using electron paramagnetic resonance (EPR) spectroscopy. The anisotropic electron Zeeman, hyperfine and nuclear quadrupole matrices are fitted using data obtained by X-band (9.5 GHz) EPR spectroscopy. We perform pulsed EPR spectroscopy to measure spin relaxation time T1 and coherence time T2 for the 3 principal axes of an anisotropic g tensor. Long electronic spin coherence time up to 24.4 μs is measured for lowest g transition at 4 K, exceeding previously reported values at much lower temperatures. Measurements of decoherence mechanism indicates T2 limited by spectral diffusion and instantaneous diffusion. Long spin coherence times, along with a strong anisotropic hyperfine interaction makes 167Er3+:Y2O3 a rich system and an excellent candidate for spin-based quantum technologies.

Original content from this work may be used under the terms of the Creative Commons Attribution 4.0 licence. Any further distribution of this work must maintain attribution to the author(s) and the title of the work, journal citation and DOI.
1. Introduction
Rare-earth (RE) ions in solids possess shielded 4f intra-shell optical and spin transitions with narrow linewidths and long coherence times [1–3], making them ideal candidates for applications such as quantum memory [1, 4] in a quantum network [5], microwave-to-optical quantum transduction [6] and quantum sensing [7]. Among RE ions, erbium (Er3+) in particular, constitutes a unique system that simultaneously possesses optical fiber-compatible telecom C-band optical transition (1535 nm), high electron g-factor (14.6 Er3+:Y2SiO5) [8] with long nuclear spin coherence time of 1.3 s at 1 K (167Er3+: Y2SiO5) [3]. 167Er3+ with nuclear spin I = 7/2 exhibits strong anisotropic hyperfine interactions, resulting in electron-nuclear hybridized states in low symmetry sites with reduced sensitivity to magnetic field noise at zero field—known as the zero-first-order Zeeman (ZEFOZ) transitions [9] as well as a large zero field transition frequencies in the microwave range. Narrow optical homogenous and inhomogeneous linewidth [10, 11] have been demonstrated in 167Er3+ doped yttrium orthosilicate (YSO) [3]. Comparable to YSO, yttrium oxide (Y2O3) is another low magnetic noise host with a similar ionic radius of Y3+ to Er3+ (1.04 vs 1.03 Å) and can be synthesized in diverse range of material platform compatible with nanoscale integration [12] including thin films [13, 14], nanoparticles [15, 16], and transparent polycrystalline ceramics [11]. This combination makes the characterization of spin Hamiltonian of 167Er3+:Y2O3 crucial to further develop this quantum platform by exploiting its long-coherence-time hyperfine transitions as well as performing coherent control of 167Er3+ spins as a resource for quantum technology applications.
We report X-band (9.5 GHz) electron paramagnetic resonance (EPR) (continuous-wave and pulsed) spectroscopic studies of the atomic environment and dynamics of the Er3+ spins in Y2O3 polycrystalline matrix. We investigate the electronic structure of Er3+ using continuous-wave (CW) EPR and characterize Er3+ local structure variations in different crystalline environments (C2 and C3i) in cubic Y2O3 by determining the Zeeman, hyperfine and quadrupole interactions. We compare X-band EPR with low field C-band (5 GHz) EPR to verify the spin Hamiltonian in a regime where the Zeeman energy is comparable to hyperfine energy. The hyperfine transitions in 167Er3+ introduce mixed states that show a relatively slow spin relaxation, which can be detected at temperatures of 4.0–6.0 K. We measure a long spin coherence time of 24.4 μs at 4 K for lowest g-factor transition. The limits for coherence relaxation times given by spin-lattice relaxation (characterized as T1) is 5 ms at 4.0 K. Our study provides a comprehensive spin spectroscopy of 167Er3+ in Y2O3, which shows significant prospects of this platform for future applicable quantum technologies.
2. Results and discussion
The Er3+ ion contains 4f11 electrons which result in a total spin quantum number of S = 3/2, an orbital quantum number of 6 and total angular momentum of J = 15/2. The ground level 4 I15/2 is 16-fold degenerate and in the presence of crystal field of low symmetry it can split into 8 (J + ½) Kramer doublets. The energy of microwave radiation generated in conventional X-band EPR experiments (9.5 GHz) is generally sufficient to probe only the lowest-lying doublet of the 4 I15/2 manifold of trivalent erbium. As a result, common studies of Er3+ in metal oxides consider only the lowest lying Kramer doublet with an effective spin S = 1/2 system to account for the features of Er3+ EPR spectra:

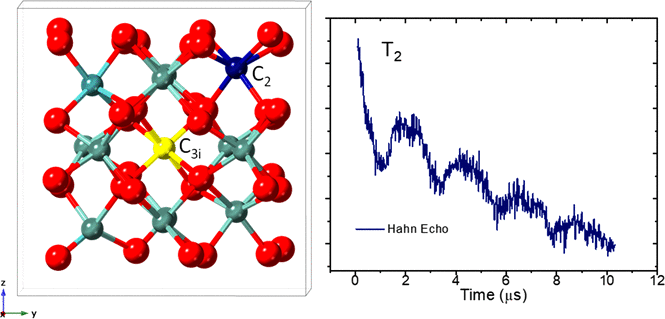
where the first Zeeman term represents the energy of the electronic spin in a magnetic field B0 and the second term accounts for the hyperfine interaction with nuclear spins and the third term is nuclear quadrupole interaction, μB is the Bohr magneton and g, A and Q are interaction tensors, which reflect local structure particularities of the paramagnetic complex. EPR spectrum of Y2O3 doped with natural abundance of Er3+ is shown in figure 1(a). The sample has a nominal Er3+ doping of 20 parts per million (ppm), and was prepared by sintering 40 nm-sized nanocrystals into polycrystalline ceramics according to the method reported in reference [11]. For X-band EPR measurement, the sample was grinded to microparticles to increase the filling factor of the microwave cavity. Figure 1(a) inset shows the crystal structure of cubic Y2O3 with annotated different local sites available for the substitution of Y3+ with Er3+. Two possible sites are: a lower symmetry C2 site whose substitution should result in a rhombic EPR signal and a higher symmetry trigonal C3i site whose substitution should result in an axial EPR signal. Indeed, we clearly observe four main transitions, three for a rhombic signal (gz = 12.20, gy = 4.89 and gx = 1.64) and a main signal for trigonal symmetry site (g⊥ = 3.32). Upon close inspection of the lowest rhombic component using small modulation amplitude, we find that the lowest signal at g = 12.20 is composed of two signals, one with g = 12.20, which is approximately 5 times more intense than the one with g = 12.08 (figure 1(b)).

Figure 1. (a) CW-EPR spectroscopy provides spin Hamiltonian parameters for electron spin in the lowest doublet of 4 I15/2 under magnetic field. Inset left: Er3+ substitutes Y in the lower symmetry C2 site (bottom) and the higher symmetry C3i site (top), Inset right: energy levels of g = 12.20, 12.28, 3.32, 4.89 and 1.64 for Er3+ I = 0 isotopes as function of B field (right), where X-band transitions are shown with black lines. CW-EPR on natural isotopic purity Er3+:Y2O3 shows transitions from C2 (red) and C3i (blue) closely modelled by simulations. (b) The g = 12.20 levels under close inspection reveal strong lines around 55 mT from I = 0 isotopes of Er3+ along with two sets of 8 satellite lines corresponding to 167Er3+ from C2 g = 12.28 and C3i g = 12.20. Inset: the g = 12.20 lines from C2 and C3i show different saturation with power.
Download figure:
Standard image High-resolution imageThe two signals have different saturation properties suggesting their association with different sites (inset, figure 1(b)). Simulation of the experimental spectra with even isotope 166Er3+ (33.5% natural abundance) using the above listed parameters for the parallel component of the axially symmetric signal (C3i) perfectly matched observed transitions and signal's intensity. The average gavg factors for both C2 and C3i systems were found to be 6.243, suggesting Γ7 ground state (gave = 6.0) rather than Γ6 (gave = 6.8) usually found in Er3+ doped samples [17–19].
The gz component simulations using a natural distribution of Er3+ isotopes fit well with the observed hyperfine structure (HFS) in Er3+ spectra. 167Er3+ isotope with a nuclear spin I = 7/2 and 23% abundance resulted in an approximately symmetrical HFS pattern of 8 satellite lines with 3.7% amplitude of the central line and with hyperfine splitting Az = 1288 MHz, Ay = 518 MHz and Ax = 120 MHz for C2 symmetry and A∥ = 1260 MHz and A⊥ = 350 MHz for C3i. However, gz component of a rhombic C2 signal and g∥ component of a C3i signal in the odd nuclear isotope 167Er3+ were slightly shifted from that associated with even isotopes and found to be 12.28 and 12.20, respectively (figure 1(b)). This indicates that odd isotope 167Er3+ experiences slightly different environmental effects caused by a different effective crystal field.
To examine this phenomenon and to elucidate how these hyperfine states affect spin electronic structure and relaxation dynamics, we synthesized an isotopically purified 167Er3+ doped Y2O3 sample with 20 ppm doping and observed a spectrum with a high density of hyperfine transitions indicative of nuclear spin for 167Er3+. The lowest field components gz and g∥ components are composed of eight lines, each as expected from I = 7/2 (figure 2(a)). Importantly, the central line associated with transitions of even isotopes at g = 12.20 was significantly reduced, testifying to the isotopic purity of the sample. The gy component for C2 state of 167Er3+, however, does not show expected eight-line pattern, but instead 16 major lines of different intensities were observed. This spectrum could not be deconvoluted to the set of octets if one would assume existence of two nonidentical sites leading to two different hyperfine structures previously found in reference [21]. Our spectrum has very irregular line positions and intensities with separations that can be closely simulated with simple I = 7/2 nuclear hyperfine interactions A along with strong nuclear quadrupole interaction Q. Nuclear quadrupole interactions impose additional torque acting on 167Er3+ nuclei and affect quantization directions, thereby shifting energy levels and magnetic resonance transitions while also leading to forbidden transitions. Similarly, g⊥ component for C3i state is now composed of more than 8 lines each, suggesting the presence of forbidden transitions. A similar observation was made for 167Er3+ in Y2SiO5 [8, 22] where forbidden transitions with intensity comparable to allowed transitions were described with a traceless nuclear quadrupole interaction (Q).

Figure 2. (a) 167Er3+ X-band CW-EPR (black) compared with simulation for C2 g = 12.28, g = 4.78, g = 1.64 and C3i g = 12.20, 3.28 lines. Simulated spectra using Easyspin [20] show close agreement with the experimental spectrum. The predicted resonance fields for transitions are shown in dashed vertical dashes, grouped together for each g-factor. (b) & (c) 167Er3+:Y2O3 simulated energy levels for (b) C2 and (c) C3i (blue) site as a function of field generated with Easyspin. Red lines show the high intensity X-band (9.3 GHz) transitions while the grey lines show lower intensity forbidden transitions.
Download figure:
Standard image High-resolution imageThe spin Hamiltonian was fitted to the resonance fields for hyperfine transitions obtained from the experimental spectrum. We also assumed that g, A and Q tensors have coincident principal axes and can be simultaneously diagonalized as limited information about the orientation of the tensor can be derived from a powder spectrum alone for an anisotropic spin Hamiltonian. The low field transitions could be successfully fitted with gz , Az components of C2 (gz = 12.28, Az = 1280 MHz) and g∥ of C3i sites (g∥ = 12.20, A∥ = 1268 MHz), in both peak positions and their intensity (see supporting information S1). Intermediate field transitions were fitted to obtain gy , Ay , Q [Qx , Qy , Qz ] terms of the C2 site (gy = 4.78, Ay = 480 MHz, Q = [−50, 10, 40] MHz) and g⊥, A⊥, Q [Q∥, Q⊥] terms of the C3i site (g⊥ = 3.28, A⊥ = 310 MHz, Q = [12.5, −25] MHz). The C2 gx component at g x = 1.64 had broad transitions with small intensity which limited the number of hyperfine transitions to be resolved. Therefore, Ax was estimated from the difference in splitting of the lowest and highest field hyperfine transitions observed in the experimental spectrum (gx = 1.64, Ax = 212 MHz). The simulated spectrum for C2 site (red) and C3i site (blue) generated using the fitted spin Hamiltonian shows a close agreement to experimental spectrum in terms of peak position, shape as well as the relative intensity (figures 2(a) and (b)). Tables 1 and 2 summarize the principal values of g tensor for Er3+ (I = 0) and g, A, Q for 167Er3+ (I = 7/2), respectively.
Table 1. Spin Hamiltonian parameters for Er3+ (I = 0) in Y2O3.
| C2 | C3i | |
|---|---|---|
| Electron Zeeman (g) | gx = 1.64, gy = 4.89, gz = 12.20 | g⊥ = 3.32, g∥ = 12.08 |
Table 2. Spin Hamiltonian parameters for 167Er3+ (I = 7/2) in Y2O3.
| C2 | C3i | |
|---|---|---|
| Electron Zeeman (g) | gx = 1.64, gy = 4.78, gz = 12.28 | g⊥ = 3.28, g∥ = 12.20 |
| Hyperfine (A) (MHz) | Ax = 212, Ay = 480, Az = 1280 | A⊥ = 310, A∥ = 1268 |
| Quadrupole (Q) (MHz) | Qx = 10, Qy = 40, Qz = −(Qx + Qy ) | Q⊥ = 12.5, Q∥ = −2Q⊥ |
The predictions from an anisotropic 167Er3+ spin Hamiltonian fitted with the X-band EPR have been shown to exhibit disagreement with the low field EPR measurements in low symmetry hosts such as Y2SiO5 [21]. Therefore, to validate the fitted spin Hamiltonian at a lower field, we performed CW-EPR on the 167Er3+:Y2O3 sample with a C-band microwave (resonance frequency of 4.96 GHz) loop-gap cavity. The experimental spectra (figure 3) show close agreement with simulated spectrum from C2 and C3i sites and suggest a good estimate of EPR parameters. The fitted g values are also in close agreement with previous optical and EPR measurements [23–25].

Figure 3. 167Er3+ 5 GHz CW-EPR spectrum (black) compared with spectra simulated from C2 g = 12.20, g = 4.78 and C3i g = 12.2, g = 3.28 lines. Simulated spectra using Easyspin [20] shows close agreement with the experimental spectrum. The predicted transition fields are shown in dashes, grouped together for each g factor.
Download figure:
Standard image High-resolution imageWe sent π/2 and π pulses and swept the magnetic field to obtain two pulse-field swept echo, (2P-FSE), (π/2−τ−π−τ − echo, τ = 250 ns) spectrum of 167Er3+ in X-band. Figure 4 shows EPR transition from hyperfine split levels which show similarities to the CW EPR spectrum of the same sample (supplement figure S2). The signal is temperature dependent, disappearing at 15 K, which is indicative of EPR signals of Er3+ ions. Four different regions of discrete multiline transitions are observed in addition to a broad underlined absorption that suggests existence of unresolved hyperfine structures of strongly interacting 167Er3+ ions. The signal intensity ratio for C3i:C2 states in the 2P-FSE spectrum is higher compared to their intensity ratio in CW EPR, suggesting different spin dynamics of C3i and C2 states. Moreover, the 2P-FSE spectrum features are strongly dependent on the delay time τ between π/2 and π pulses, revealing individual dynamic features of C2, C3i and strongly interacting 167Er3+ sites. The strongly interacting sites show the fastest decay. Figure 4(a) shows the change of the 2P-FSE spectra with the change of the delay time τ between two pulses. As τ increases from 250 to 400 ns, the first signal to lose the intensity is the broad feature under the discrete transitions that we associate with strongly interacting 167Er3+ sites. In the same time frame, discrete transitions become even more intense, possibly because of their diminished relaxation due to the decay of the strongly interacting species. At later times both C2 and C3i sites lose their intensity, and at τ = 1.5 μs only one pronounced transition remains, corresponding to the energetically highest m = +7/2 hyperfine state of C3i.

Figure 4. X-band pulsed EPR on 167Er3+:Y2O3 at 4 K. (a) Echo detected field sweep shows EPR transition from hyperfine levels of C2 g = 12.28, 4.78 and C3i g = 12.20, 3.28 along with a short lived broad unresolved signal due to 167Er3+ interaction. At pulse separation of 1.5 μs only signal from C3i mS = +7/2 remains. (b) C2 g = 1.64 component shows slow decay and persists up to 3 μs at 4 K while decays completely at 20 K. (c) The echo decay of g = 1.64 signal shows stretched exponential decay corresponding to coherence time of 24.4 μs superimposed to electron spin echo envelope modulation (ESEEM). (d) The fast Fourier transform of three pulse ESEEM (frequency domain) for g = 1.64 component reveals Larmor frequencies for 167Er3+ and 89Y3+ nuclei at 413.9 mT. (e) The integrated area echo decay for C2 g = 4.89 transition shows a coherence time of 0.5 μs with further improvement to 6.5 μs after applying XY-16-π-XY-16 DD sequence. (f) Instantaneous diffusion measurement on C2 g = 4.78 and C3i g = 3.28 with slope 0.84 and 0.71 MHz respectively. (g) T1 measurement on C2 g = 4.78 and C3i g = 3.28 transition with inversion recovery sequence.
Download figure:
Standard image High-resolution image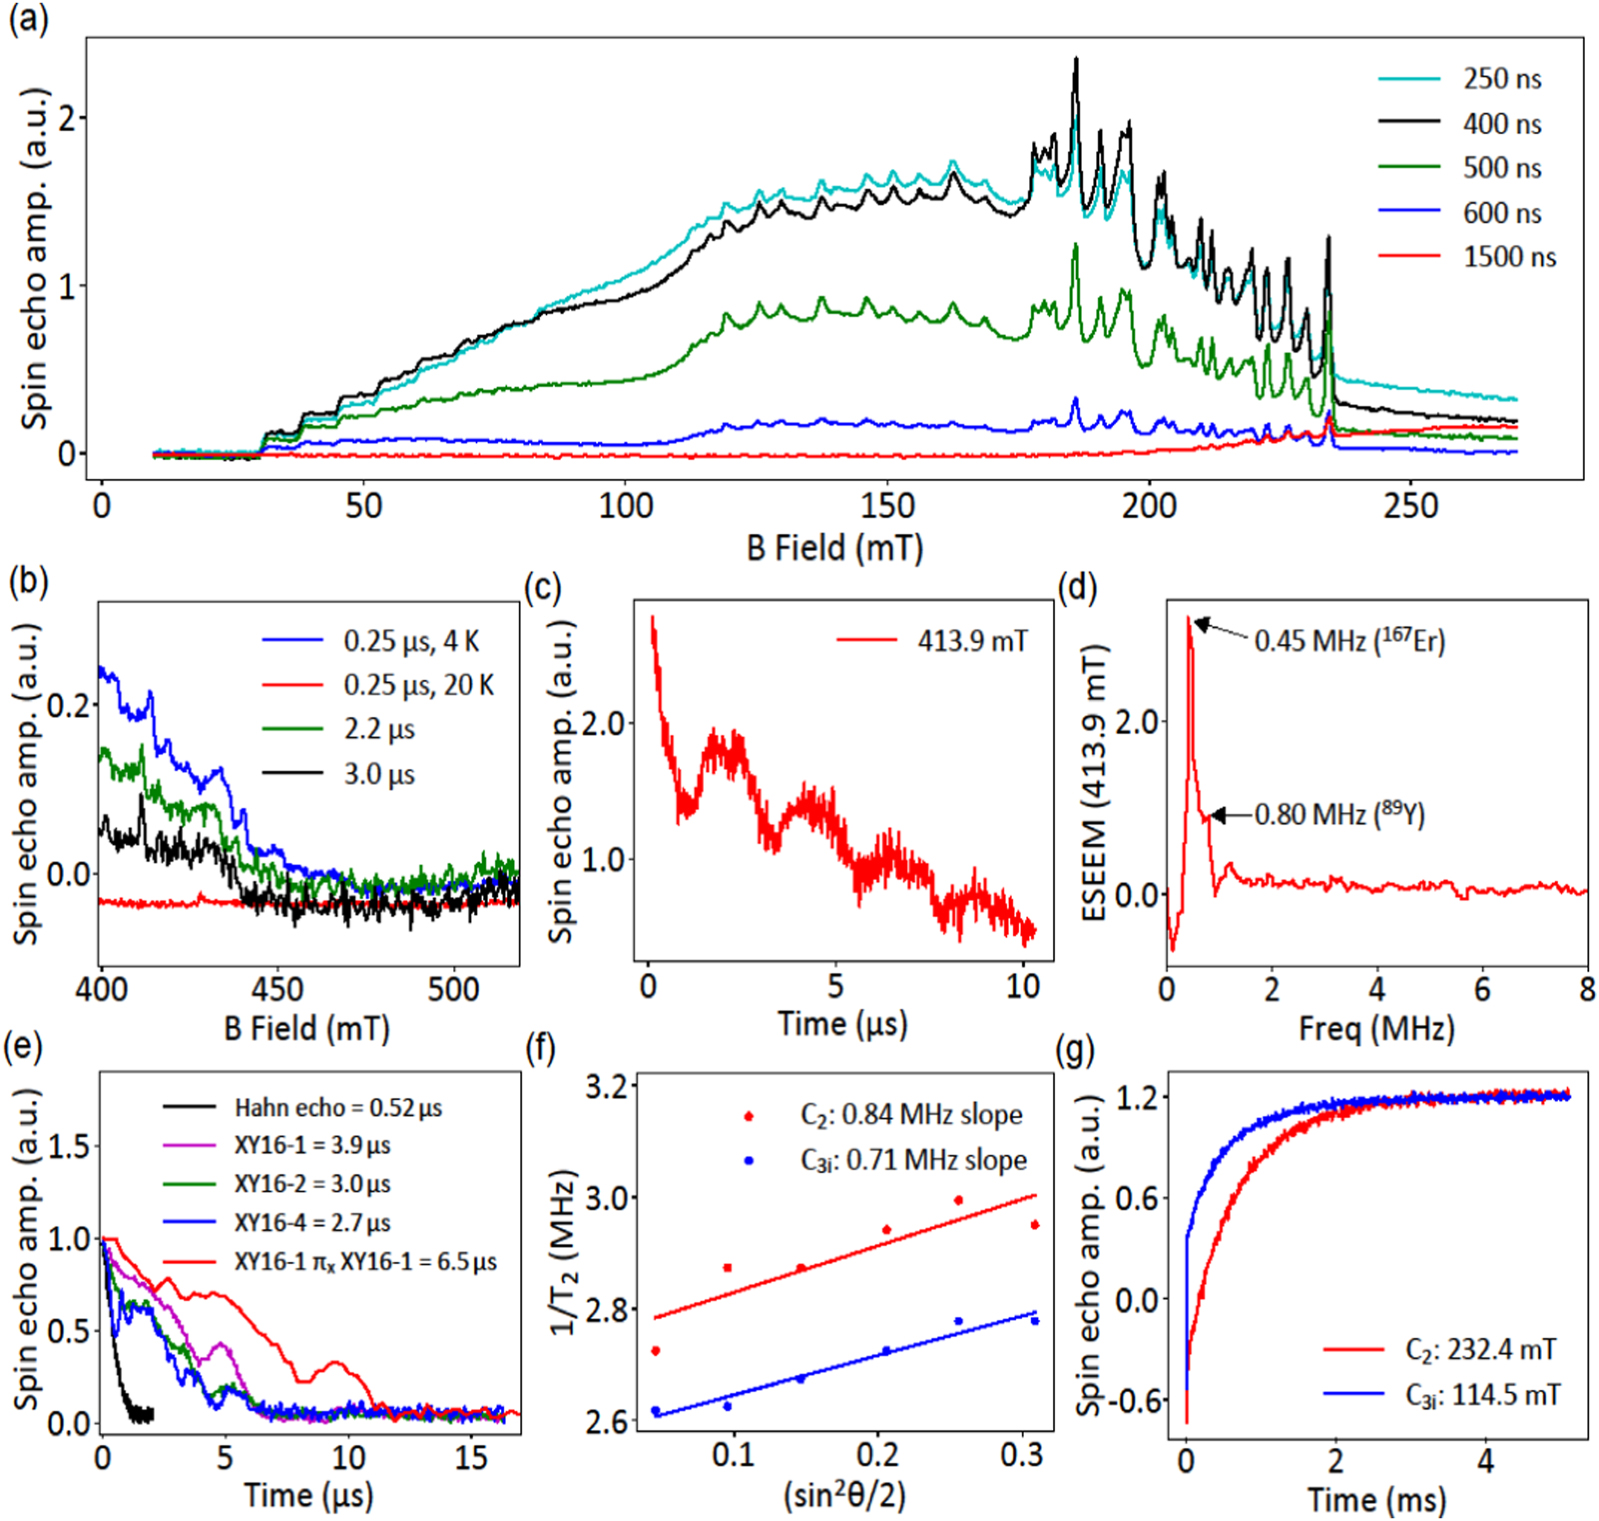
While all low field spectral features for 167Er3+ in rhombic crystalline environment C2 vanish for the pulse delay of 1.5 μs, figure 4(b) shows decay of the spectral features for high field g = 1.64 C2 component with increasing delay time τ. These features, although weak, persists for up to τ delay time of 3 μs, suggesting their long coherence time. Temperature dependence of this signal is consistent with the temperature behavior of Er3+ signals at g = 4.8 and 12.2 which also disappear at 15 K. The g = 1.64 transition exhibited very slow stretched exponential echo decay with T2 = 24.4 μs measured at 4.3 K which was superimposed with slow nuclear modulation (figure 4(c)). The Fourier transform of electron spin envelope echo modulations ESEEM (obtained using 3P-ESEEM, π/2-τ-π/2-T-π/2 − τ − echo, with 16 step phase cycling) shown in figure 4(d) reveals two modulation frequencies, one stronger component of 0.45 MHz consistent with modulation of 167Er3+ and one 0.80 MHz consistent with modulation of 89Y suggesting that the interaction with 167Er3+ ions from C3i sites and to a lesser extent weakly coupled 89Y 'matrix' nuclei contribute as a source of decoherence. However, due to the weak signal intensity, we were not able to measure spin lattice relaxation T1 of the transition with g = 1.64.
Transitions with higher g factors (g = 12.2, 4.78, 3.28) exhibit stronger sensitivity to magnetic noise leading to the fast echo decay with a shorter T2 time of approximately (0.5–0.9 μs) (figure 4(e) for g = 4.78 & table 3). The g = 4.78 transition could be effectively dynamically decoupled from the sources of decoherence by applying a single XY16 [26] sequence, prolonging its T2 for an order of magnitude to 3.9 μs. Extending of coherence time obtained by applying dynamic decoupling sequences with multiple rotation axes such as XY16 demonstrates the presence of spectral diffusion as a source of fast spin decoherence. However, applying multiple sequences of XY16 only shortens spin coherence time T2 due to pulse error. Only after the sign of the signal was inverted by applying a π pulse between two XY16 sequences, we obtained further enhancement of the spin coherence to 6.5 μs. The signal obtained after dynamic decoupling reveals slow modulations reminiscent of those obtained in 3P ESEEM measurements of g = 1.64 transition, suggesting that the same ions participate in relaxation of spins with g = 4.78.
Table 3. Spin relaxation time and coherence time for 167Er3+ at 4 Kelvin.
| g-factor | Group | Field | T1 long comp | T1 short comp | Ratio long:short | T2 |
|---|---|---|---|---|---|---|
| 12.2 | C2/C3i | 314 G | 4.8 ms | 0.1 ms | 5:3 | 0.9 μs |
| 386 G | 3.2 ms | 0.8 ms | 4:3 | 0.8 μs | ||
| 586 G | 2.8 ms | 0.9 ms | 1.4:3 | 0.5 μs | ||
| 4.8 | C2 | 1125 G | 700 μs | 13 μs | 4:1 | 0.4 μs |
| 1189 G | 640 μs | 12 μs | 4:1 | 0.4 μs | ||
| 1372 G | 620 μs | 47 μs | 5:1 | 0.4 μs | ||
| 3.3 | C3i | 1858 G | 580 μs | 4 μs | 0.4 μs | |
| 1958 G | 580 μs | 4 μs | 0.4 μs | |||
| 2342 G | 580 μs | 4 μs | 0.4 μs | |||
| 1.6 | C2 | 4139 G | Too weak to measure | 24.4 μs | ||
| Broad signal no hyperfine | 1030 G | 0.35 ms | 8.6 μs | 7:2 | 0.3 μs | |
Instantaneous diffusion [27] arising from the dipole interaction of resonant 167Er3+ spins during inversion pulses is another mechanism of spin decoherence. We investigated instantaneous diffusion by applying the Hahn echo (π/2 − τ − Θ − τ − echo) sequence with various spin-flip angles. Figure 4(f) shows the dependence of 1/T2 of C2 g = 4.89 measured as a function of different spin-flip probability (sin2Θ/2, where Θ is spin-flip angle). We obtain a linear dependence of the 1/T2 on the average spin flip probability with the slope of 0.8 MHz, suggesting an effective concentration of resonant spins with density 1.38 × 10¹⁷ spin/cm3 (equivalent dopant density of ∼5 ppm) with g = 4.78 contributing to instantaneous diffusion. The instantaneous diffusion determined for the spins in C3i symmetry (figure 4(f)) shows very similar dependence of 1/T2 on the spin flip probability sin2Θ/2 (slope of 0.7 MHz) corresponding to an estimated density of 2.53 × 10¹⁷ spins/cm3 with g = 3.28.
The electron spins in highly symmetric C3i sites also experience spectral diffusion from spin flips of neighboring spins that could be mitigated through XY16 dynamic decoupling pulse sequences. Applying the multiple XY16 sequences separated by a sign inversion π pulse, extends coherence time T2 of C3i states up to 6 μs measured at 4.2 K. However, decoupling schemes do not extend the coherence time up to the T1 limits given by spin-lattice relaxation. Spin lattice relaxation times were determined through three pulse inversion recovery sequence (π − T − π/2 − τ − π − τ − echo with 4 step phase cycling) and were found to be biexponential with larger fraction of the slow component (table 3). Determined slow component of T1 is long for 167Er3+ in C3i states, reaching 0.6 ms at 4.2 K. As T1 spin-lattice relaxation bounds coherence time, long T1 times suggests orders of magnitude improvement of electron spin coherence times by eliminating spectral and instantaneous diffusion. The spin lattice relaxation times of C2 states are even longer ranging from 0.7 ms for g = 4.78, to 5 ms for g = 12.20 at 4.2 K. The T1 times for 167Er3+ are significantly longer than that of natural isotopic abundance Er3+ sample with three orders of magnitude longer T1 for C2 g = 12.2, an order of magnitude for C2 g = 4.8 and for C3i g = 3.3 (table 4). These results suggest that isotope inhomogeneity in natural isotope promotes spin-lattice decays.
Table 4. Spin relaxation time and coherence time for Er3+ natural isotopic abundance at 4 Kelvin.
| g group | Field | T1 | T2 | Group |
|---|---|---|---|---|
| 12.2 | 534 G | 1.7 μs | <200 ns | C2/C3i |
| 4.9 | 1389 G | 16 μs | 1.5 μs | C2 |
| 3.3 | 2045 G | 7.6 μs | 1.1 μs | C3i |
| 1.6 | 4121 G | 16 μs | 0.6 μs | C2 |
3. Conclusion
We have comprehensively characterized the spin Hamiltonian of ground state 167Er3+ in both C2 and C3i sites of Y2O3 using X-band EPR. The spin Hamiltonian exhibited an anisotropic g, A matrix with a strong nuclear quadrupole interaction Q leading to forbidden EPR transitions and showed good agreement with the 5 GHz CW-EPR spectra. The measured strong anisotropic hyperfine interaction of 167Er3+ in both C2 and C3i sites of Y2O3 suggests the presence of zero first-order Zeeman (ZEFOZ) transitions at low fields with possibly long spin coherence times [9, 28]. The spin dynamics of 167Er3+ studied using X-band pulsed EPR show a long coherence time reaching 24.4 μs for g = 1.64 transition at 4 K. The spin coherence time was found to be limited by spectral diffusion with and instantaneous diffusion for both C2 and C3i sites. With lower doping concentration the spin coherence time could be further improved at 4 K. Addressing low field ZEFOZ transitions and utilizing pulsed sequences aimed at decoupling dipolar interaction and spectral diffusion [29] could be future steps in maximizing the coherence of this system for enabling quantum technologies.
Acknowledgement
We acknowledge Oleg Poluektov and Jens Niklas for D-Band EPR measurements.
Author contributions
The manuscript was written through contributions of all authors. JY and HZ prepared the samples; TR and LS performed X-band EPR spectroscopy. SG & TZ performed 5 GHz EPR spectroscopy. TR, LS, SG and TZ analyzed and simulated EPR spectra. All authors have given approval to the final version of the manuscript.
Funding sources
This work was supported by the US Department of Energy, Office of Science, Basic Energy Sciences, Materials Science and Engineering Division. S Gupta and T Zhong acknowledge the support from Department of Defense, Army Research Office Grant No. W911NF2010296, and National Science Foundation (NSF) Faculty Early Career Development Program (CAREER) Grant (No. 1944715). Work performed at the Center for Nanoscale Materials, a US Department of Energy Office of Science User Facility, was supported by the US DOE, Office of Basic Energy Sciences, under Contract No. DE-AC02-06CH11357.
Notes
The authors declare no competing financial interests.
Abbreviations
CW-EPR, continuous-wave electron paramagnetic resonance; ZEFOZ, zero-first-order Zeeman; ESEEM, electron spin echo envelope modulation.
Data availability statement
The data that support the findings of this study are available upon reasonable request from the authors.