
Abstract
Microalgae cultures have an excellent ability to capture CO2 and produce high, medium, and low valuable biocompounds such as proteins, carbohydrates, lipids, pigments, and polyhydroxyalkanoates; those compounds have shown excellent properties in the pharmaceutical, cosmetic, food, and medical industries. Recently, the supplementation of carbon dots (CDs) in autotrophic microalgae cultures has been explored as a new strategy to increase light capture and improve photoluminescence, which in turn enhances biomass growth and biocompounds production. In this work, we synthesized CDs through a simple carbonization method using orange juice as a natural precursor. The green synthesized CDs were analyzed in detail through characterization techniques such as Fourier-transform infrared spectroscopy (FTIR), UV–visible, fluorescence spectroscopy, and ζ potential analysis. Moreover, CDs were added to Chlorella vulgaris to analyze the response under different photoperiod cycles and CDs dosages. The optimal results were obtained with the addition of 0.5 mg l−1 of CDs under a photoperiod cycle of 16 h:8 h (light:dark). In these conditions, a maximum biomass production of 2.12 g l−1 was observed, which represents an enhancement of 112% and 17% in comparison to the control samples under the photoperiod of 12 h:12 h and 16 h:8 h (light/dark), respectively. Furthermore, the production of lipids, proteins, and carbohydrates was significantly increased to 249 mg g−1, 285 mg g−1, and 217 mg g−1 dry weight, respectively. These results suggest that the addition of CDs enhances cell growth and increases the production of lipids and proteins, being a strategy with great potential for the food and pharmaceutical industries.
Export citation and abstract BibTeX RIS

Original content from this work may be used under the terms of the Creative Commons Attribution 4.0 licence. Any further distribution of this work must maintain attribution to the author(s) and the title of the work, journal citation and DOI.
1. Introduction
In the last years, microalgae have attracted worldwide attention because of their ability for biomass accumulation, nutrient assimilation, and the production of bioactive compounds (Calijuri et al 2022). Microalgae cultures possess a wide number of characteristics that make them advantageous over other microorganisms; they do not require agricultural land or clean water, they possess CO2 capture ability, and high tolerance to grow in wastewater, among others (Javed et al 2019). Microalgae are photosynthetic microorganisms; thus, they can convert light energy into chemical energy to produce bioresources through CO2 biofixation (Sathasivam et al 2019). The biomass produced by microalgae cultures has been used as feedstock to recover high, medium, and low-value products (Bauer et al 2017). For example, recent works have reported the production of polysaccharides, polyunsaturated fatty acids, vitamins, phenolics, carotenoids, and polyhydroxyalkanoates by using different microalgae strains (Zhou et al 2022). In this manner, microalgae can produce substances with antioxidant, anti-inflammatory, antimicrobial, and anticancer activities (Archer et al 2021), which may open new applications in the medical, pharmaceutical, nutraceutical, and cosmetic industries (Calijuri et al 2022). Accordingly, the market price for microalgae biomass depends on the purity and application of the bioactive compounds. In this respect, Llamas et al (2021) classified microalgae biocompounds into three groups: low-value products with a selling price of 1000 €/t (biofuels, biofertilizers), medium-value products with a selling price of 10,000 €/t (lipids, carbohydrates, proteins), and high-value products for 100,000 €/t (nutraceuticals, pigments, and antioxidants).
The recovery and bioactivity of microalgae compounds mostly depend on growth parameters and living conditions, such as nutrient medium, temperature, light exposure, light intensity, pH, and aeration (Tang et al 2020). One of the most important factors for the autotrophic microalgae growth and biocompounds accumulation is the photoperiod since it can alter the photosynthesis process and metabolic pathways, which is reflected in the economic feasibility and cultivation process (Deng et al 2019). De Morais et al (2022) stated that the photoperiod is a critical factor that determines biomass growth and biocompunds production because it has an effect on the mechanisms and the quantity of energy that cells receive. This means that the photoperiod cycles are crucial during microalgae growth; a shortage in light energy exposure (fewer light hours) or excessive lightning (fewer dark hours) can inhibit or enhance microalgae growth (Yan and Zheng 2013). For these reasons, the use of controlled systems under artificial light has been developed to evaluate their performances under optimal conditions. A significant number of studies reported the effect of the photoperiod cycles on cell growth and CO2 fixation efficiency in a wide variety of microalgae cultures. Overall, it was reported that the photoperiod impact directly on the metabolic pathways and growth rate (Mohapatra et al 2022). Yang et al (2022) stated that cell density, CO2 fixation ability, and the production of pigments, lipids, and proteins reached the maximum value by using a longer light photoperiod. On the other hand, if the photoperiod is too short or too long could produce a harmful effect on microalgae cells, such as oxidative or photic damage and the production of unwished species (Xiao et al 2016).
Biomass accumulation and microalgae growth depends on photosynthetic efficiency during the cultivation process; cultures with higher photon conversion efficiency are characterized by elevated biomass accumulation and productivity (Xue et al 2020). Therefore, increasing the photosynthetic efficiency and light absorption is the major bottleneck for the enhancement of biomass production. Different strategies to increase biomass production have been recently explored. For example, photonic engineering converts photons from different wavelengths to turn them into an absorbable spectrum; however, this technology is still under development (Cho et al 2019, Shen et al 2023). On the other hand, Agathokleous et al (2019) irradiated microalgae under specific red and blue light exposures to increase cell growth rate and enhance lipid production, but it has not shown economic feasibility. Some nanoparticles like TiO2 and ZnO have been used to stimulate microalgae growth; however, adverse effects were observed (Xue et al 2020). Similarly, Kang et al (2019) reported growth inhibition caused for toxic metal ions dissolved in the microalgae culture, which promotes oxidative stress and cellular damage. In this context, the addition of carbon dots (CDs) into microalgae cultures is proposed as an effective and sustainable alternative to promote cell growth and bioresources production.
CDs are novel fluorescent carbon-based nanomaterial with excellent properties such as chemical stability, tunable emission, biocompatibility, fluorescence, up-conversion properties, light absorption capacity, and easy and low-cost synthesis (González-González et al 2022a, Lopez-Cantu et al 2022, Villalba-Rodríguez et al 2022). Their interesting properties might lead to enhanced energy capture, growth rate, and photosynthesis efficiency when interacting with microalgae cultures (Zuo et al 2016); thus, their supplementation might stimulate microalgae growth and photosynthesis efficiency.
In the existing literature, studies investigating the effect of CDs on microalgae mainly employ pure chemicals as carbon precursors for the CDs' synthesis (Zhao et al 2021, Yang et al 2022). While these studies have contributed valuable insights into the interaction between CDs and microalgae, as well as the positive role of CDs in the enhancement of biocompound production, a significant knowledge gap persists in our understanding concerning the potential benefits offered by CDs derived from green precursors. In the present work, CDs were synthesized from orange juice using a straightforward low-temperature carbonization method. This approach aimed to enhance biocompatibility and cost-effectiveness, aligning with the increasing focus on sustainable synthesis techniques. Furthermore, this study aim to examine the influence of different dosages of CDs (0, 0.5, 1.0, and 2.0 mg l−1) on Chlorella vulgaris growth under varying photoperiod conditions, an aspect that has been underexplored in the existing literature. By analyzing the combined effects of CDs derived from green precursors and photoperiod variations, we aim to identify a dual strategy with great potential for enhancing biomass growth.
2. Material and methods
2.1. Synthesis and characterization of carbon dots
CDs nanoparticles were synthesized using a simple carbonization procedure adapted from Chatzimitakos et al (2017). Briefly, orange juice extracted from fresh oranges was centrifuged at 4,000 rpm for 15 min to further filtration under vacuum. The purified juice was mixed with urea –used as a nitrogen source– in a ratio of 1 g and 2 g of urea per 10 ml of juice, respectively. The samples were placed in crucibles and heated for 3 h in a furnace at 220 °C. After cooling to room temperature, the homogenous brown-black residues were ground into a fine powder. Then, the powder was dispersed into 40 ml double distilled water (DDW) under ultrasonication for 10 min. Thereafter, the dispersion was centrifuged at 4,000 rpm for 15 min and the supernatant was filtered using a 0.20 μm syringe filter. CDs were freeze-dried to obtain a light-brown powder, which was stored in dark until its use (figure 1).

Figure 1. Schematic illustration of the synthesis of orange juice-derived CDs through carbonization.
Download figure:
Standard image High-resolution imageFour samples of CDs were obtained varying the temperature (180 and 220 °C) and the dosage of urea (1 g and 2 g). According to the temperature and urea concentration, samples were identified as 'CDs-180-1gU', 'CDs-180-2gU', 'CDs-220-1gU', and 'CDs-220-2gU'. The CDs sample identified as CDs-220-2gU was selected for further experimentation in microalgae because it exhibited the best results during characterization.
CD samples were analyzed using different characterization techniques to evaluate specific properties. For instance, the Fourier-transform infrared spectroscopy (FTIR) technique was used to identify the functional groups on the surface of CDs. FTIR spectra were obtained using an FT-IR Spectrometer (PerkinElmer, Waltham, MA, USA) with the Universal ATR sampling accessory. The analysis was performed in a transmission range of 400 cm−1 to 4000 cm−1 with 64 scans. On the other hand, the optical properties of CDs were examined using a UV–visible spectroscopy equipment, which revealed the absorption region of CDs. Measurements were performed with a PerkinElmer UV/vis Lambda 365 in the wavelength range of 200–800 nm using dilutions of all CDs' samples. The fluorescence properties of CDs were evaluated as well; the fluorescence intensity and the steady-state emission spectra of CDs were obtained by an F-4600 spectrofluorometer. Finally, the ζ potential analysis was employed to analyze the stability and surface charge of CDs. The technique used was Phase-analysis light scattering (PALS) with a NanoBrook 90Plus PALS Brookhaven, which performed ten measurements for each sample using the Smoluchowski equation.
2.2. Microalgae culture and carbon dots addition
Chlorella vulgaris from UTEX (UTEX, Austin, TX, USA) was used for further experimentation. Microalgae culture stock was placed with a brand OPTIMA 4.5-Watt pump with an air filter of 0.20 μm, 1.5 l m−2 min−1 of aeration, and a photoperiod of 12 h:12 h and 16 h:8 h (light:dark) (Hydro grow extreme LED lamps). The temperature was kept at 21 °C. The culture medium used for the microalgae growth was BG11, which contains NaNO3 1.5 g l−1, K2HPO4 40 mg l−1, CaCl2 · 2H2O 36 mg l−1, MgSO4 · 7H2O 75 mg l−1, Citric Acid · H2O 6 mg l−1, Ferric Ammonium Citrate 6 mg l−1, Na2EDTA · 2H2O 1 mg l−1, Na2CO3 20 mg l−1, H3BO3 2.86 mg l−1, MnCl2 · 4H2O 1.81 mg l−1, ZnSO4 · 7H2O 0.22 mg l−1, Na2MoO4 · 2H2O 0.39 mg l−1, CuSO4 · 5H2O 0.079 mg l−1, and Co(NO3)2 · 6H2O 0.04 mg l−1.
For the experiments, 20 ml of C. vulgaris culture at a concentration of 1 g l−1 were inoculated into 180 ml of BG11 medium, using 250 ml Erlenmeyer flasks. To evaluate the photoperiod effect in CDs-microalgae systems, it was used two photoperiod cycles of 12 h:12 h and 16 h:8 h (light:dark) for ten days. The CDs sample identified as 'CDs-220-2gU' was added into the microalgae cultures on days 0 and 5 at different dosages including 0 (control), 0.5, 1.0, and 2.0 mg l−1; all experiments were conducted in triplicate (figure 2).
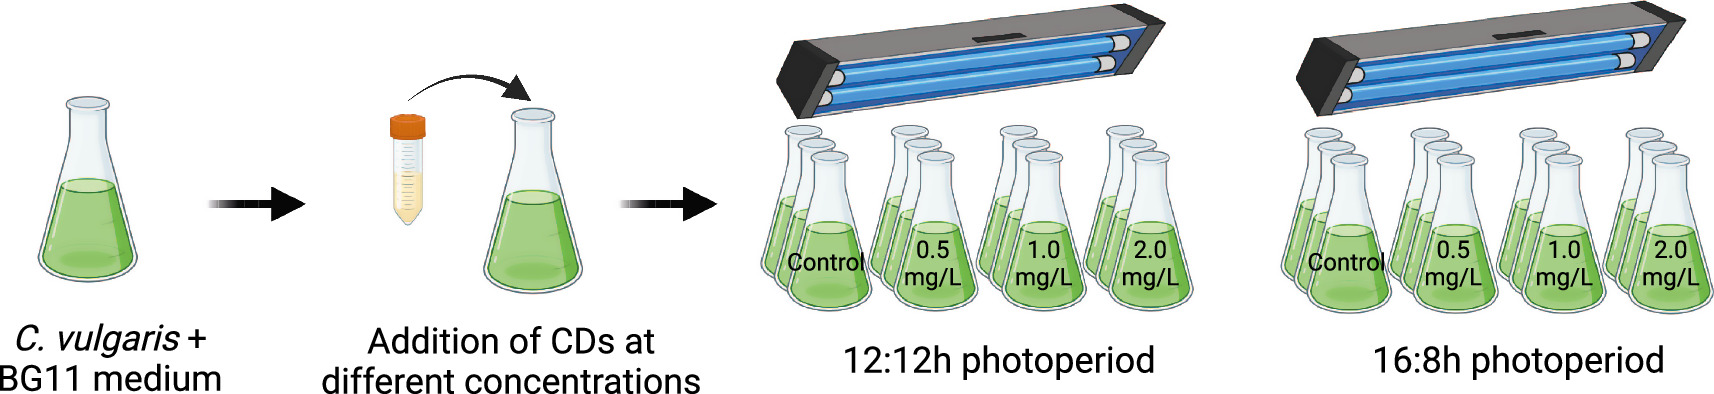
Figure 2. Schematic illustration of the cultivation of C. vulgaris under CDs supplementation and different photoperiod cycles (12 h:12 h and 16 h:8 h).
Download figure:
Standard image High-resolution image2.3. Biomass growth of C. vulgaris under different concentrations of carbon dots
The biomass growth of C. vulgaris under different CDs dosages was evaluated every 24 h by measuring the optical density of the cultures at 750 nm using a spectrophotometer (Fluorstar omega, 415-0470). Previously, a standard curve was performed to relate the optical density of the inoculum with its dry mass. The dry weight (g/L) was determined by filtering 10 ml of algal culture using pre-weighed Whatman GF/C glass microfiber filters. The filter with the algal biomass held was dried at 100 °C for 2 h. Then, filters with the algal biomass were cooled at room temperature inside a vacuum desiccator and weighed gravimetrically.
2.4. Biomass characterization of C. vulgaris under different concentrations of carbon dots and photoperiods
C. vulgaris cultures were sampled by taking 50 ml of the culture on days 5 and 10. These samples were stored at 4 °C until their use. To determine the protein, carbohydrate, and lipid production, biomass was washed with bi-distilled water and centrifuged at 4,000 rpm for 10 min at 10 °C. Then, the supernatant was discharged and the biomass was washed twice and resuspended in distilled water.
2.4.1. Carbohydrate production of C. vulgaris under different concentrations of carbon dots and photoperiods
Carbohydrate content analysis was performed using the enhanced phenol-sulfuric method reported by Zhang et al (2020). Firstly, 300 μl from washed biomass was mixed with 1 ml of concentrated sulfuric acid. Then, samples were placed in a recipient with ice for 5 min for further measurements of absorbance at 315 nm using a microplate BGM Labtech. Finally, the absorbance data was used to determine the carbohydrate production (mg/g) by using the glucose standard curve, previously determined.
2.4.2. Protein production of C. vulgaris under different concentrations of carbon dots and photoperiods
The protein assay was performed through the enhanced Lowry Protein Assay Kit (Thermo Fisher Scientific). Firstly, 200 μl of washed biomass were mixed with 1 ml of Lowry's reagent. Then, tubes containing the mixture was vortexed in dark and stored for 10 min. Afterward, 100 μl of Folin reagent was added to each sample and vortexed again. Samples were stored in dark for 20 min and then the absorbance was measured at 750 nm using a microplate BGM Labtech. Finally, protein production was determined by using a Bovine Serum Albumin (BSA) calibration curve, which was previously performed.
2.4.3. Lipid production of C. vulgaris under different concentrations of carbon dots and photoperiods
Lipid content analysis was performed using the sulfo-phospo-vanillin method reported by Mishra et al (2014). Firstly, 2 ml of sulfuric acid at a concentration of 98% was added to 100 μl of concentrated washed biomass (10:1). Then, samples were heated for 10 min at 100 °C. Samples were cooled in an ice cube for 5 min and after the addition of 5 ml of sulfo-phospo-vanillin reactive, samples were incubated at 37 °C for 30 min. Finally, absorbance was measured at 530 nm using a microplate reader BGM Labtech. The lipid concentration was obtained using a canola oil calibration curve, previously established.
2.5. Data analysis
The statistical analysis was performed using Minitab 21 (Minitab Inc.). A multi-factor analysis of variance (ANOVA) with Tukey's post-hoc tests was employed for the entire experiment, considering both photoperiods and all conditions related to carbon dots. The significance was set at α = 0.05.
3. Results
CDs nanoparticles were characterized through different techniques. The CDs' properties were analyzed in terms of their optical properties, functional groups, morphology, size, and stability. The CDs sample which exhibited the best properties (CDs-220-2gU) was selected for further experimentation with microalgae cultures. Microalgae and biomass production were finally evaluated when CDs were added to the media.
3.1. Synthesis and characterization of carbon dots
The CDs were synthesized via carbonization in an open environment using orange juice and urea as the carbon and nitrogen source, respectively. All CDs' samples exhibited good fluorescence activity under UV light irradiation (figure 3(a)). The surface chemical states and elemental characterization of the CDs were determined by FTIR analysis (figure 3(b)). The peaks identified at 1660,1600, 1400, 1349, 1070, 1000, and 910 cm–1 confirmed the presence of C=C, C=C, O–H/S=O, C–N, C–O, C=C, and C=C bonds, respectively (Chen et al 2018). Specifically, the samples processed at 180 °C presented a peak at 2920 cm–1, this peak is attributed to a C–H bond presence, which is formed for a hydrogen atom on the periphery of a benzene structure (Hu et al 2021). The results suggest that the surface of CDs nanoparticles is mainly composed of functional groups containing C, O, and N elements. The N-containing groups are produced because of the addition of urea during the synthesis. The O–H (alcohol) groups detected on the CDs' surface explain the high-water solubility of the synthesized CDs, as a result of their polar molecular bond.
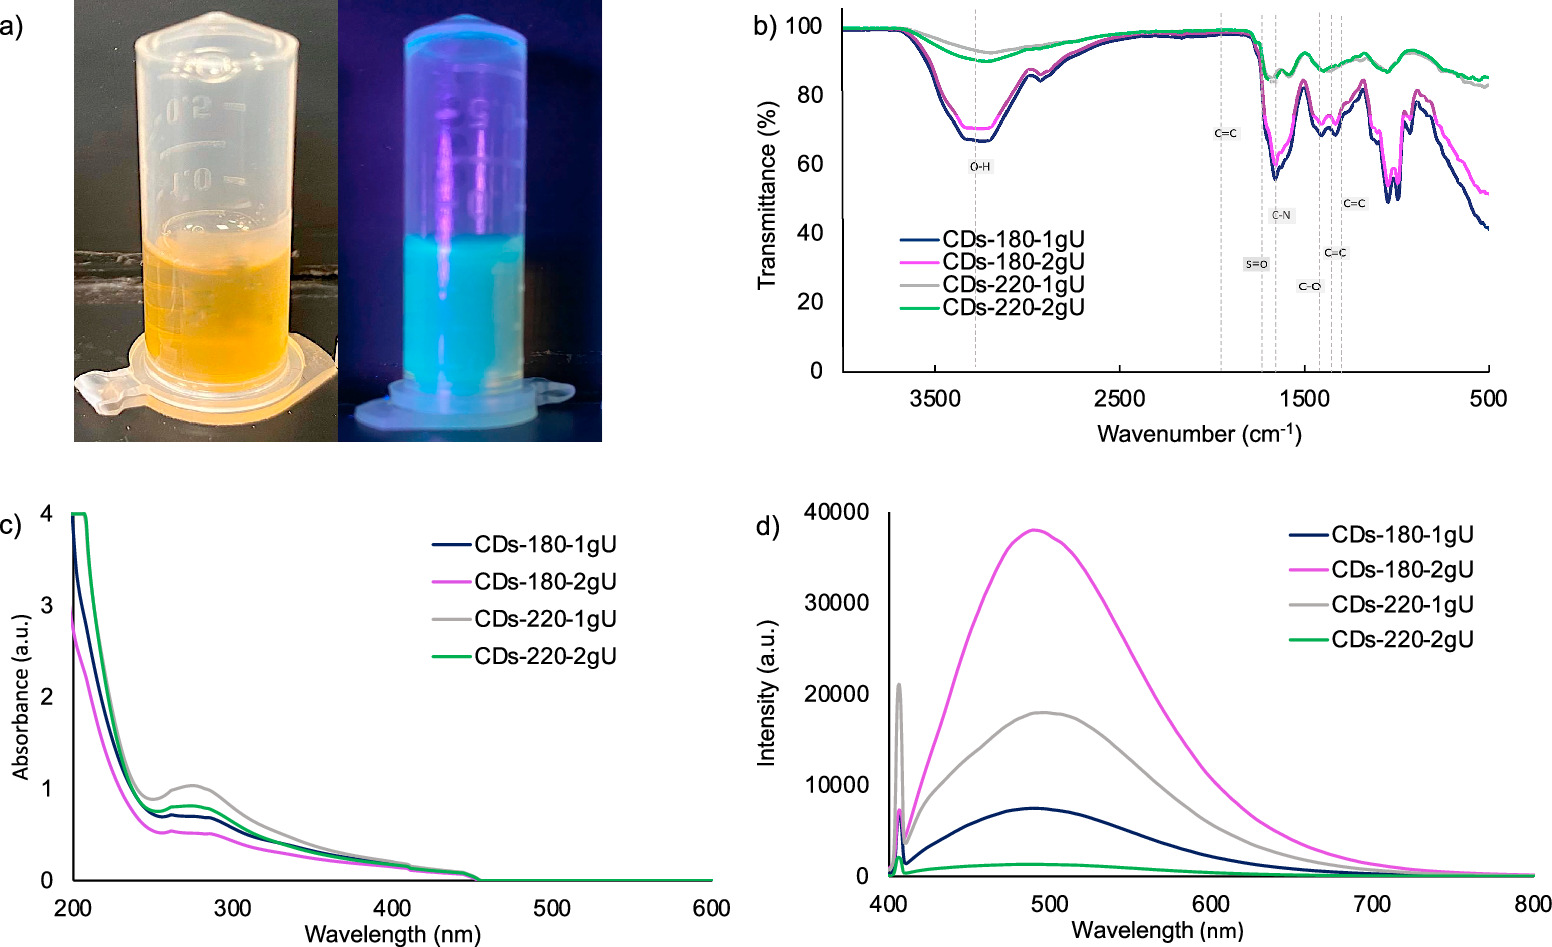
Figure 3. Characterization of orange juice-derived CDs; (a) Images of orange juice-derived CDs under normal light (left) and under UV-lamp (right), (b) FTIR spectra of CDs, (c) UV–vis absorption of CDs, and (d) fluorescence emission spectra CDs.
Download figure:
Standard image High-resolution imageThe UV–vis spectra showed the optical properties of CDs. As shown in figure 3(c), all the samples presented a peak at 260 nm, which reflects a conjugation for the CDs' structure. The specific peak at 260 nm is related to the  transition of the chromophore C=C. The peak at 285 nm was attributed to the
  transition of C=N (González-González et al
2022b). Finally, the peak presented at 410 nm was related to the
transition of C=N (González-González et al
2022b). Finally, the peak presented at 410 nm was related to the  transition associated with functional groups attached to the surface of CDs (Nie et al
2014).
transition associated with functional groups attached to the surface of CDs (Nie et al
2014).
On the other hand, diluted samples were analyzed in a fluorescence spectrophotometer to determine the CDs emission intensity under an excitation wavelength of 380 nm (figure 3(d)). The CDs-180-2gU sample showed the highest emission intensity, followed by CDs-220-1gU, CDs-180-1gU, and CDs-220-2gU. Yang et al (2018) stated that the temperature of the process altered the degree of carbonization of the carbon core and the compounds attached to the surface of CDs. In this manner, the fluorescence intensity is highly dependent on the carbon core and the surface states (Hu et al 2021). The highest emission intensity obtained with sample CDs-180-2gU might be attributed to the temperature and nitrogen content. During the synthesis, the energy from the spontaneous reaction broke the molecule into smaller pieces, after carbonization, and then different chemical groups are formed over their surface (Yu et al 2012). Contrarily, excess energy during high temperature-synthesis procedures might carbonize the chemical groups formed over the CDs surface (Yu et al 2012), producing a significant decrease in the fluorescence intensity of CDs (Yang et al 2018). As shown in figure 3(d), the maximum emission intensity of CDs samples was presented at a wavelength of approximately 500 nm.
The ζ potential was measured to determine the surface charge due to the presence of functional groups on the surface of CDs nanoparticles and the stability. All samples presented a negative charge (table 1) suggesting that there is an electron concentration over the CDs' surface (Long et al 2022). This negative charge might be associated with carboxyl, hydroxyl, and carbonyl groups, placed over the surface of CDs (Chen et al 2016). The CDs- 220-1gU sample showed the lowest absolute value, which indicates low physical stability and agglomeration tendency produced by cohesion forces (Vieira et al 2015). The other three samples presented a higher value, which is associated with repulsive forces and good electrical stability (Joseph and Singhvi 2019). The selected sample to use in microalgae culture (CDs-220-2gU) presented a value of −26.3 mV, which indicates the presence of functional groups and excellent stability (Shnoudeh et al 2019).
Table 1. ζ potential results obtained from synthesized CDs.
| Samples | ζ potential (mV) |
|---|---|
| CDs-180-1gU | –22.46 ± 0.90 |
| CDs-180-2gU | –16.59 ± 0.65 |
| CDs220-1gU | –5.34 ± 0.89 |
| CDs-220-2gU | –26.3 ± 0.48 |
The selection of CDs samples for further addition to microalgae culture was based on the stability, fluorescence intensity, and content of functional groups. The selected sample (CDs-220-2gU) showed excellent stability with a ζ potential value of –26.3 mV, suggesting a negative charge and good stability in the media (González-González et al 2020). The FTIR results showed that the selected sample possesses C–O, C–N, and O–H groups on the CDs' surface, which might be beneficial for further experimentation due to increased water solubility and N-containing groups associated with enhanced optical properties. Finally, the results from fluorescence analyses showed that the selected CDs sample has a maximum peak at 400 and 500 nm (red region), which might shift the light absorption spectra and capture more photons, which in turn might enhance the light absorption and increase microalgae growth (Zhao et al 2021).
3.2. Biomass growth of C. vulgaris under different carbon dots concentration and photoperiods
The biomass growth of C. vulgaris under different CDs concentration and photoperiod cycles was analyzed. Overall, the addition of CDs increased microalgae biomass production in the first five days of culture. For instance, higher biomass production of 1 g l−1 and 0.96 g l−1 was obtained with the addition of 1.0 and 2.0 mg l−1 of CDs compared with the control under the 12 h:12 h (light:dark) photoperiod, respectively (figure 4(a)). At day 10, C. vulgaris supplemented with 1.0 mg l−1 of CDs showed the highest biomass production (1.04 g l−1) in this photoperiod, followed by the addition of 2.0 mg CDs/L (1.01 g l−1). The results are similar to those reported by Anyanwu et al (2022); in their work, C. vulgaris was cultivated under the same 12 h:12 h photoperiod obtaining a biomass production of 1.482 g l−1 after 16 days of cultivation.

Figure 4. Biomass growth (g/L) for ten days of C. vulgaris with the addition of 0, 0.5, 1.0, and 2.0 mg l−1 of CDs (a) under the photoperiod of 12 h:12 h (light:dark) and (b) under the photoperiod of 16 h:8 h (light:dark). All samples were conducted in triplicate.
Download figure:
Standard image High-resolution imageIt should be noted that the cell growth decreased after 5 days, which might be related to the addition of CDs. This phenomenon can be shown in all the treatments, but also, it can be observed that after 8 days, the microalgae started to grow again (also, this can be observed in the 16 h:8 h photoperiod). It is supposed that the exponential phase of cells was affected by the CDs supplementation, is important to note that 1.0 and 2.0 mg l−1 of CDs treatments were less affected in comparison to 0.5 mg l−1 of CDs. This can be associated with the potential of CDs to increase light capture, which is critical during the photosynthesis process for cell growth and biocompounds production (Yan and Zheng 2013). CDs nanoparticles can increment the red light (650–700 nm) absorption by shifting the photoluminescence promoting cell growth and light capture, which has been also demonstrated by other authors (Xue et al 2020). In addition, CDs attached to the cell wall of microalgae can increase the light absorption of blue photons (400–525 nm) (Yang et al 2022).
On the other hand, microalgae cultures under the 16 h:8 h (light:dark) photoperiod presented higher biomass production in comparison to the equivalent samples at the 12 h:12 h photoperiod (figure 4(b)). This demonstrates the strong influence of the light exposure both on the photosynthetic activity of microalgae and on the role of CDs during light capture. Microalgae with no supplementation of CDs presented a biomass production of 2.12 g l−1, which is a higher production compared to 12 h:12 h (light/dark) photoperiod (1 g l−1). Also, biomass production was higher in comparison to the reported by Deng et al (2019), which cultivated Chlorella kessleri under mixotrophic conditions (2 gL–1 glucose and 20 h:4 h light/dark photoperiod) and obtained a maximum biomass production of 1.17 g l−1 after 7 days of cultivation.
Under 16 h:8 h (light/dark) photoperiod, the supplementation of 0.5 mg l−1 of CDs increased microalgae growth to 2.4 g l−1. Interestingly, higher concentrations of CDs (1.0 and 2.0 mg l−1) decreased biomass production. This result suggests a biomass growth inhibition caused by cellular stress, which is produced by high dosages of CDs under longer periods of light. Excess light produces cell damage and oxidative stress, which might reduce biomass production in those samples (Minhas et al 2023). Therefore, the optimum dosage of CDs was 0.5 mg l−1 under the 16 h:8 h (light/dark) photoperiod. This may imply that at a lower light photoperiod (12 h:12 h light/dark) it is recommended to use concentrations greater than 1.0 mg l−1 of CDs, on the contrary, if there is an extended exposure of light (16 h:8 h light/dark) it is advisable to use lower concentrations of CDs (less than 1.0 mg l−1). These results can be very useful for the growth of microalgae in outdoor conditions, where the light depends on the geographical location. In the statistical analysis (ANOVA-Tukey's test) of cell growth, it was observed that a higher microalgae biomass was obtained under a photoperiod of 16 h:8 h light/dark across all conditions compared to the alternative photoperiod. In addition, the treatment exhibiting the highest biomass production was observed to be the one administrated with 0.5 mg l−1 of CDs after 10 days of culture under a 16 h:8 h light/dark photoperiod, yielding 2.34 g l−1.
3.3. Carbohydrate production of C. vulgaris under different carbon dots concentration and photoperiod cycles
The effect of both the addition of CDs and photoperiod cycles on the carbohydrate production was determined after days 5 and 10 of culture (figure 5). Under the photoperiod of 12 h:12 h (light:dark), C. vulgaris (with no addition of CDs) produced 173 mg g−1 dry weight of carbohydrates after 10 days. Hamidian and Zamani (2022) reported a similar value (163 mg g−1 dry weight) of carbohydrates content during Chlorella sp. cultivation without any nanomaterial addition. In our study, the carbohydrate production was considerably increased after the addition of CDs (figure 5(a)). The highest carbohydrate production was achieved with the addition of 1.0 mg l−1 of CDs, which reached 211 mg g−1 dry weight and 217 mg g−1 dry weight on day 5 and 10, respectively, which represents an enhancement of 44 mg g−1 dry weight in carbohydrate production (25% increase in comparison to the control).
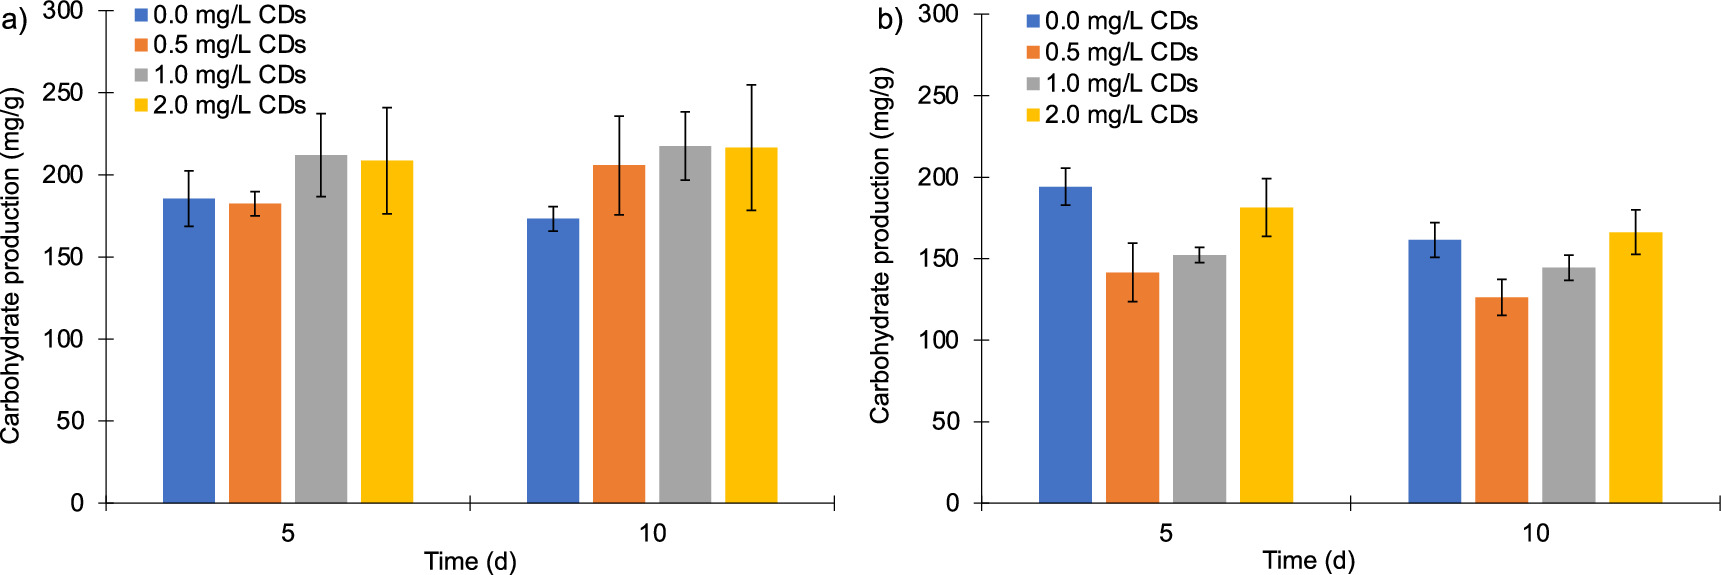
Figure 5. Carbohydrate production (mg/g dry wt) of C. vulgaris after the addition of 0, 0.5, 1.0, and 2.0 mg CDs/L. (a) Carbohydrate production under the 12 h:12 h (light:dark) photoperiod. (b) Carbohydrate production under the 16 h:8 h (light:dark) photoperiod. All samples were conducted in triplicate.
Download figure:
Standard image High-resolution imageThese results do not follow the same trend under the 16 h:8 h (light/dark) photoperiod (figure 5(b)); the maximum carbohydrate production reached 194 mg g−1 dry weight after 5 days with no addition of CDs. This showed that a longer light period contributes to reducing carbohydrate content. Interestingly, the addition of CDs under these conditions had negative effects, which might be attributed to cell damage produced by an excess of light and a modification of the photosynthetic pathways caused by the nanoparticles (Priyadharsini et al 2022). During the photosynthesis process, light is captured and turned into biomolecules; in the first stage, light energy is directed to synthesize pigments, in this manner, a major quantity of energy could have been designated to produce more pigments and only a lower adenosine triphosphate (ATP) and nicotinamide adenine dinucleotide phosphate (NADPH) could be able for carbohydrate production (de Carvalho Silvello et al 2022). Xue et al (2020) reported a higher carbohydrate production of 110 mg l−1 (250 mg g−1 dry wt) cultivating Chlorella regularis (FACHB-729). Their culture was supplemented with CDs synthesized from citric acid as the precursor. Their work reported 28% more carbohydrate production than the present study; such differences can be attributed to the precursor nature and microalgae strains. In this respect, the economic feasibility of using pure precursors or natural/waste precursors for the synthesis of CDs should be considered as well. Regarding the statistical analysis (ANOVA-Tukey's test) of carbohydrates, it was observed that a higher amount was synthesized under a photoperiod of 12 h:12 h light/dark throughout the entire experiment. The treatments exhibiting the highest carbohydrate production were those with 1 mg l−1 and 2 mg l−1 of CDs at 10 days of culture under 12 h:12 h light/dark photoperiod, where 217.5 mg g−1 and 216.6 mg g−1 were synthesized, respectively.
3.4. Protein production of C. vulgaris under different carbon dots concentration and photoperiod cycles
The protein production of C. vulgaris under different photoperiod cycles and CDs dosages was determined as well. As presented in figure 6(a), after 10 days, the addition of 2 mg l−1 of CDs showed a maximum protein production (203 mg g−1 dry wt) in a 12 h:12 h (light/dark) photoperiod. In contrast, microalgae without the addition of CDs presented a protein production of 180 mg g−1 dry wt. On the other hand, microalgae cultures under the photoperiod of 16 h:8 h (light/dark) presented higher protein production (figure 6(b)). At day 5, microalgae cultures with 1.0 mg l−1 and 2.0 mg l−1 of CDs presented a protein production of approximately 200 mg g−1 dry wt, which was significantly higher in comparison to the control samples (with no CDs' addition), which presented only 170 mg g−1 dry wt. At day 10, the maximum protein production reached 285 mg g−1 dry wt with the addition of 2.0 mg l−1 of CDs, which represents an enhancement of 74 mg g−1 dry wt in carbohydrate production (35% more compared with the control). It is interesting to observe, that the best concentration of CDs is 0.5 mg l−1 for protein production, since it reached 542 mg of proteins per liter of microalgae culture. In contrast, the protein production obtained by the control and microalgae supplemented with 2.0 mg l−1 of CDs was 430 and 396 mg of proteins per liter, respectively.

Figure 6. Protein production (mg/g dry wt) of C. vulgaris after the addition of CDs at different concentrations (0, 0.5, 1.0, and 2.0 mg l−1) under (a) 12 h:12 h photoperiod cycle and (b) under 16 h:8 h photoperiod cycle (light/dark). All samples were conducted in triplicate.
Download figure:
Standard image High-resolution imageThese results showed protein productivity aligned with the work reported by İnan et al (2023); they cultivated Chlorella variabilis and harvested a maximum protein production of 330 mg g−1 dry wt under 24 h of light exposure. The protein production presented in our study is higher than that obtained by Xue et al (2020), who cultivated Chlorella regularis and reported a maximum protein production of 84 mg l−1 (136 mg g−1 dry wt) after 12 days and the addition of 1 mg l−1 of CDs. The significant increment in protein production achieved in this study is attributed to the effect produced by the addition of CDs and their interaction with microalgae cells. In the statistical analysis (ANOVA-Tukey's test) of proteins production, it was determined that a greater quantity was synthesized under a photoperiod of 16 h:8 h light/dark throughout the experiment. The treatment yielding the highest protein production was with 2 mg l−1 of CDs at 10 days of culture under the 16 h:8 h light/dark photoperiod, where 285 mg g−1 of proteins were generated.
3.5. Lipid production of C. vulgaris under different carbon dots concentration and photoperiod cycles
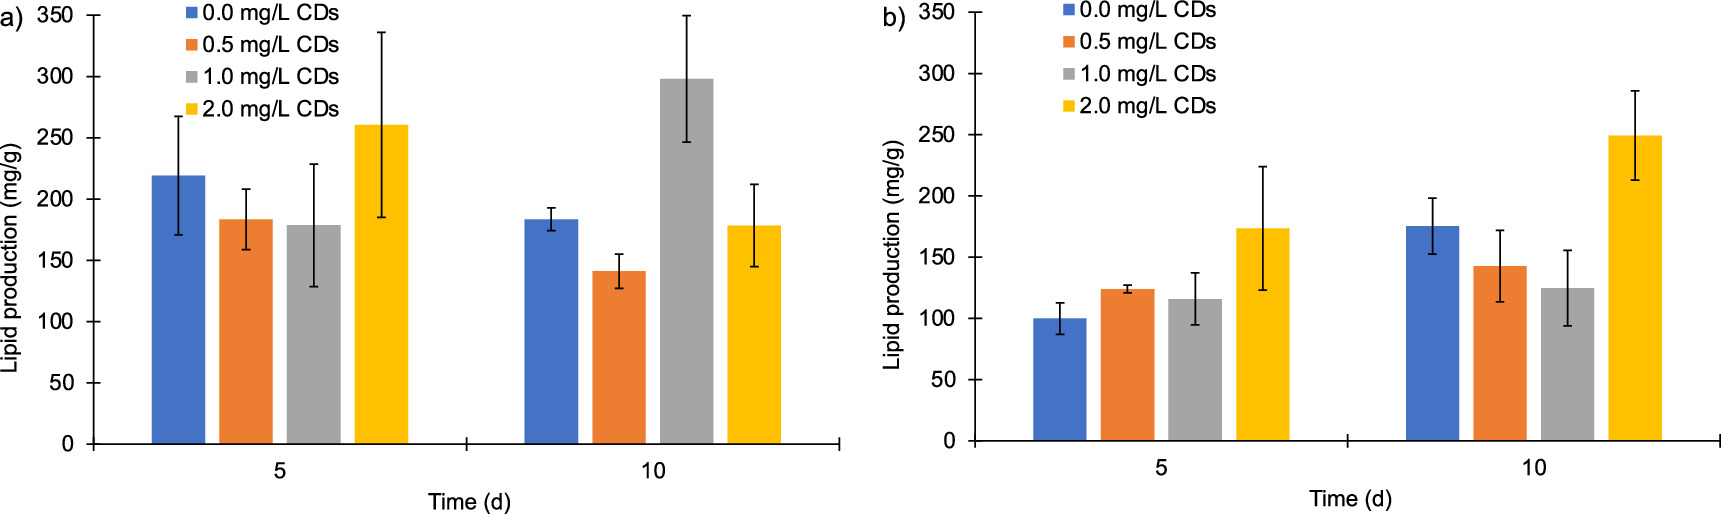
The lipid production of C. vulgaris under two different photoperiod conditions and the addition of CDs at different dosages were determined. At day 5 under the photoperiod of 12 h:12 h, the maximum lipid production (260 mg g−1 dry wt) was reached with the addition of CDs at 2.0 mg l−1 (figure 7(a)). In contrast, microalgae with the addition of 1.0 mg l−1 of CDs showed a lower value of 178 mg g−1 dry wt. On the other way, at day 10 of the microalgae culture, the maximum lipid production (298 mg g−1 dry wt) was reached with the addition of CDs at 1.0 mg l−1, which represented an enhancement of 114 mg g−1 dry wt in lipid production (>50% compared with the control).
Figure 7. Lipid production (mg/g dry wt) of C. vulgaris with the addition of CDs at different dosages (0, 0.5, 1.0, and 2.0 mg l−1) (a) under a photoperiod of 12 h:12 h and (b) under a photoperiod of 16 h:8 h (light:dark).
Download figure:
Standard image High-resolution image
An improvement in lipid production under the photoperiod of 16 h:8 h (light/dark) was observed (figure 7(b)). At day 5, the maximum lipid production (173 mg g−1 dry wt) was reached with the addition of CDs at 2.0 mg l−1. On the other hand, the control sample (with no addition of CDs) presented the lowest lipid productivity (99 mg g−1 dry wt). Also, the maximum lipid production (249 mg g−1 dry wt) was obtained with the addition of 2.0 mg l−1 of CDs after 10 days.
According to the literature, Xue et al (2020) cultivated C. regularis with the addition of CDs; they reported a maximum lipid production of 260 mg l−1 (333 mg g−1 dry wt) with a CDs dosage of 1 mg l−1. These results are aligned with the obtained in this work; the addition of 0.5 mg l−1 and 2.0 mg l−1 of CDs with a photoperiod of 16 h:8 h (light/dark) resulted in 175 mg g−1 dry wt and 249 mg g−1 dry wt of lipids, respectively. Under the photoperiod of 12 h:12 h (light/dark) it was obtained 298 mg g−1 dry wt of lipids, after the addition of 1 mg CDs/L. In the statistical analysis (ANOVA-Tukey's test) of lipid production, it was observed that a higher amount was produced under a photoperiod of 12 h:12 h light/dark throughout the experiment. The treatment yielding the highest lipid production occurred with 1 mg l−1 of CDs at 10 days of culture under the 12 h:12 h light/dark photoperiod, resulting in the synthesis of 298 mg g−1 of lipids.
Wahidin et al (2013) studied the effect of the photoperiod cycles on Nannochloropsis sp. cultures; they found that the maximum lipid content was obtained with a longer light period (18:6 h light/dark); however, a complete light period (24 h:0 h light/dark) produced a negative effect on the lipid content. In this sense, the higher lipid production of C. vulgaris cultures under the 12 h:12 h (light/dark) photoperiod can be attributed to the fact that under this photoperiod the cells received the optimum amount of energy to store and use during lipid synthesis. On the other hand, the longer light period (16 h:8 h light/dark) could have produced cellular stress, which decreased lipid synthesis.
4. Discussion
It was demonstrated that the photoperiod cycle is a significant parameter to optimize microalgae growth. This is due to the microalgae's capacity to capture light and store it as an energy source, which is used during cell protoplasm synthesis and the production of ATP used for cellular pathways. The significant role of light exposure during microalgae growth is demonstrated with the maximum biomass production of 2.4 g l−1 by C. vulgaris under extended light exposure (16 h:8 h light/dark photoperiod).
Contrastingly, the photoperiod of 12 h:12 h (light/dark) did not supply enough light during microalgae growth. In this manner, due to insufficient light capture, the biomass growth was driven to photo-limitation conditions, where an extra light capture source is necessary to increase the microalgae growth, otherwise, the cell growth could be inhibited (Chen et al 2011). The green-synthesized CDs could increase light adsorption due to the ability of such nanoparticles to shift the ultraviolet light (500–600 nm) and turn it into red light (580–700 nm) (Zhao et al 2021).
The photosynthesis antenna proteins from microalgae cells adsorb photons during the light periods and the stored energy is conducted to the reaction centers of cells to begin photochemical reactions and produce biomass and other biocompounds (Priyadharsini et al 2022). This is why the addition of CDs in combination with an extended period of light exposure (16 h:8 h light/dark) led to remarkable enhancements in all the results: biomass production, carbohydrate, protein, and lipid content. The better results obtained under the photoperiod of 16 h:8 h (light/dark) demonstrated that C. vulgaris is better adapted in a higher light environment. The results revealed that the biomass was increased because of lag phase was shorter, this means that the cells had a faster adaptation response, and then, exponential growth began earlier (Wahidin et al 2013)
It is supposed that the CDs were attached to the cell's surface because of the presence of functional groups placed over the cell wall and their attractive forces (C=C, O–H, C–N, C–O) (Li et al 2019). These nanoparticles could help to increase the blue photon adsorption, which is used during the photosynthesis process of microalgae cells (Yang et al 2022). Based on this statement, the functional groups contained on CDs enhanced the light adsorption in C. vulgaris cultures, which produced higher biomass and specific biocompounds production, which depended on the optimum CDs concentration and light exposure.
Similarly, Zhao et al (2021) reported that the presence of CDs increased the production of proteins, pigments, and lipids. They stated that the CDs shift the absorption spectrum in microalgae and the red light captured promoted lipid and polyunsaturated fatty acids production (Zhao et al 2021). These results are also in agreement with those presented by Yang et al (2022), who added CDs in C. pyrenoidosa cultures; they reported an increment in the specific growth rate, lipid content, and pigment productivity in comparison to the control samples. Their results were attributed to the addition of CDs, which acted as regulators to adsorb more ultraviolet light, then the light captured was transformed into visible light, which was stored and used by microalgae.
In contrast, some researchers have reported negative results from the interaction of CDs with microalgae. For instance, Zhang et al (2019) conducted a study on the interaction of CDs with C. vulgaris; CDs were fabricated via electrochemical oxidation using graphite rods as electrodes. The authors found that their synthesized CDs might cause oxidative stress by generating reactive oxygen species, in addition to disrupting the photosynthetic system of the microalgae (Zhang et al 2019). Similarly, Todorenko et al (2023) also reported negative effects from the interaction of CDs with Scenedesmus quadricauda microalgae. In their study, CDs were fabricated using different techniques (electrochemical, microwave, and hydrothermal) and reagents/precursors (sodium citrate dihydrate, β-alanine, ascorbic acid, and graphite). Although there were no effects on the photosynthetic activity or evidence of oxidative stress induced by CDs, they observed a decrease in the microalgae growth rate due to a shading effect (Todorenko et al 2023).
One potential reason for the positive effects observed in our study –in contrast to studies conducted by Zhang et al (2019) and Todorenko et al (2023)– could be attributed to methodological differences. Specifically, we employed a carbonization technique using a green precursor (orange juice), in addition to variations in factors such as the selection of microalgae species and photoperiod conditions. Longer light periods improved cell growth and biocompounds production since the cells receive more energy to synthesize ATP and NADPH, which in turn are used during the metabolic pathways to produce biocompounds (Daneshvar et al 2022). In addition, the CDs improved light absorption and optimized photosynthetic activity, which promoted microalgae growth and the production of bioresources (Xue et al 2020). Thus, the combined strategy of extended light exposure and the addition of CDs at optimal concentration leads to enhanced production of biomass and bioresources by C. vulgaris.
This work contributed to the demonstration of the optical, chemical, and physical properties of CDs as an emergent technology to enhance microalgae cultures' biomass and its composition. In the same way, it was shown that longer light hours during photoperiod cycles increased biomass production, so this methodology could be applied and modified to produce specific biocompounds in an industrial-scale system. Further research about CDs supplementation in large-scale systems (open and closed), such as open raceway ponds, circular ponds, and closed bioreactors, among others is needed to evaluate the behavior of the nanoparticles during biomass production. In addition, it is expected to evaluate the response of C. vulgaris cultures with CDs supplementation, as a new strategy to increase CO2 capture and wastewater treatment.
5. Conclusions
The sustainable synthesis of CDs using orange juice as a natural precursor showed a positive response on microalgae growth and a potential application to increase bioresources productivity. The addition of CDs led to enhance absorption of light and proper conversion into visible light (580–700 nm). In addition, CDs were able to improve the photosynthesis efficiency since these nanoparticles enhance the PSII energy transfer system to convert the energy stored into biomass. The photoperiod conditions also played a significant role during cell growth and bioresources production. Overall, the photoperiod of 16 h:8 h (light:dark) showed an increment in biomass composition; a longer light period stimulates cell growth and biocompounds production. Under the optimal conditions (16 h:8 h photoperiod and 0.5 mg l−1 of CDs), maximum cell growth of 2.4 g l−1 was obtained after 10 days. The addition of CDs increased the protein, carbohydrate, and lipid content until reaching a maximum value of 285 mg g−1 dry weight (35% more than control), 216 mg g−1 dry weight (25% more than control), and 249 mg g−1 dry weight (50% more than control), respectively. In summary, the addition of CDs and a longer light period is a dual strategy with great potential for the enhancement of biomass growth and the production of high, medium, and low valuable biocompounds.
Acknowledgments
This work was supported by Consejo Nacional de Ciencia y Tecnología (MX) and Tecnologico de Monterrey, Mexico under Sistema Nacional de Investigadores (SNI) program awarded to Hafiz M N Iqbal (CVU: 735340). This work is a part of the program 'Estancia de investigación' of Tecnologico de Monterrey, Mexico. Authors thankfully acknowledged the support provided under the project entitled: 'Enhanced production of bioplastics by adding nanomaterials to microalgae'. Centro del Agua para América Latina y el Caribe from Tecnologico de Monterrey is gratefully acknowledged as well.
Data availability statement
All data that support the findings of this study are included within the article (and any supplementary files).
Author contributions
S S Flores: Writing—Original Draft, Investigation, Methodology, Visualization, Formal Analysis; I Y López-Pacheco: Methodology, Formal Analysis, Writing—Original Draft; A M Villalba-Rodriguez: Validation, Methodology; R Parra-Saldívar: Project Administration, Funding Acquisition, Supervision, Resources; R B González-González: Writing—Review & Editing, Conceptualization, Methodology, Investigation; H M N Iqbal: Writing—Review & Editing, Conceptualization, Supervision, Resources.
Conflict of interests
The authors declare no conflict of interest.