
Abstract
When evaluating published results from ice adhesion measurements to characterise the applicability of surface coatings, there is usually a large variation of the published properties and a high scattering of these values. Moreover ice adhesion is known as a highly susceptible parameter regarding the measurement temperature which additionally leads to deviations. This paper is a contribution to the evaluation of ice adhesion results and provides a correlation of the measurements with the surface characteristics. In the paper a novel instrumentalised method of a quasistatic ice adhesion test is proposed in order to measure additional information about force and displacement behaviour of adhered ice. The evaluation of several measurements reveals insights into nanoscopic processes in the interface during the adhesion process. Different modes of the adhesion process of ice, like clean breaks, sliding with almost no force, sliding with high forces, multiple breaks or multiple sticking, not only we found to correlate to the material, but also to methodological test parameters. The overlapping influence of surface characteristics and test parameters is highlighted.
Export citation and abstract BibTeX RIS

Original content from this work may be used under the terms of the Creative Commons Attribution 4.0 licence. Any further distribution of this work must maintain attribution to the author(s) and the title of the work, journal citation and DOI.
1. Introduction
Unwanted icing of technical equipment is a serious problem, not only in regions of cold climate with atmospheric induced icing but also in industrial fields like refrigeration engineering, wind turbines and heat exchanger systems. Ice accretion on surfaces causes efficiency losses of facilities, induces economic performance loss, alters the dynamic or aerodynamic balance of an engine, raises their total failure and maintenance rates and last but not least this undesired icing can lead to accidents with consequences for the health of the people involved. Several methods have been used to remove the ice, either based on mechanical scrapping approaches or on thermal and chemical methods to melt the ice crust. A major disadvantage of these so-called 'active' deicing methods is the requirement of external energy, chemicals and time. Therefore, the so-called 'passive' methods have received much attention over the past decades, to either completely avoid icing events, lower the ice adhesion or to support the active deicing methods. Many different strategies to design functional coatings have been developed since then, such as superhydrophobic coatings which have attracted widespread interest due to their textured surfaces that trap air at the air-coating interface and therefore minimise the contact area between ice and the periodic surface roughness [1–3]. Recent developments have led to coatings with specifically adjusted toughness where a low interface toughness seems to be particularly effective for deicing [4]. The currently used coating systems are able to decrease and to delay the adhesion of frozen ice [5–7]. Biomimetical principles have been implemented to interfere [8] and to slow down the process of spontaneous crystal seeding in supercooled water via an interaction of nanoscale surface clustering with hydrophilic and hydrophobic areas [9, 10]. The effect can be used to adapt biological tissues to the volume expansion during freezing. Elsewhere, an active switching of surface properties by an iterative changing of surface charges was described as being a method to interrupt crystal seeding repeatedly [11–13]. Functional coatings that combine a rigid pillar structure or rods with infiltrated lubricants or swelling gels (SLIPs) [14–16] undergo a change in their surface characteristics which depends on the surrounding humidity. The processes at the nanoscale have become a central issue in the development of icephobic coatings with low ice adhesion [17]. Unfortunately, up to now, most of the passive deicing strategies lack the necessary durability for practical applications and only a few researchers have addressed the issue of ageing by abrasion and weathering [18]. The selection and adaption of coating systems, which depends on the particular application and the combination of different deicing strategies to achieve a resilient coating system, is a central issue [19].
The challenge, arising from the diversity of developed coating systems, is being able to compare them and to estimate their anti-ice performance. There is still some considerable controversy which parameters are the most appropriate and accurate for a description of the processes at the ice-solid interface during freezing and ice detachment processes. In the literature there is an ongoing discussion about methods and parameters, where a classification of methodical aspects and parameters has begun to emerge. The most widely used characterisation methods are the centrifugal adhesion test and the horizontal pusher test. However, up to now, there are no standard methods used to perform the characterisation of anti-icing coating systems [20]. In this paper a novel version of the horizontal pusher test using quasi static load rates is presented. It is equipped with a displacement sensor in addition to the traditional load cell. By instrumenting the measurement apparatus with a displacement sensor, new insights into dynamic processes at the ice-specimen interface have been revealed, which are discussed in this paper.
2. Materials and methods
2.1. Materials
Samples of the alloy EN AW-1050A with an aluminium content of 99.5% and further alloying elements of mainly Si and Fe were used. The samples with a size of 25 mm per 35 mm and a thickness of 2 mm were used. The Al samples were either (i) step-wise polished until the finishing step which was undertaken using a 1 μm polishing solution, (ii) ground with 1200 SiC abrasive paper or (iii) etched in NaOH for 10 min and pickled afterwards for 1 min in HNO3. The resulting surface roughnesses as well as the static contact angles of the polished, etched or ground Al specimens are listed in table 1. All prepared Al samples were immediately cleaned for 10 min in de-ionised water in an ultrasonic bath and dried under a N2 stream before being stored for at least 14 days in an desiccator before any ice adhesion measurement was conducted. Prior to the ice adhesion experiments the samples were carefully cleaned with a lint-free tissue soaked in alcoholic solution.
Table 1. Roughnesses Ra and Rq , mean spacing of profile irregularities RSm and static contact angle θs of the differently prepared Al samples.
| Alpolished | Aletched | Alground | |
|---|---|---|---|
| Ra [nm] | 15.8 | 32.3 | 1077.5 |
| Rq [nm] | 12.3 | 52.1 | 1332.0 |
| RSm [μm] | 14.07 | 26.68 | 10.51 |
| θs [°] | 87.2 | 84.0 | 75.5 |
2.2. Methods
2.2.1. Roughness
The roughness characteristics of the differently prepared Al samples were measured with the help of a four-quadrants backscattered electron (BSE) detector (point electronic GmbH, Halle/Germany), attached to a SEM DSM950 scanning electron microscope from Zeiss. The samples were evaluated with an acceleration voltage of 15 kV. The segmentation of the BSE-detector allows to detect the 3D topography of the analysed samples in real time. Therefore, the signals detected by the single quadrants are simultaneously handled and simultaneously amplified by a calibrated electronics assembly [21]. The backscattered signals are considered as intensity, depending from surface inclination and detector direction per Lambert Law. These intensities are converted to the normal vector per each surface element. The measurements were evaluated using the MeX-Software from Alicona Imaging GmbH. The roughness was measured twice over a distance of 120 μm and the arithmetic mean values are listed in table 1.
2.2.2. Static contact angle
Contact angle measurements were performed with an OCA15 EC (Dataphysics) using the SCA20 evaluation software. A 2 μl droplet of de-ionized water was placed on the differently prepared Al surfaces and the static contact angle θs was obtained by the Young-Laplace tangent method. The arithmetic mean was calculated for each surface from the left and right contact angle values of at least five independent droplets.
2.2.3. Ice adhesion
For the horizontal pusher test with quasi static load rate, used in this work, a custom made apparatus was used that is shown in figure 1. In this device ten specimens are positioned simultaneously on a turning platform and undergo a similar cooling procedure, thereby reducing deviations during the cooling process. The specimen are fixed on sample holders with the dimension of 25 mm times 35 mm. In preparation, all specimen were cleaned with a lint-free tissue soaked in an alcoholic solution of isopropanol and distilled water with a ratio of 3:7. As usual for the pusher test, the position and size of the ice puck has to be fixed on top of the specimen. Therefore, a circular mould, made from aluminium, with an inner diameter of 10 mm (contact area of 78.54 mm2) was used to position the necessary water volume. The mould is a cylindrical cavity with a cone-shaped upper part to control the contact to the tested surface. The expected expansion as water freezes to ice lifts the ice puck from the test surface. The whole apparatus is located in a climate chamber ESPEC type SH-242, which is used to control the defined temperatures in the sample, the ice mould and the necessary technical equipment. The used measurement procedure is as follows: at first, the empty moulds are fixed with a positioner spring pin at the ten positions ensuring their correct location along the longitudinal oriented centre of the specimen. To achieve equal temperatures in all components despite of their different heat capacities, the cooling procedure is carried out in four stages. Initially, the device is cooled down to 0 °C with a cooling rate of 1 Kmin−1. When 0 °C is reached, the ten moulds are each filled with 350 ml of an aqueous solution (here only distilled water is used) through a small opening in the upper lateral part of the mould and the whole chamber is kept for at least 1 h at 0 °C. Afterwards the cooling procedure is continued with a cooling rate of 0.1 Kmin−1 until the intended measurement temperature is reached. The positioner springs are then taken off by hand and the chamber is kept at the desired temperature for at least two ours before the start of the ice adhesion experiment. Following this procedure, all components are believed to be tempered equally at the targeted measurement temperature and relaxation processes in the lattice structure of ice and in the interface are facilitated [22]. During this process the so called 'static' or 'bulk water' ice [20] is formed. During the whole process, the humidity in the chamber is set to a minimal value. In this way, a moisture film all over the surfaces is avoided, which could spread in the apparatus and in front of the ice pucks on the test areas and could distort the measurements. The lowest possible measurement temperature that can be reached with the apparatus is −40 °C.
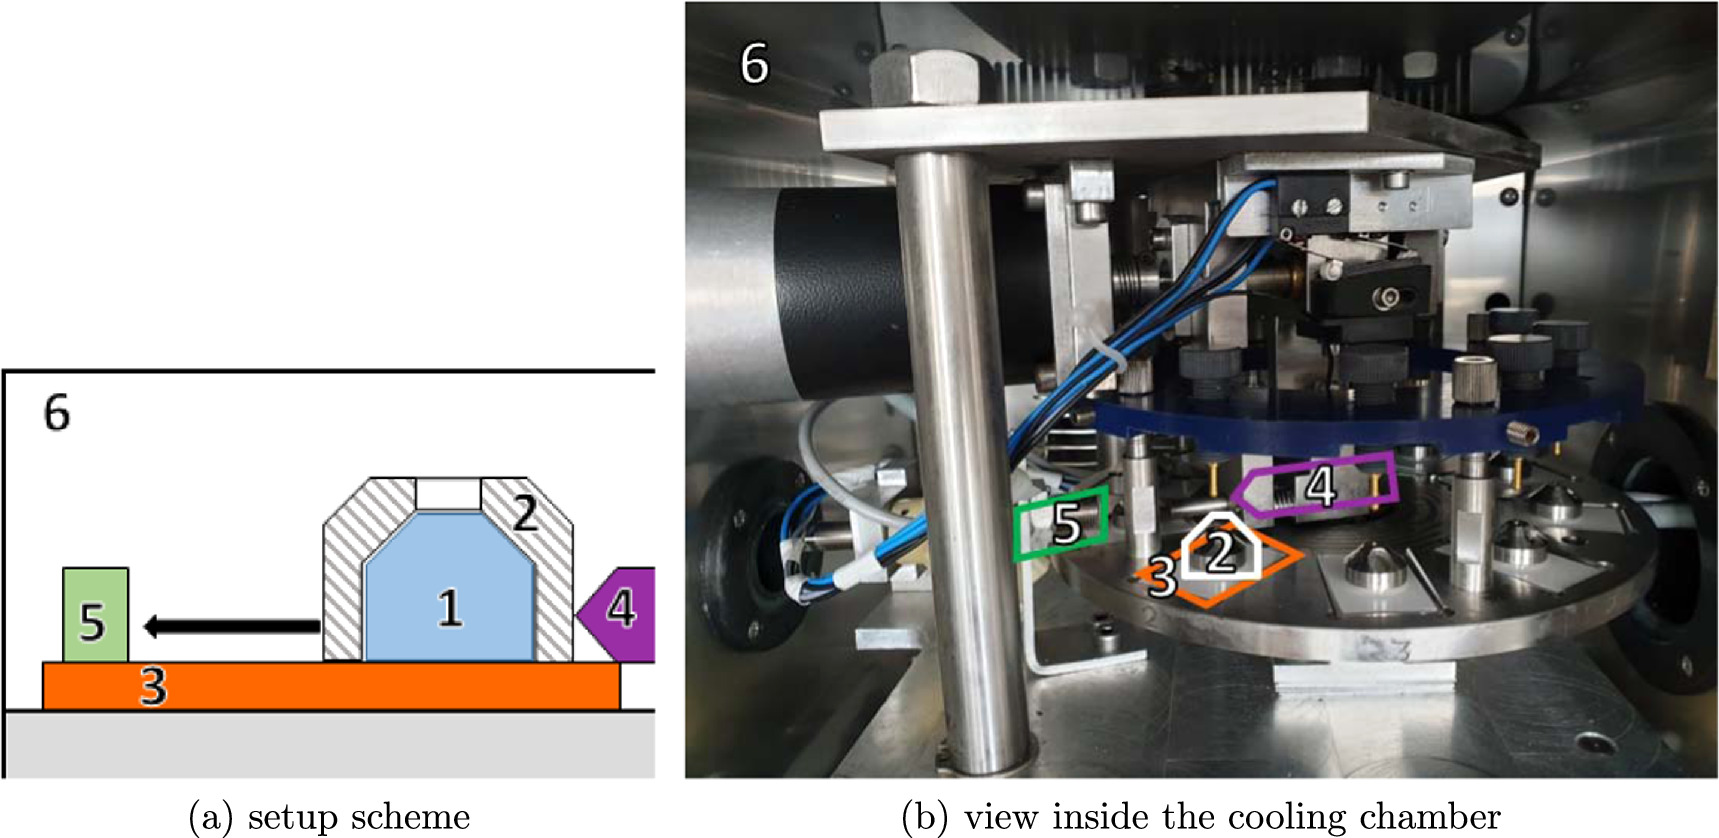
Figure 1. Measurement setup for the horizontal pusher test: 1–ice, 2–mould, 3- Al specimen, 4–pusher/load cell, 5–displacement sensor, 6–ESPEC cooling chamber.
Download figure:
Standard image High-resolution imageAfter the cooling process the ice pucks are sheared off by applying a defined quasi static load, where the load line is realised about 5 mm in parallel to the specimens surface. In this process the pusher shifts towards the mould side, so that an increasing force is applied laterally to the ice puck. If not stated otherwise, the pusher moves with a velocity of 3 × 10⁻⁴ ms−1 but load rates 1 × 10⁻⁵ ms−1 and 1 × 10⁻³ ms−1 can be realised with this custom made setup. The shear force required for shearing off the ice puck as well as the associated displacement signal are recorded via a load cell and a displacement transducer. When the pusher reaches the mould, a force builds up without movement of the mould at first. At some point the ice adhesion strength of the sample is reached, after which usually the maximum in the shear force as well as a sudden change in the displacement signal occurs. This maximum force in Newton will then be divided by the contact area of the ice puck with 78.54 mm2 to calculate the ice adhesion strength as a shear stress in Pascal. Afterwards the next specimen is pivoted in front of the pusher and the process is repeated until all prepared and positioned samples are tested without the need to open the cooling chamber, thereby avoiding interruption of the cooling process.
After performing all tests, the cooling process is stopped and the chamber is opened. Subsequently, without delay, the appearance of the ice within the aluminium moulds is controlled. This procedure allows a check to be made of the type of fracture (adhesive versus cohesive) and the opacity of the ice (figure 5). The measure of maximum shear force is defined as not valid when substantial crack formation occurred inside the ice puck and/or ice fragments remain on the specimen, as it is seen in (figure 5(c)). A minimum number of ten, but mostly twenty tests are carried out for each test temperature, where the test temperatures are varied in the range from −5 °C to −25 °C. The results are shown as individual values in figure 3 together with the arithmetic mean, the median and the relative standard deviation for each test temperature.
3. Results
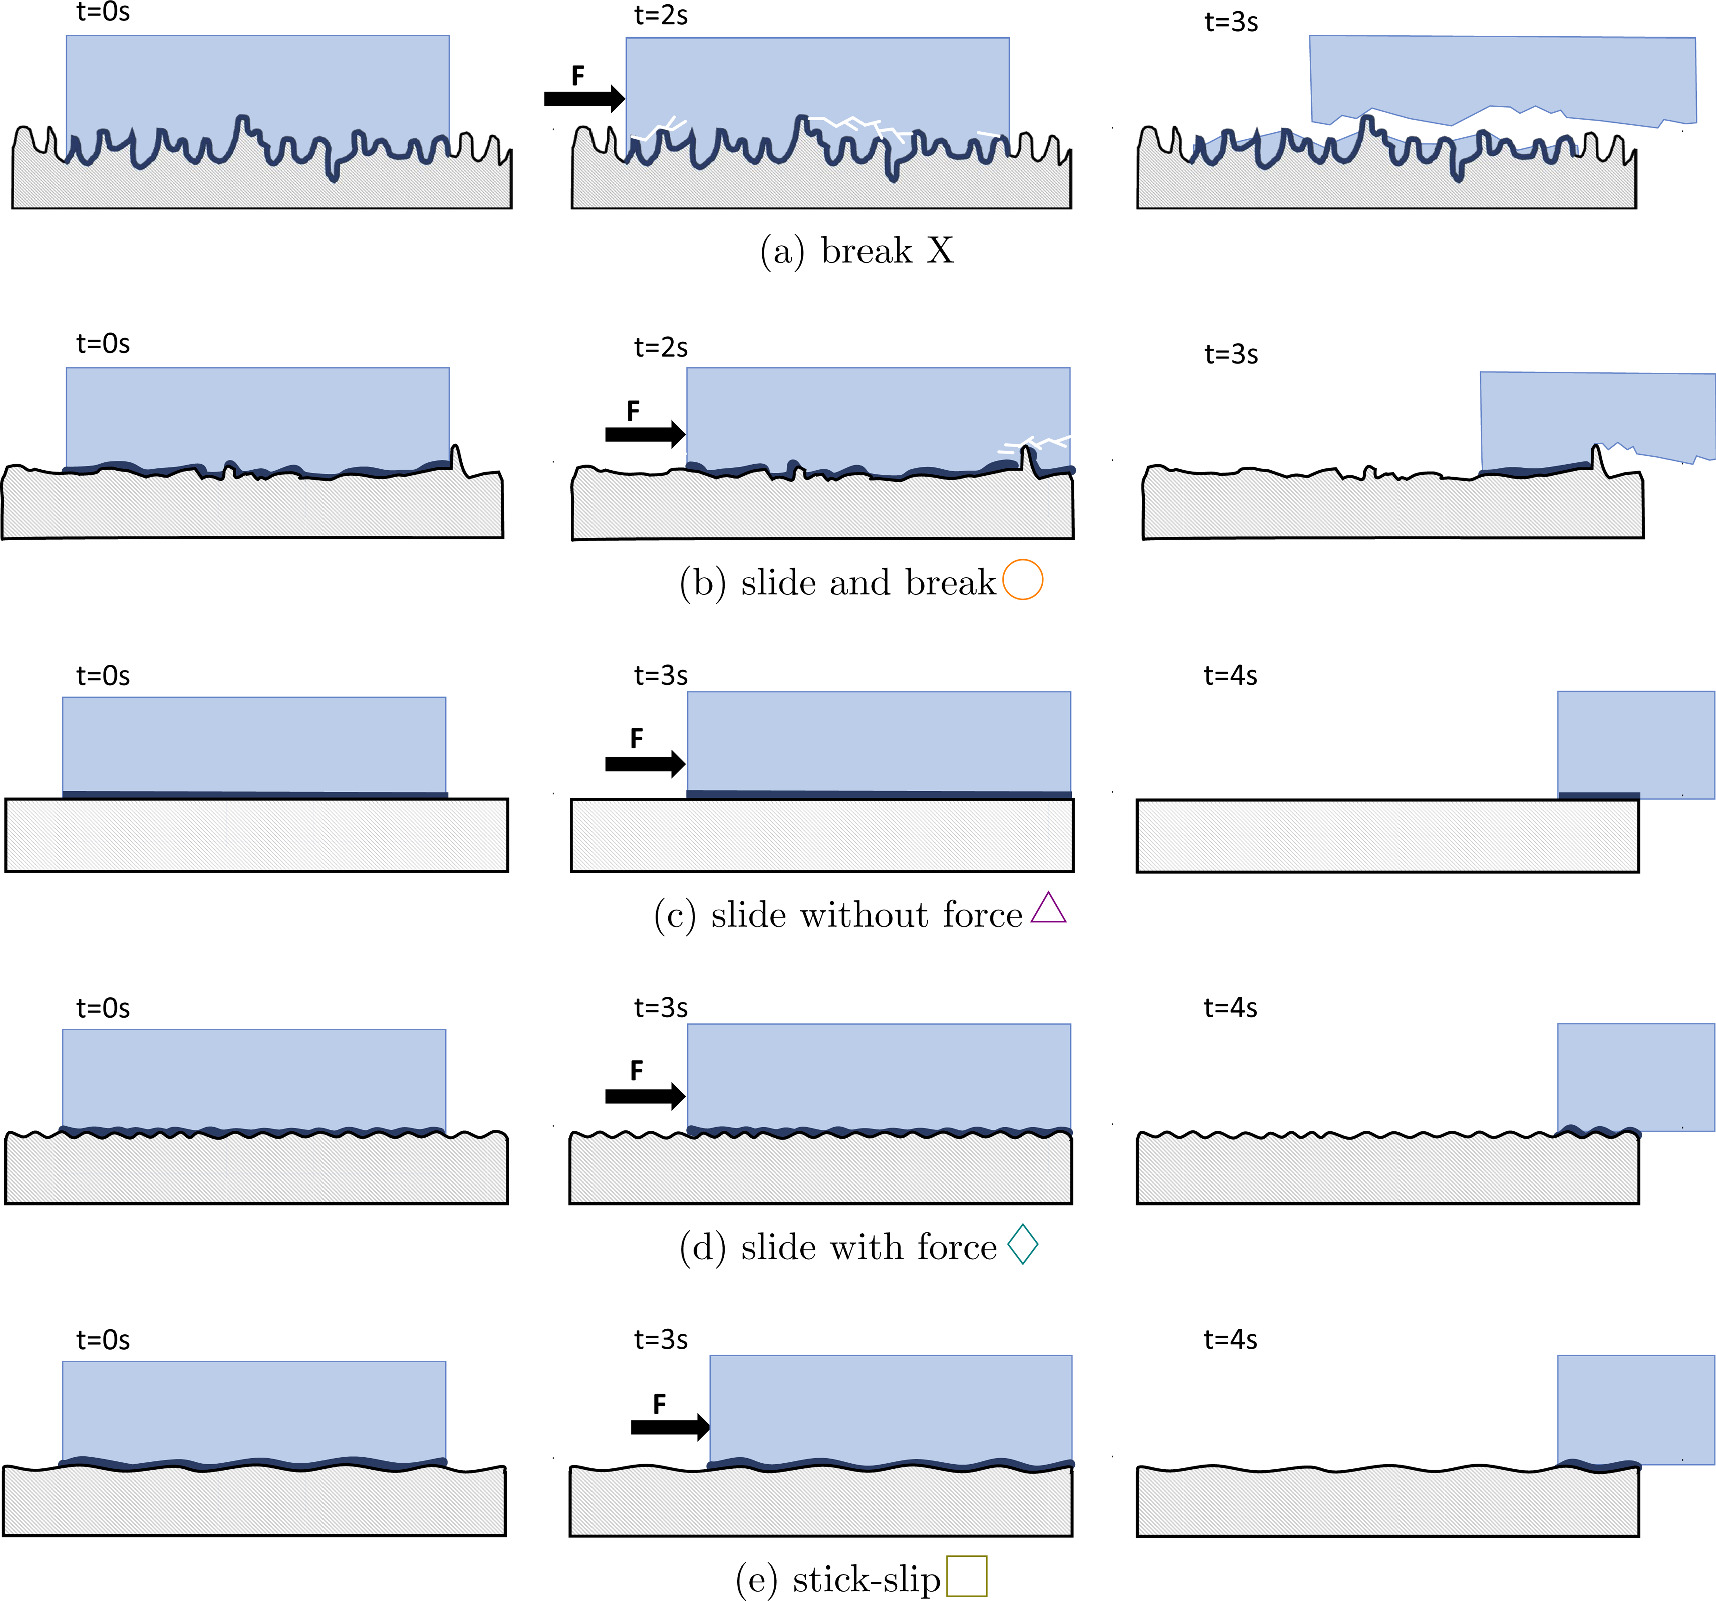
In the following consideration is made of the nanoscopic processes at the interface of ice-coating laminates and the parameters influencing the adhesion behaviour of the so-called static ice. During the detachment of the ice pucks the force as well as the displacement signals are tracked simultaneously, enabling a deeper insight to the dynamic processes at the interface during the detachment of the adhered ice. In figure 2 five different detachment modes are shown of the ice pucks that were usually observed in our experiments. The course of the force and displacement in figure 2(a) ( X ) is what would typically be expected of ice adhesion tests: the frozen ice puck is pushed off from the surface after a clear break. Initially the force is built up mostly without any changes in the displacement signal and in the moment of adhesion loss the force signal drops down to a near zero value and the displacement signal suddenly increases. This detachment mode is hereafter called 'break' and was observed for the majority of the specimen (>80%). Surprisingly, different characteristics in the force-detachment curves were found for some of the specimen. Consequently, four further characteristic detachment modes were defined. In some cases the applied force leads to an ice puck detachment with an initial slide (figure 2(b)). This mode is indicated with 'slide and break' ( ), meaning that there is already a slight increase in the displacement signal while the the force is built up even before the adhesion loss occurs. In figure 2(c) a characteristic measurement record is shown where the ice puck is sliding over the surface with almost no force required at all and therefore it is named 'slide without force', marked with (
 ). In figure 2(d) a further modification is shown, where the ice puck is sliding similarly, but requires a much higher applied force, called 'sliding with force' (
 ). For some specimen a manifold sticking with consistently sliding behaviour is observed (figure 2(e)), here indicated with 'stick-slip' (
 ).
).

Figure 2. The five different detachment modes of the ice found during the ice adhesion measurements.
Download figure:
Standard image High-resolution imageThe dependence of the ice adhesion of the five detachment modes defined here on measurement temperature and on the preparation of the Al surface is shown in figure 3, thereby showing the temperature-dependent ice adhesion results measured with the novel pusher apparatus presented in this paper. In general, the ice adhesion strength increases significantly with decreasing temperature. Similarly, the relative standard deviation of the measurement values increases with decreasing temperature. The clear adhesion break ( X ) is the dominant process for most specimen, for ground Al solely this detachment mode was observed (figure 3(c)). Sliding events ( ) are observed mostly on polished Al samples and at higher test temperatures. The 'slide without force' (
 ) was observed only once for the etched Al sample at −5 °C in context with the here presented measurements for aluminium. For lower test temperatures of −25 °C, no sliding events occurred. To evaluate the effect of the surface roughness, specimens of polished, etched and ground aluminium surfaces were prepared and tested. SEM images of these differently prepared Al surfaces are shown in figure 4. It was revealed from the roughness measurement (table 1) that there is a slight increase of surface roughness due to pitting of the surface after the etching procedure (figure 4(b)) compared to the polished Al samples. Sliding events (
 ) occur on the etched surfaces to a lesser extend compared to the polished samples. However, the 'stick-slip' behaviour (
 ) is observed exclusively for the etched Al specimen at lower measurement temperatures. Grinding the Al surface with 1200 SiC paper increases the roughness by several orders of magnitude (figures 4(c) and table 1). On ground aluminium, no sliding events occur at all and the only detachment mode observed for these samples is a clear adhesive 'break' (figure 2(c)). While the ice adhesion of polished and etched aluminium surfaces enhances only by a small amount with decreasing temperature, the ice adhesion almost triples when decreasing the test temperature from −5 °C to −15 °C for the ground Al samples (figure 2(c)).

Figure 3. Ice adhesion on differently prepared Al samples and mode of detachment. The percentages on top of each column indicate the relative standard deviation of the mean.
Download figure:
Standard image High-resolution image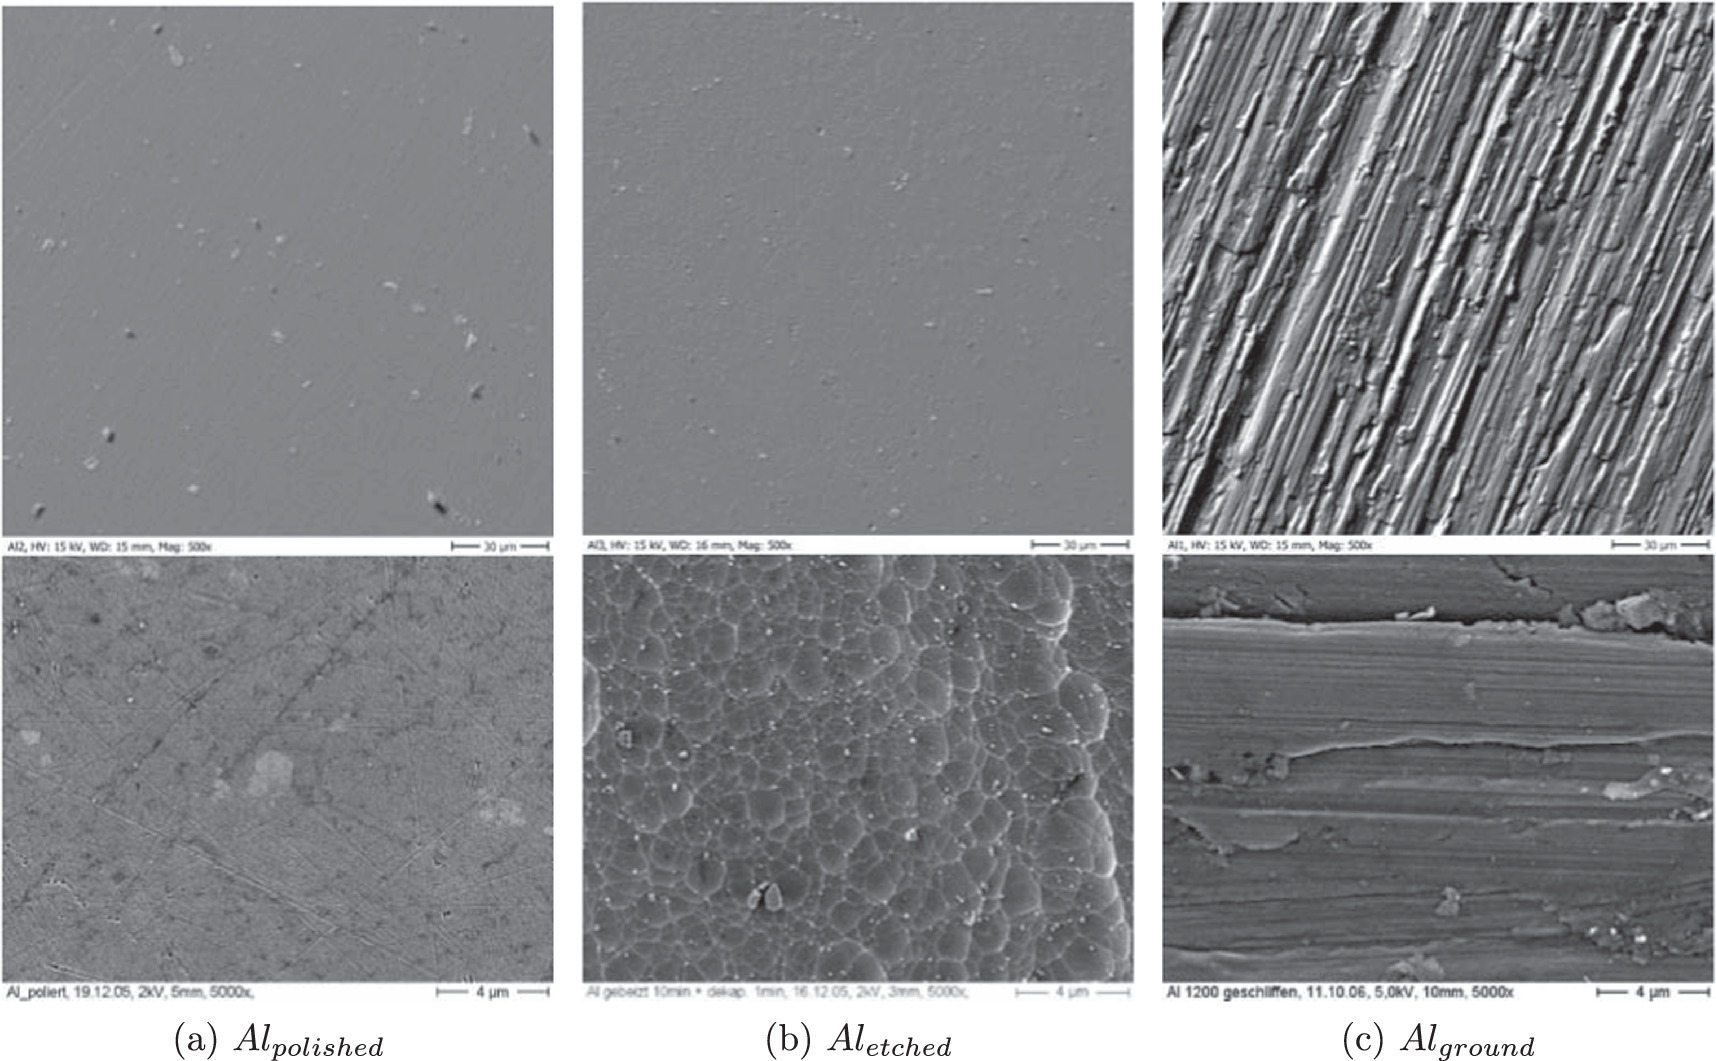
Figure 4. Scanning electron microscopy (SEM) images of the differently prepared Al specimen.
Download figure:
Standard image High-resolution image4. Discussion
In this study a novel variation of the horizontal pusher test for ice adhesion measurements equipped with a load cell as well as a displacement sensor was introduced. The horizontal pusher test was applied with the intention to obtain information about bonding forces between an adhered ice puck and the evaluated surfaces. From the results it was possible to define five different modes of detachment that allow new insights into the interface of adhered ice and tested surfaces or coatings (figure 2). The detachment mode defined as 'break' (figure 2(a)) was observed for the majority of the specimen (>80%). This detachment mode can be observed for clear adhesive breaks and for cohesive breaks (figure 2). We assume that the increase in ice adhesion stress for those specimen is related to the decrease in ice grain size, that happens for lower freezing temperature and the higher heterogeneous nucleation rates and may be accompanied with a higher fracture toughness of ice [23, 24]. Moreover, a smaller grain size would increases the opacity of the frozen ice (figure 5), as it is discussed later on. In contrast, we assume that the detachment modes that show sliding of the ice puck are connected to the existence of the amorphous quasi static liquid layer (QLL) between the ice puck and the specimen, which is suggested to appear as a temperature dependent boundary effect of ice [25]. Literature values for the thickness of this QLL range from 0.1 to 100 nm and were determined using different experimental techniques such as atomic force microscopy (AFM), ellipsometry, spectroscopy methods and photoelectron spectroscopy. In [26] the thickness of QLLs was specified by atomic force microscopy in the range of less than 1 nm for a measurement temperature range between −2 °C and −7 °C. The authors suggest that there was previously an over estimation of QLL thickness due to possible interference of the QLL, especially by means of jump-in distances, tip sizes and surface hydrophilicity in case of AFM-techniques. However, there is a consensus in the literature that the thickness of the QLL shrinks with lower temperatures. In order to estimate the QLL thickness in relation to the surface roughness of the Al specimen (table 1) we used an estimation published by Guerin et al [27] when they were developing an equation to calculated the adhesion shear stress τad
for the centrifuge adhesion test on the basis of the assumed QLL. The thickness H of the QLL is there described by  with a = 32 nm and b = 21 nm as a function of the fusion temperature of ice Tf
and the ambient temperature Ta
. For distilled water the fusion temperature is Tf
= 0 °C. Therefore the QLL decreases from H(T = − 5 °C) = 17.3 nm over H(T = − 15 °C) = 7.3 nm to H(T = − 25 °C) = 2.6 nm. The measured adhesion forces should contain information about the viscosity of this quasi liquid layer as well as roughness effects as a combination of electrostatical bonds and secondary valency bonds and mechanical interaction [28]. The viscosity of water for instance increases from 2.5 mPas for −5 °C to 17 mPas for −25 °C, causing increased adhesion forces [29].
with a = 32 nm and b = 21 nm as a function of the fusion temperature of ice Tf
and the ambient temperature Ta
. For distilled water the fusion temperature is Tf
= 0 °C. Therefore the QLL decreases from H(T = − 5 °C) = 17.3 nm over H(T = − 15 °C) = 7.3 nm to H(T = − 25 °C) = 2.6 nm. The measured adhesion forces should contain information about the viscosity of this quasi liquid layer as well as roughness effects as a combination of electrostatical bonds and secondary valency bonds and mechanical interaction [28]. The viscosity of water for instance increases from 2.5 mPas for −5 °C to 17 mPas for −25 °C, causing increased adhesion forces [29].
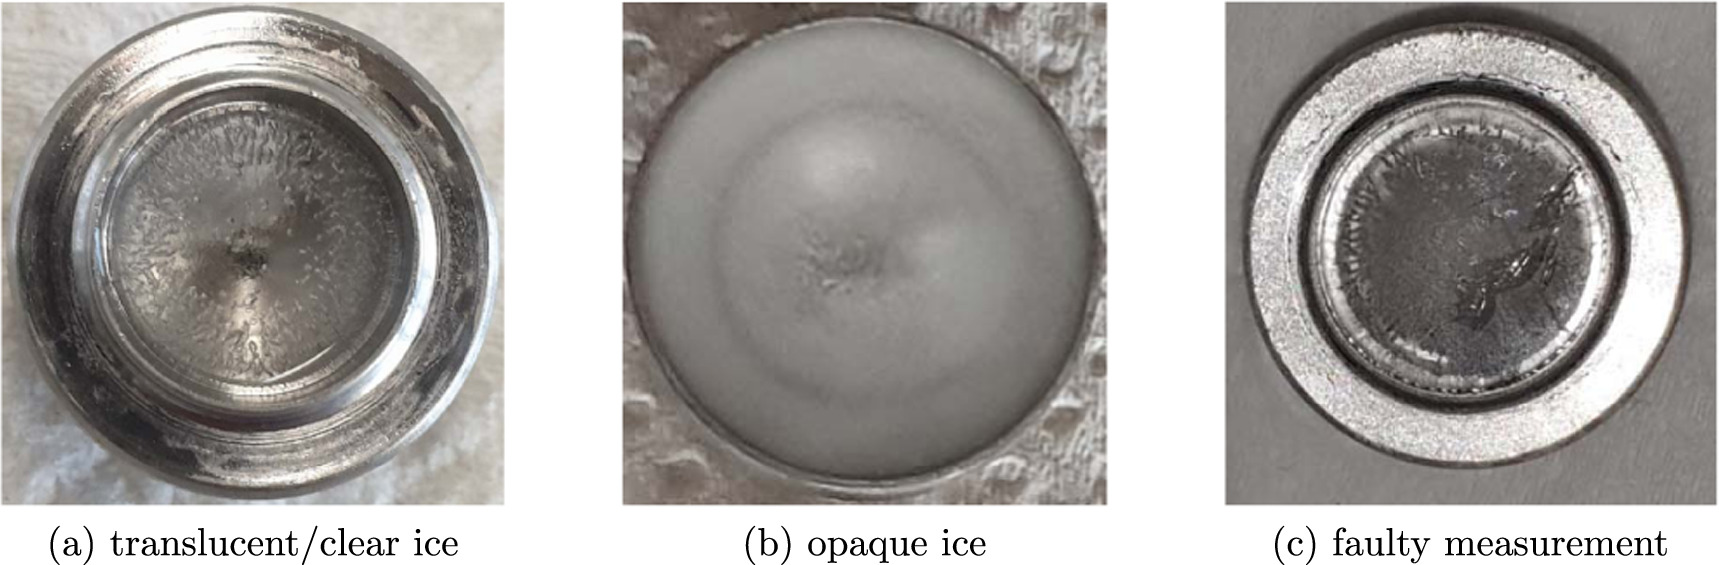
Figure 5. Appearance of the ice pucks turned upside down after the adhesion experiments: translucent ice after testing at −5 °C (a); opaque ice after testing at −15 °C (b) and example for a faulty measurement that was excluded from the diagram due to macroscopic pieces of ice broken out of the ice puck still adherent to the specimen (c).
Download figure:
Standard image High-resolution imageIn particular the 'slide and break'-events for the case of polished aluminium arise mainly for higher test temperatures, decline with lower test temperatures and disappear completely for T = −25 °C. Simultaneously, the shear stress increases if the thickness of the QLL decreases. If the roughness of the evaluated Al surfaces exceeds the typical thickness of the QLL (figure 6(b)), cohesive breaks rather than sliding events occur at the interface. In this context, polished aluminium is an appropriate substrate to depict this correlation due to its low roughness and the associated low risk for cohesive events at the interface.
Figure 6. Scheme of the QLL (deep blue) at the interface between the solid surface (grey) and the frozen ice for the five different detachment modes and the anticipated dynamic processes in the interface. The time stated in the figures correspond to the stress-displacement-time graphs of figure 2.
Download figure:
Standard image High-resolution image
The mean shear stress, measured on polished aluminium for a temperature of −10 °C in the horizontal pusher test used in this work is 1000 kPa with a relative standard deviation of 49.6%. These results exceed results of comparable measurements, such as those published by [30] with 500 kPa ± 36%. However, both of these values are well above ice adhesion values sustained with centrifugal tests. By using centrifugal methods, shear stresses of 326 kPa ± 9% by [30] and 500 kPa ± 7% by [31] were reported. This difference corresponds again to an influence of the viscosity, as viscous shares of measured shear stresses increase with decreasing load rates during the detachment process [20, 27].
A special dependency was observed when testing etched aluminium surfaces, here introduced as 'stick-slip'. This behaviour is dependent on the special surface profile of the etched Al specimen (figure 4(b)) and the slip distance is believed to be equal to the mean profile wavelength.
In all of the measurements represented here, a high scattering of the measured adhesion stress is observed. Generally, the displayed high relative standard deviation is in accordance with other measurements [26, 30] and can only slightly be decreased by increasing the contact area between. However, in figure 3 all the measurement values are pictured to illustrate the considerations presented in the following. In the observations made for this work, the scattering increases for decreasing test temperatures and there seems to be almost the same behaviour as a function of the temperature for the differently prepared Al surfaces. This contradicts the results of [32], where the scatter of the results diminishes with lower temperatures in tests with a liquid containing charged ions. In contrast, for this work distilled water was used as the test liquid. At a first glance, the results of this work do not seem to form a clear correlation with the freezing temperature, else a lower variability in the shear stress would be found for lower freezing temperatures due to the diminishing influence of the QLL. The reason may be found in the behaviour of the frozen ice puck. For the highest of used test temperatures −5 °C, gliding, relaxation and deformation of the ice puck predominates due to a adequate QLL, whereas for lower temperatures the risk of micro-crackling and bubble formation dominates the process. The ice pucks still appear translucent up to test temperatures above −10 °C, below they changed to opaque pucks. Starting the freezing routine, the air is still resolved in the test liquid, a high amount particularly in case of temperatures of 0 °C and it is incorporated into the ice lattice during the freezing process. As the nucleation process starts from the supercooled interface, a mayor part of incorporated air still remains. However, their solubility shrinks with lower temperatures and the air aggregates become to large to be fitted into the lattice. They are released from the lattice upon further cooling and build rod-shaped segregates on the grain boundaries [33], increasing the opaqueness and possibly influencing the interface in a uncontrolled manner. To counter this process, a flashing routine with nitrogen has been proposed [30], leading to a standard deviation of the adhesion stress of (28%–32%) for T = − 18 °C.
5. Conclusion
In this study, a horizontal shear test to measure the ice adhesion behaviour of surfaces and coatings was equipped with a load cell and displacement sensor and therefore could be used to characterise the shear stress information. The simultaneously detected signals facilitates the evaluation of the process of ice adhesion more in detail and allows a better understanding of the nanoscopic processes at the interface to be obtained. We found that the ice detachment is a dynamic process and the itemisation of the shear stress into the associated adhesive and ductile components can be used to support the evaluation of the interface and to gain more information than just the adhesion force. As a consequence, the method facilitates an evaluation of the optimal nucleation conditions at the interface by means of their tendency to cause multiple sticking events versus their tendency to slide. In addition, the findings make a contribution to a determination of an appropriate test temperature. The results support the use of a temperature up to -10 °C with regard to the observed temperature dependence and structure-destructing processes in the adhered ice puck. We suggest that there are additional parameters affecting the ice adhesion strength that have to be determined in detail in further measurements with a higher variety of different materials in order to validate the different detachment modes found during this work.
Acknowledgments
This work was supported by Germany's Federal Ministry for Education and Research (BMBF) under the grant number 03SF0475A. The authors thank G. Wiemann, P. Völker and M. Kühnöl for the construction and fabrication of the ice adhesion setup, K. Galle, S. Mühle, S. Heinze, J. Tondera, A. Mensch and N. Boucher for the ice adhesion and freezing experiments and R. A. Boucher for the proof reading.
Data availability statement
The data cannot be made publicly available upon publication because they are not available in a format that is sufficiently accessible or reusable by other researchers. The data that support the findings of this study are available upon reasonable request from the authors.