

Abstract
Water pollution affects all living habitats, since it is the most basic element that sustains all life forms and, as an exceptional solvent, it readily makes any compound available for living cells, either nutrients or noxious substances. Elimination of molecular contaminants from water quality is one of the most challenging technical problems that conventional treatments like flocculation and filtration fail short to defeat. Particulate photocatalysts, used to degrade contaminants, have the main drawback of their recovery from the water matrices. The inclusion of photocatalytic nanoparticles (NPs) into a large supporting framework, is presented as an innovative approach aiming to ensure a facile separation from water. To this end, three-dimensional (3D) aerogels with photocatalytic properties were prepared by a simple and scalable method based on the reduction—induced self-assembly of graphene oxide (GO) in the presence of BiOI nanoparticles. With the help of ascorbic acid, as a green reducing agent, partial reduction of GO into reduced graphene oxide (RGO) and self-assembly of both kinds of nanostructures into a porous monolith was achieved. BiOI doped RGO aerogels were further stabilized and morphologically controlled using poly (ethylene glycol) as stabilizer. The photocatalytic performance of these aerogels was evaluated by following the discoloration of methylene blue (MB) solution, under visible light irradiation, showing that structure and dispersion degree of NPs to be fundamental variables. Hence, this methodology is proposed to produce hybrid aerogels with controlled morphology and photocatalytic performance that has the potential to be used in water cleaning procedures.
Export citation and abstract BibTeX RIS

Original content from this work may be used under the terms of the Creative Commons Attribution 4.0 licence. Any further distribution of this work must maintain attribution to the author(s) and the title of the work, journal citation and DOI.
Introduction
Chemicals are pervasive in modern society and have a contradictory contribution to our wellbeing. They had improved health and quality of life deploying a huge number of advantageous technical developments, but as a result of human activities, chemicals of all types (fluorinated compounds, cytotoxic pharmaceuticals, polycyclic aromatic hydrocarbons (PAH), heavy metal ions, microplastics, etc) and sizes (debris from nano- to macroscopic range), have been disposed to the environment. From all, water pollution has the most deleterious impact, affecting all living habitats, since it is the most basic element that sustains all life forms and, as an exceptional solvent, it readily makes any compound available for living cells, either nutrients or noxious substances. Thus, management of freshwater is one of the most challenging technical problems at global scale, since efficient solutions for water treatment technologies need to be cost-effective, scalable, and successful in eliminating the small sized compounds that conventional treatments like flocculation and filtration fail short to defeat. Integrating nanomaterials into supporting materials are giving rise to complementary techniques in water cleaning applications, like enhanced adsorption of contaminants [1–4] or photocatalytic degradation stimulated by nanoparticulate systems [5, 6]. However, although photocatalytic procedures have the advantage of using natural light to degrade compounds, at no energy expenses, the recovery of the poured catalytic nanoparticulate agents, from the treated water matrices, poses an additional technical problem. With the integration of nanocatalysts into heavyweight 3D printed frameworks, the problem of separating the catalysts from the reaction products [7, 8] can be solved for small volume reactors. However, for large water reservoirs under open air conditions, other approaches facilitating their agitation within large volumes of water and their subsequent recovery are needed.
In this regard, over the last decade, graphene has attracted much attention due to its large surface area, high electrical conductivity and charge mobility, and its excellent mechanical properties and versatility to be integrated into different matrices [9–11]. Because of these excellent properties, graphene is a potential candidate for various applications in fields such as energy conversion and storage, sensors, electronics and catalysis [12, 13]. Graphene oxide (GO) is a lower cost derivative of graphene, highly dispersible in water, ethanol and other organic solvents due to the presence of polar functional groups on its surface (carbonyl, epoxy, hydroxyl) [14]. Moreover, GO can be reduced by different methods for recovering some properties of graphene, giving place to a compound known as reduced graphene oxide (RGO) [14, 15].
Under certain conditions, GO and /or RGO can self-assemble, forming a porous three-dimensional structure (3D) [14–16]. This usually occurs during reduction of GO due to the decrease in polarity and concomitant restoration of van der Waals and π-π interaction between graphene platelets. In addition to the mentioned outstanding properties of RGO, 3D RGO structures are more stable, mechanically robust and much easier to manipulate than GO/RGO 2D nanosheets, which make them attractive in practical applications. They can also be used as hosts of functional nanoparticles (NPs), allowing their application in liquid environments as well as preventing their release and enabling separation after treatment [17–20]. Moreover, their high surface area and interconnected pore structure favour the diffusion of molecules. All of these features make RGO aerogels as ideal candidates for water purification and other practical applications [21].
Moreover, in recent years, bismuth oxhalides (BiOX, X = Cl, I or Br ) NPs have gained much attention as alternative photocatalysts to TiO2, owing to their photocatalytic performance under visible light originated from its unique layered structure and its narrow band gap [22–26]. Among these compounds, bismuth oxyiodide (BiOI) has the smallest band gap (1.8 eV) and the simplest electronic structure. However, the low quantum yield, weak photo-oxidation ability and easy recombination of electron-hole pair of BiOI still hinder its practical application as photocatalyst [27].
The use of RGO aerogels as support of powder photocatalytic NPs could at least partially solve this issue by enabling the homogeneous distribution of NPs into the 3D framework and reducing the possible aggregation that the powdered photocatalyst uses to suffer in water solution [28, 29]. Also, the inclusion of NPs into 3D RGO structures has the advantage of enabling their easy manipulation and recyclability, preventing the release of NPs into the liquid medium to be treated. The large accessible surface area of aerogels provides more active sites for reaction and could improve the adsorption capacity of the aerogel and the photocatalytic activity of BiOI NPs [17, 30, 31].
Up to now, several methods for the preparation of 3D structures starting from GO have been reported [32–37]. Among them, self-assembly induced by chemical or hydrothermal reactions are the most widely used [21, 38–40]. In the chemical method, the reduction of GO is usually performed at moderate temperatures (80 °C–100 °C) by using different reducing agents, like hydrazine, sodium borohydride, ascorbic acid, among others. The advantages of the chemical in situ self-assembly versus other techniques rely on the possibility of large scale production while working with moderate chemical conditions [21, 41, 42]. During the reduction, the oxygenated functional groups are eliminated from the surface of the GO, while the van der Waals interplanar forces increased. This imbalance between the electrostatic repulsion and van der Waals forces causes the flexible RGO sheets to overlap and partially interlock and stacking, forming an interconnected porous three-dimensional network [21, 42]. The structure and final properties of the aerogels (porosity, pore volume, pore size, mechanical properties, density, adsorption ability) depend on the reaction parameters: temperature, time, initial concentration of GO, size of the GO sheets, amount of the reducing agent, initial pH [43–47]. Ascorbic acid has already been used to produce hybrid aerogels by self—assembly of RGO sheets, containing different types of oxide NPs (MoO3 [48], SnO2 [49], TiO2 [50–53], CeO2 [54]). However, to the best of our knowledge, this route has still not been used for the synthesis of 3D BiOI/RGO aerogels by self-assembly. A few BiOX (X = Cl or Br)/RGO aerogels have been synthesized using the hydrothermal method where the NPs were produced in-situ [55–59]. He et al [60]. also developed an in-situ method deposition of the BiOI NPs onto a graphene foam surface by immersion it in the precursor solution. The graphene foam was prepared using a polyurethane foam as template. In these previous works, it was demonstrated that GO and RGO could improve the UV-visible photocatalytic performance and photocurrent generation of BiOI NPs by enhancing adsorption properties, increasing light absorption and making charge transport more effective.
Incorporation of polymers into the RGO aerogel structure can also confer new properties to the final material due to synergic effects [61, 62], improving the mechanical properties, and providing more functional groups to regulate amphiphilicity [61]. During reduction and self-assembly of GO, the polymer can act as mediator/spacer of GO/RGO sheets preventing their agglomeration and re-stacking due to the introduction of hydrogen bond interactions [63]. Some polymers, as for example, polyvinylalcohol, polydopamine, chitosan, polyethylene glycol (PEG) among others, have already been used to modify GO aerogels [62–64]. Besides improving the mechanical properties and the morphology of monoliths, the incorporation of PEG could also improve the dispersion of the NPs within the aerogel.
In this work, three-dimensional porous BiOI/reduced graphene oxide (RGO) aerogels were prepared by combined in-situ reduction and self-assembly of graphene oxide (GO) with ascorbic acid in the presence of pre-formed BiOI NPs. 3D aerogels with different compositions and structural properties, were developed aiming to test their effect on the photocatalytic performance of BiOI NPs. Pore size and dispersion of NPs into the aerogel were controlled as a function of the synthesis variables to incorporate homogeneously the NPs within the aerogel. Finally, photocatalytic performance of selected aerogel formulations were tested using methylene blue (MB) as a model pollutant.
Experimental: materials and methods
Materials
GO dispersion (3 mg ml−1) was purchased from Graphenea (San Sebastián, Spain). L-Ascorbic acid (AA, reagent grade), polyethylene glycol (PEG, Mw = 8000), absolute ethanol were acquired from Aldrich. Potassium iodide (KI) was purchase from Acros organics, bismuth(III) nitrate pentahydrate (Bi(NO3)3.5H2O) from Fluka and methylene blue (MB) from Thermo Fisher Scientific. All the reagents were used as received without further purification.
Synthesis of BiOI NPs
BiOI nanoparticles were prepared via an hydrothermal method using KI and Bi(NO3)3.5H2O as precursors [65]. 1 mmol Bi(NO3)3.5H2O (0.4851 g) was added into 17 ml of ethanol and dissolved by stirring for 30 min at room temperature. Simultaneously, 1 mmol of KI (0.166 g) was added into 17 ml of water and dissolved by stirring for 10 min at room temperature. Afterwards, KI solution was added dropwise (1.5 ml min−1) into the bismuth precursor solution and magnetically stirred for 20 min at room temperature. The mixture was placed in a Teflon lined stainless steel autoclave and allowed to react at 150 °C for 24 h. The nanoparticles were collected by centrifugation at 7500 rpm, washed with water and absolute ethanol for five times and finally dried at 60 °C overnight in a conventional oven.
Synthesis of 3D BiOI/RGO aerogels/hydrogels
3D RGO/BiOI aerogels were prepared by in-situ reduction and self-assembly of GO with ascorbic acid in the presence of BiOI NPs following different protocols. In the first approach, a certain amount of powdered BiOI NPs was added to 2 ml of GO water dispersion (3 mg ml−1) and dispersed with the help of an ultrasonic probe. Then, 20 mg of AA was added and the sample was mixed again with the help of an ultrasound bath. Finally, after closing the vial, it was submitted to 90 °C for 1 h, in an oven. RGO/BiOI samples with different NPs contents were prepared. Aerogels were named as RGO/BiOI_0.4, RGO/BiOI_0.8 and RGO/BiOI_1.6, where 0.4, 0.8 and 1.6 are the mass ratios of BiOI NPs with respect to GO, respectively.
In a second approach, NPs were dispersed in water prior to mixing with the GO dispersion. 1 or 2 ml of Milli-Q water was used to disperse 2.5 mg of BiOI NPs. Then, the water dispersion of NPs was mixed with 2 ml of GO dispersion (3 mg ml−1) by using an ultrasound bath during 2 min. Final GO dispersion was diluted to 2 and 1.5 mg ml−1, respectively. Then, 20 mg of AA was incorporated and, after mixing, the covered vial was placed in an oven at 90 °C for 1 h.
In a third approach, 20 mg of PEG was added to 2 ml of GO dispersion and mixed with the help of an ultrasound bath. Then, a certain amount of powdered BiOI NPs was added and dispersed by using an ultrasound probe during 2 min. In this case, aerogels were named as RGO/BiOI_0.4/PEG, RGO/BiOI_0.8/PEG and RGO/BiOI_1.6/PEG, where the number indicates the BiOI:GO mass ratio used.
For comparison, aerogels without the addition of BiOI NPs were prepared following the same three protocols described above. They were named as RGO (when using 3 mg ml−1 of GO dispersion), RGO_1.5 and RGO_2 (when GO concentration was diluted to 1.5 and 2 mg ml−1) and RGO/PEG when PEG was incorporated to the formulation. In table 1, the starting BiOI/GO mass ratio and percentages of each reagent used (on a dry base) for sample preparation are detailed. These compositions are not necessarily the same as the final composition of aerogels, particularly in the case of aerogels containing PEG.
Table 1. Starting BiOI/GO mass ratio and mass percentage composition of the prepared samples.
| Sample | Mass ratio BiOI/GO | wt% BiOI a | wt% GO a | wt% PEG a |
|---|---|---|---|---|
| RGO | — | — | 100 | — |
| RGO_1.5/BiOI_0.4 | 0.4 | 30 | 70 | — |
| RGO_2/BiOI_0.4 | 0.4 | 40 | 55 | — |
| RGO/PEG | — | — | 23 | 77 |
| RGO/BiOI_0.4 | 0.4 | 30 | 70 | — |
| RGO/BiOI_0.8 | 0.8 | 45 | 55 | — |
| RGO/BiOI_1.6 | 1.6 | 63 | 47 | — |
| RGO/BiOI_0.4/PEG | 0.4 | 9 | 21 | 70 |
| RGO/BiOI_0.8/PEG | 0.8 | 16 | 19 | 65 |
| RGO/BiOI_1.6/PEG | 1.6 | 28 | 17 | 55 |
Hydrogels were obtained after 1 h of reaction. Then, they were washed several times with water to eliminate impurities. It is important to consider that in the case of samples prepared with PEG, the large amount of this polymer (initially included in the formulations with the purpose of improving the dispersion of particles and morphology of monoliths) decreased after the thorough washing steps imposed. Hence, a significant amount of this reagent is dissolved and eliminated of the final material, increasing the percentage of catalytic phase respect to the initial one. Finally, aerogels were obtained using a freeze-drying technique. Hydrogels were placed in a −79 °C freezer for 24 h prior to be lyophilized for 3 days to remove the water.
The adsorption and photocatalytic properties of different samples were evaluated by following the disappearance of methylene blue (MB, 4.54 ppm) from an aqueous solution under visible-light irradiation. The visible light source was a solar simulator (LOT Quantum Design LS0106 LSE-140/160, equipped with UV filter). 3 mg of photocatalyst was added into 20 ml of MB solution. Aliquots (1–2 ml) were taken from the vessel at given time intervals, in dark and under visible light irradiation. The MB concentration was analyzed by recording variations of the maximum absorption peak of the UV-Vis absorbance spectra located at 670 nm.
Characterization
Morphological characterization
The morphology of the samples was characterized using scanning electron microscopy (SEM, ZEISS EVO LS 15 microscope) and field emission electron microscopy (FESEM, Zeiss Ultra Plus microscope). Samples were previously coated with a fine layer of Au–Pd. Energy-dispersive X-ray spectroscopy (EDX, SEM EVO) was used to analyze the spatial distribution of elements in the cross-section of selected samples.
Structural characterization
Crystalline phases of GO, BiOI and aerogels were characterized by X-ray powder diffraction, XRPD, using a Philips PW1710 diffractometer (Cu Kα radiation source, λ = 1.54186 Å) with 2θ measurements between 10°−80° and scanning steps of 0.02° with 10 s step, on powder samples.
Surface chemistry characterization
Fourier transformed infrared (FTIR) spectra of GO, BiOI and aerogels were recorded with a Varian 670-IR spectrophotometer with a PIKE Gladi ATR accessory, in the range between 450–4000 cm–1. Raman spectra of both lyophilized GO and aerogels were obtained with a Renishaw inVia Raman Spectrometer equipped with a 514 nm laser.
Optical properties
Absorption spectra of MB were recorded at room temperature with an Evolution 300 UV-Vis spectrophotometer. The MB removal rate was calculated as  where A0 is the initial absorbance of MB and A is the absorbance at different times. The diffuse reflectance absorption spectra (DRS) were recorded with a UV-Vis spectrophotometer (JASCO V-750) equipment using the ISV-922 integrating sphere.
Results and discussion
BiOI NPs were obtained by a hydrothermal method previously reported by Ren et al [65]. The as-synthesized BiOI particles are aggregates of nanosheets assembled into flower-like micro-structures, as it can be seen in SEM images presented in figure 1. This type of morphology has already been observed for BiOI prepared by other routes like, for example, the solvothermal method, the precipitation process and also by the hydrothermal chemical route using Bi(NO3)3.5H2O and KI as precursors [22, 65–71].

Figure 1. SEM images of the as-synthesized BiOI NPs.
Download figure:
Standard image High-resolution imageThe mean diameter of the BiOI nanoaggregates is approximately 1.5 μm. The XRD diffraction pattern of the as synthesized BiOI (figure 2(a)) is consistent with the tetragonal phase of BiOI reference pattern (ICSD number 391354), where main diffraction peaks are observed at 29.25°, 31.67°, 45.48°, 51.44° and 55.21° which belong to (102), (110), (200), (114) and (212) planes, respectively [67]. Figure 2(b) shows the FTIR spectrum of the as synthesized BiOI NPs collected in the range between 450–4000 cm–1. The characteristic band around 477 cm−1 was assigned to the stretching vibration mode of Bi–O and the absorption peaks centered at 3400 cm−1 and 1622 cm−1 were assigned to the –OH stretching and bending modes of adsorbed water molecules [69, 72, 73].

Figure 2. (a) XRPD diffractogram of as-synthesized NPs and standard pattern of BiOI NPs, (b) FTIR spectrum of the as-synthesized BiOI NPs.
Download figure:
Standard image High-resolution imageThree-dimensional neat RGO aerogels obtained by chemical reduction and self-assembly exhibited a porous structure with high porosity, large surface area, low density and excellent mechanical properties [21, 38–40]. The reduction was performed in a sealed vial for 1 h at 90 °C. Details of the experiment procedures are shown in scheme

Scheme 1. Schematic illustration of the preparation process of RGO aerogels.
Download figure:
Standard image High-resolution imageThe initial concentration of GO was 3 mg ml−1 and the mass ratio of AA with respect to GO (AA:GO) was fixed at 3.6. From previous works reported in the literature [74, 75], the amount of AA needed for the reduction is at least 3.3 times the amount of GO. Ascorbic acid was selected because it is a green reducing agent and it has been reported to produce mechanically strong monoliths with large specific surface area [21, 41, 42].
SEM images in figures 3(a) and (b) and the photograph (inset of the image) of figure 3(a)) show the morphology of the RGO aerogel obtained by using ascorbic acid as reducing agent. A 3D porous interconnected network with a mean pore size of about 1–2 μm could be clearly observed. In figure 3(c), a test showing the mechanical strength of the as-synthesized RGO monoliths is presented. It is interesting to mention that despite having a porous structure and low density (approximately 10 mg cm−3), the 6 mg aerogel can support 16 times its own weight without any permanent deformation after compression.

Figure 3. (a) and (b) SEM images of RGO aerogel, (c) Recovery after compression of a 6 mg RGO aerogel with a 100 g counterpoise.
Download figure:
Standard image High-resolution imageIn the first approach used to prepare hybrid RGO/BiOI aerogels, BiOI microstructures were incorporated to the GO dispersion with the help of an ultrasonic probe, without the addition of extra water. It can be seen from the photograph of the vial in scheme
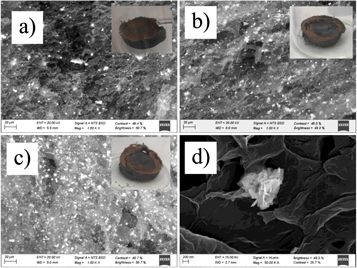
Figure 4. SEM images of (a) RGO/BiOI_0.4, (b) RGO/BiOI_0.8, (c) RGO/BiOI_1.6, (d) FESEM image of RGO/BiOI_0.8, Photographs of RGO/BiOI aerogels (inset of SEM images).
Download figure:
Standard image High-resolution imageDifferent origins for the dramatic effect that NPs has on the aerogel structure can be hypothesized. It is possible that during the reduction in presence of NPs, the electrostatic forces may weaken making that van der Waals and π-π interactions become the dominating forces responsible for the collapse of the aerogel. Under these conditions, RGO sheets would get extremely closer giving rise to a compact structure with a strong sheet overlapping. It is expected that, in the initial colloidal dispersions, GO sheets can interact with BiOI NPs through hydrogen bonding between –OH groups present in NPs, and the epoxy and hydroxyl functional groups on GO. During the reduction process, some of the groups responsible for this initial compatibility would disappear provoking the expulsion of some of the NPs to the aerogel surface [46].
XRPD patterns of GO, RGO, BiOI and RGO/BiOI_0.4 are shown in figure 5. GO presents a sharp peak at 2θ = 10.6°, which is correlated to an interlayer distance (d-spacing) of 0,83 nm [76]. This value is higher than in natural graphite (d = 0.34 nm) due to the presence of oxygenated groups on GO. From the RGO aerogel pattern, it can be seen that the sharp peak of GO disappeared, and a new broad and weak peak becomes dominant (2θ = 23.7°). The d-spacing was calculated as 0.37 nm (slightly higher than natural graphite) indicating that most of the oxygenated groups disappeared during the reduction and some residual functional groups may exist in RGO sheets. It also suggested that the π-π stacking and hydrophobic interactions between RGO sheets induces the formation of the aerogel [39, 44, 76–79]. RGO/BiOI_04 XRPD diagram shows both the peaks of BiOI NPs (marked with circles) and the RGO broad peak, indicating that the reduction has taken place in the presence of NPs. Two small peaks can be also observed at 2θ = 11° and 12°, denoting the coexistence of RGO with a small amount of GO or with partially reduced GO [80]. This result may suggest that some GO sheets involved in the stabilization of BiOI NPs cannot be reduced or were only partially reduced. By further increasing the ratio of BiOI:GO, the broad diffraction peak of the RGO disappeared, which might be due to the relatively low diffraction intensity of reduced graphene with respect to BiOI in those formulations (figure S2).

Figure 5. XRPD diffractgrams of BiOI NPs, GO, RGO and RGO/BiOI_0.4.
Download figure:
Standard image High-resolution imageFTIR spectroscopy was used to analyze the changes in the oxygenated groups before and after the reduction. Figure 6 shows the FTIR spectrum of GO. The characteristic bands and their assignments are detailed in table 2 [81]. After 1 h of reduction, RGO and RGO/BiOI become very similar as it can be seen in figure 6. Hydroxyl and alcoxy groups are remarkably reduced in intensity (3425 cm−1, 1406 cm−1, 1042 cm−1) and epoxy groups completely disappeared (1220 cm−1 and 979 cm−1) [82–84]. On the other hand, the 2800 cm−1 peak, assigned to –CH vibration, appears as a consequence of the reduction of –COOH to –CH3 [85]. These observations also confirm that the reduction occurred partially both in the presence and in the absence of BiOI, indicating that some oxygenated groups are still present in RGO sheets [75, 86].

Figure 6. FTIR spectra of BiOI NPs, GO, RGO and RGO/BiOI_0.4.
Download figure:
Standard image High-resolution imageTable 2. Assignment of the characteristic bands in the GO spectra.
| Wavenumber (cm−1) | Assignment |
|---|---|
| 3425 | stretching vibrations of –OH group from the carboxyl functional group |
| 1729 | C=O stretching vibrations from carboxyl or carbonyl group |
| 1617 | aromatic C=C (overlapping with bending mode of –OH) |
| 1406 | –OH deformation |
| 1220 | –C–O of the epoxy group |
| 1042 | –C–O from alcoxy group |
| 979 | –C–H bending vibration of epoxy group |
Raman spectroscopy is a powerful technique to analyze the structural changes in graphene based materials, including disorder, structural defects or defect density, and doping levels [87, 88]. The Raman spectra of GO, RGO, BiOI and RGO/BiOI, shown in figure 7, exhibit two remarkable peaks at around 1354 cm−1 and 1596 cm−1 corresponding to the defined D band and G band, respectively. The D band is associated to the breathing modes of sp2 atoms and is attributed to the sp3 defects in the sp2 lattice. The G band corresponds to the first order bond stretching of sp2 carbon atoms [87, 89–92]. The ratio of intensity of both peaks, ID/IG, is used to characterize the level of disorder (structural defects) [38] and is inversely proportional to the average size of in-plane sp2 domains [93]. It is clear from these results that more graphitic domains are present after reduction, but with a smaller size than the ones present in GO before reduction, which then conducts to the presence of a larger quantity of structural defects [94–97].
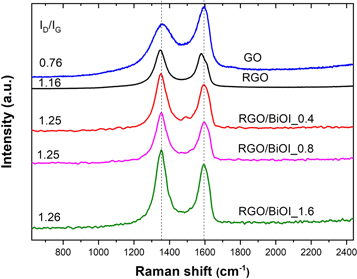
Figure 7. Raman spectra and ID/IG values of GO, RGO and RGO/BiOI with different mass ratios.
Download figure:
Standard image High-resolution imageID/IG ratio for RGO (1.16) increased with respect to the ID/IG in GO (0.76), meaning that more defects are present and that the average size of in-plane sp2 domains is smaller than the ones present in GO [98]. ID/IG for the three formulations of RGO/BiOI are similar and higher (1.25) than ID/IG for neat RGO. This result suggest that more sp2 domains are formed during the reduction of graphene oxide in the presence of NPs, increasing the disorder or number or defects of the RGO/BiOI respect to RGO.
Different strategies were carried out to improve the dispersion of the NPs within the RGO aerogels and to avoid the collapse of the porous structure. The variation of the initial concentration of GO and the incorporation of PEG to the initial mixture were analyzed.
NPs were dispersed in water, in 1 ml or 2 ml, prior mixing with GO. As a result, two samples were obtained with GO concentration of 2 and 1.5 mg ml−1 respectively. SEM images in figures 8(a) and (b) show RGO/BiOI aerogels with an interconnected porous structure and a good dispersion degree of the NPs within the aerogel. The inset photographs in the SEM images also confirm that NPs were not expelled during the reduction and in situ self–assembly processes. SEM images of figures 8(c) and (d) show the aerogels obtained under the same conditions in absence of NPs. The first thing that it can be observed is that the pore sizes of the aerogels with NPs are smaller than those of RGO in absence of NPs. Besides, with the increase in the concentration of GO in the initial dispersion, the pores appeared to be smaller, maybe because of the higher proximity between the sheets [41, 44, 99]. FESEM image of RGO_2/BiOI_0.4 in figure S3 shows clearly that the flower like morphology of BiOI NPs is preserved. So here the addition of water has helped preventing the expulsion and agglomeration of NPs within the aerogels and kept the GO/RGO sheets more separated during the self-assembly process.

Figure 8. SEM images of (a) RGO_2/BiOI_0. 4, (b) RGO_1.5/BiOI_0.4, (c) RGO_2 and (d) RGO_1.5.
Download figure:
Standard image High-resolution imageFrom Raman spectra of figure 9, we can again find that the calculated ID/IG ratio increased with the incorporation of BiOI NPs indicating that more defects are introduced due the presence of the NPs.

Figure 9. Raman spectra of RGO_2/BiOI_0.4, RGO_1.5/BiOI_0.4, RGO_2 and RGO_1.5.
Download figure:
Standard image High-resolution imageTo improve further the quality of RGO/BiOI aerogels, avoiding increase the level of dilution of the NPs dispersion, the use of PEG as additional reactant was explored as an alternative strategy. PEG can act as a mediator of the gelation process by initially forming hydrogen-bonds with oxygenated groups of GO, and replacing the π-π and hydrophobic interactions during the reduction process, preventing in this way the overlapping of RGO sheets [63, 100]. With the incorporation of PEG, a homogeneous porous structure is obtained as observed in the SEM images of figure 10. As can be clearly seen from photographs of the inset of SEM images, NPs were not expelled from the aerogel indicating that PEG acted as compatibilizer between the NPs and the RGO sheets. Some agglomerates could be observed with the increase of the NPs concentration due to the higher mass ratio of BiOI to GO. Besides, with the increase of NPs content, a higher number of smaller pores were observed when compared with RGO/PEG aerogel (without NPs). In the SEM images of figure 11, we can observe the effect of the incorporation of PEG for a fixed mass ratio of BiOI/GO equal to 0.4. When PEG is used as modifier, a more opened structure is obtained as it may prevent shrinkage of the sheets [63]. In this way, it can maintain the porosity of the structure and give place to an homogenous dispersion of the pore size [63].

Figure 10. SEM images of (a) RGO/BiOI_ 0.4/PEG, (b) RGO/BiOI_ 0.8/PEG, (c) RGO/BiOI_ 1.6/PEG , and (d) RGO/PEG.
Download figure:
Standard image High-resolution image
Figure 11. FESEM image of RGO/BiOI_0.8 (left) and RGO/BiOI_0.8/PEG (right).
Download figure:
Standard image High-resolution imageEDS mapping was performed for RGO/BiOI_0.4/PEG and RGO/BiOI_0.8 aerogels (figure S4). The analysis of the atomic elemental distribution confirms that the brighter regions in the SEM micrographs can be assigned to BIOI NPs, as they are mainly composed by Bi and I. Also C and O elements are present, which could be associated to the RGO matrix.
XRPD diffractograms of RGO/PEG (figure 12), show the presence of two peaks, pointing to the partial reduction of some RGO sheets [101]. The broad peak at θ = 22.43° indicates that the interlayer distance slightly increased with the incorporation of PEG, (d = 0.39nm) with respect to the RGO aerogel (d = 0.37 nm), due to the intercalation of PEG between the RGO sheets and the weakness of the π-π interactions [63, 64]. In the case of the RGO/BiOI_ 0.4/PEG diagram, all diffraction peaks of BiOI can be observed (marked as dots in figure 2) along with the two peaks seen for the aerogel without NPs.

Figure 12. XRPD diffractogram of RGO/PEG and RGO/BiOI_ 0.4/PEG.
Download figure:
Standard image High-resolution imageFTIR spectra of RGO/PEG and RGO/BiOI_0.4/PEG (figure 13) show the characteristics peaks of PEG [102]. In RGO/PEG spectrum the band at 1578 cm−1 could be assigned to the bending mode of –OH shifted from 1616 cm−1 respect to RGO (figure 6) possibily due to the hydrogen bond interaction between RGO and PEG. The peak at 1208 cm−1 (associated to epoxy groups) in RGO/PEG spectrum, that appeared at 1220 cm−1 in GO and is absent in RGO, also confirm the presence of an hydrogen bond interaction with PEG. It is interesting to mention that both 1578 cm−1 and 1208 cm−1 are absent in samples with NPs (RGO/PEG/BiOI), suggesting that PEG could be involved in the stabilization of NPs. Moreover, the peak at 1092 cm−1 in the PEG spectrum associated to the stretching vibration of the C–O–C group, (attributed to the repeating oxyethylene (–OCH2CH2–) units of the PEG backbone) [85], shifted to a higher frequency in the RGO/PEG spectrum and to a lower frequency in the spectrum of RGO/BiOI_ 0.4/PEG. These results could also suggest that PEG is involved in the stabilization of NPs.

Figure 13. FTIR Spectra of PEG, RGO/PEG and RGO/BiOI_0.4/PEG aerogels.
Download figure:
Standard image High-resolution imageRaman spectra of figure 14, shows that the ID/IG ratio for RGO/PEG is higher than the value for RGO, increasing even more with the incorporation of NPs (although it slightly decreases when a higher concentration of NPs is incorporated). From these results it was concluded that both the incorporation of BiOI and PEG increase the degree of disorder or defects in RGO.

Figure 14. Raman spectra of RGO/PEG and RGO/BiOI_ 0.4/PEG aerogels.
Download figure:
Standard image High-resolution imageOptical and photocatalytic activity
The optical properties of different samples were analyzed by UV–vis DRS. Figure 15 shows the UV-Vis DRS spectra of BiOI NPs and aerogels prepared with different compositions. The absorption edge of BiOI NPs estimated from the DRS spectra is 660 nm and their band gap calculated from Tauc´s plot [103] is 1.96 eV (see figure S5), both in concordance with values obtained in bibliography [22, 60, 104, 105]. For wavelengths longer than 660 nm the photo-absorption of BiOI is weak. Absorbance spectra of RGO samples exhibited strong absorption in both UV and Visible regions. So, these results show an absorption increase in the visible region in the case of RGO composites, suggesting that photocatalytic properties of RGO aerogels in the visible range could be enhanced with respect to pure BiOI NPs.

Figure 15. UV- Vis diffuse reflectance spectra of pure BiOI NPs, neat RGO and composite aerogels.
Download figure:
Standard image High-resolution imageA set of photocatalytic experiments were performed (figure 16) to compare the efficiency and impact of the morphology of each sample on the ability of BIOI/RGO hybrid materials for contaminant removal. 3 mg of selected samples were immersed or dispersed in the solution of MB (4.5 ppm) and kept in it for 30 min in dark conditions to reach adsorption equilibrium. During this time, the UV-Vis absorption spectra of MB were taken every 10 min. Afterwards, the simulated solar irradiation (in the visible range) was turned on for 60 min and UV-Vis absorbance spectra of MB were acquired every 5–10 min.
Prior to evaluate the performance of the prepared composite aerogels, different blank experiments were carried out. First of all, MB was tested under visible light irradiation without the addition of photocatalyst (photolysis). From figure 16, it is observed than only 10 % of MB was removed during 60 min under visible irradiation, which is consistent with values found in other works [69, 106, 107]. Then, the photocatalytic degradation of MB by pure BiOI NPs was analyzed showing only 25% of removal, a value too low for practical applications. This low photocatalytic performance of BiOI NPs against MB has also been observed in previous works reported in the literature [69, 108]. Finally, the properties of neat RGO aerogel was analyzed. Interestingly, RGO aerogel produced a noticeable decrease in the concentration of MB (60 %) after 60 min of treatment under visible irradiation. Only few works, have demonstrated that neat 2D RGO and 2D GO nanosheets can produced photodegradation of MB under visible and/or UV light irradiation [109–111]. In fact, several works have reported that although RGO aerogels show a high adsorption affinity by MB they present a low rate of MB degradation under visible light irradiation (or even not show photodegradation at all) [28, 29, 48, 55, 112]. To clarify if the decrease in the MB absorbance was due to an adsorption or degradation process, a MB adsorption experiment in presence of neat RGO was performed in dark conditions during 90 min (data not shown). Results showed that the equilibrium adsorption value was reached after 30 min of contact with the solution at dark and that after this time not changes in surface adsorption occurred. This would indicate that the outstanding response of neat RGO for MB removal is due to its inherent photodegradation.
After these blank measurements were performed, the photocatalytic activity of aerogels containing BiOI NPs was investigated. In the case of the RGO/BiOI_8 aerogel, prepared by simple mixing of powdered NPs with the GO dispersion, the removal efficiency was 14 %, a much lower value than for pure NPs. The obtained curve almost follows the kinetics of photolysis obtained for the pure MB solution. These results suggest that the collapse of the structure of the aerogel and the agglomeration of the NPs on its surface are not beneficial neither for the adsorption process of the MB nor for the photodegradation activity of BiOI NPs. However, in the case of RGO/BiOI_0.8/PEG aerogel, where PEG was used to improve the dispersion of the NPs, the efficiency of MB removal was 42 %, much higher than for pure BiOI NPs and RGO/BiOI_0.8 (without PEG). The improvement of photocatalytic performance of RGO/BiOI_0.8/PEG aerogel with respect to pure BiOI NPs and to RGO/BiOI_0.8 could be associated to a better dispersion of the NPs within the aerogel and to the increase in the number of active sites available for photodegradation. In addition, RGO/BiOI_0.4/PEG, containing 30 wt% of BiOI with respect to GO, showed almost the same photocatalytic response (40 % of MB removal) that RGO/BiOI_0.8/PEG containing 30 wt% of BiOI. However, it is important to recall that in the case of aerogels containing PEG, the effective mass of catalyst (BiOI and GO mass) could be less than 3 mg, which is the mass used for the other analyzed samples (RGO, BiOI NPs and RGO_BiOI_0.8). This came out because, as it was mentioned in the experimental section, a large amount of PEG is removed during washing precluding knowing the precise mass of PEG that would remain in the final aerogel. So, the removal rate cannot be directly compared with the others samples but it can be understood that the aerogel porosity and dispersion degree of NPs within the aerogel are fundamental variables to control the photocatalytic response of the hybrid monoliths.
It is important to mention that additional experiments should be performed to determine the optimum mass ratio of BiOI to GO and the morphology and structure of the aerogel that gives the highest photocatalytic performance. In this sense, other parameters need to be studied like catalyst loading, volume and initial concentration of the dye employed, etc, to understand the mechanism of the photodegradation of MB and to be able to extend these results to other dyes or contaminants. These studies will be the subject of future work.
XRPD diffratograms of RGO, RGO/BiOI_0.8 and RGO/BiOI_0.4/PEG were recorder after recycling. As it can be seen from figure S6, not significant changes in phase and structure are observed. These results suggest that aerogels have the potential of being reused, simply by pulling them out of the reaction medium with tweezers.

Figure 16. MB removal in presence of 3 mg of BiOI NPs, pure RGO and hybrid monoliths in aqueous solution.
Download figure:
Standard image High-resolution image
Conclusion
With the aim of showing the feasibility of lightweight and easy to manipulate materials to be used as complementary technique for the degradation of small compounds in water treatment applications, we have prepared 3D aerogel using RGO as a supportive matrix and photocatalytic nanoparticles, BiOI. Hybrid RGO/BiOI aerogels were prepared by a simultaneous reduction and self-assembly process using ascorbic acid as a green reducing agent in the presence of BiOI NPs. Different strategies were employed to successfully incorporate these NPs within the aerogel and to tune the morphology and structure of the hybrid monoliths. The incorporation of PEG as reactant allowed not only to obtain a good dispersion of the NPs within the aerogel and a homogenous and open porous structure but also to improve the synergic effect of RGO and BiOI NPs, enhancing the photocatalytic performance of the BiOI NPs for the photodegradation of MB. Both porosity and dispersion degree of NPs in the aerogel have proved to be fundamental variables in the control of the photocatalytic response. Thus, the technique presented here can be readily extended to combine different photocatalytic NPs in the same matrix, either to maximize the exploitation of visible light spectrum, or to produce heterophotocatalytic reactions (where the concurrence of different species is required) to be used in the simultaneous degradation of a variety of contaminants. Furtherly, it could be extrapolated also to prepare specific graphene-based aerogels for applications in a variety of areas, such as chemical sensors, lithium-ion batteries and so forth.
Acknowledgments
J P and C E H gratefully acknowledge the financial support of the National Research Council (CONICET), the National Agency for the Promotion of Science and Technology (ANPCyT, projects PICT17-03944 and PICT17-1292) and the University of Mar del Plata.
This work was supported by the European Commission under the PANA project, Call H2020-NMP-2015-two-stage, Grant 686009, and partially supported by the Consellería de Educación Program for the Development of Strategic Grouping in Materials—AEMAT at the University of Santiago de Compostela under Grant No. ED431E2018/08, Xunta de Galicia.
Data availability statement
All data that support the findings of this study are included within the article (and any supplementary files).