
Abstract
A new metrological atomic force microscope (MAFM) with combined deflection detection system that comprises a homodyne interferometer and an optical beam deflection measuring system are presented. The combination allows the simultaneous three-dimensional detection of position, bending and torsion of the cantilever. Two wedge plates with a wedge angle of 0.5° have been integrated to reduce the disturbing interferences. The new measuring system uses two tiltable plane mirrors and a shiftable focus lens to adjust the direction of the focused laser beam and the position of the focus. The integration of the MAFM head in a nanomeasuring machine (NMM-1) creates the possibility of traceable dimensional measurements over a large range of 25 mm × 25 mm × 5 mm with sub-nanometre resolution. This paper introduces its setup, realisation and metrological properties, such as stability of the characteristic curves, noise level and combined measurement uncertainty. Finally, exemplary measurement results are presented.
Export citation and abstract BibTeX RIS

Original content from this work may be used under the terms of the Creative Commons Attribution 4.0 licence. Any further distribution of this work must maintain attribution to the author(s) and the title of the work, journal citation and DOI.
1. Introduction
Scanning probe microscopy (SPM) is widely used in nanotechnology and electronics. According to the nature of interaction between probe and sample SPMs can be distinguished in different groups, e.g. the scanning tunneling microscope, the atomic force microscope (AFM) or the scanning near-field optical microscope (SNOM). As the main group of SPMs [1], AFMs have been used to meet the challenges for dimensional metrology in key technologies such as the semiconductor industry and precision engineering. The functional principle of AFMs is based on the detection of deflection of a cantilever, which is caused by the dominant attractive or repulsive interaction forces [2] between the tip of the cantilever and the measured surface. The bending and torsion of cantilevers can be detected by many different techniques, such as piezoresistance, piezoelectricity and optical beam deflection (OBD). Among these, the OBD technique is the most widespread method [3]. On the other hand, the position of the cantilever is measured by focus sensor detection systems and interferometric detection systems [4]. Measurements using laser interferometer can be directly traced to the metre definition by the laser wavelength.
Decreasing structural sizes and feature miniaturisation with concurrent increasing component dimensions characterise the measurement tasks for micro- and nanomeasuring systems. Advances in those areas require quantitative dimensional measurements with nanometre accuracy as well as measurements over large measuring ranges. Except for some specially designed systems (e.g. [5]), the working area of piezo actuators, which are used to operate AFMs, is generally in the micrometre range. Besides, there are also limitations of the mechanical structure and the applied sensor system for measuring the displacement [6]. The traceable measurement with the practice-oriented working areas for microcomponents is only possible by combining the AFM sensors with large-range scan stages or nano coordinate measuring devices. In this way, both the requirements of nanometrology and the mesoscale measuring range can be achieved.
The nanomeasuring machine NMM-1 with a positioning and measuring volume of 25 mm × 25 mm × 5 mm and a measurement resolution of less than 0.1 nm [7] creates the possibility for dimensional measurements over large areas with high precision and was also used by different metrology instituts for large-range AFM systems [8, 9]. These measurements are influenced by the metrological properties of the integrated measuring system. Accordingly, the metrological properties of the interferometric atomic force microscope must be identified and the system must be calibrated.
This paper deals with the functional principle, metrological properties and the calibration of a metrological atomic force microscope (MAFM) with combined deflection detection system that comprises a homodyne interferometer and a optical beam deflection measuring system. Furthermore, the uncertainty of measurements is analysed and examples of measurements are illustrated.
2. System setup
A new version of a metrological laser interferometer-based AFM head with a combined cantilever position, bending and torsion detection system has been developed at our institute. The measuring head was firstly developed with the objective to enable simultaneous measurement of the position, bending and torsion of the probe with exact interferometric position and deflection measurement, which is performed directly on the reflecting backside of the probe with a single focused beam [9–11]. The reflected measuring beam is split into two parts. One part is detected with a position sensitive device (PSD) to determine the bending and torsion, while the other part is led into the interferometer to measure the position.
The optical system has been redesigned and newly manufactured because of some disturbing interferences arising on the PSD, which were caused by multiple reflections on the quarter wave plate [4, 11].
Figure 1 shows the functional principle of the new system. The signal quality has been improved by integrating two wedge plates with a wedge angle of 0.5° to reduce disturbing interferences [4]. The new measuring system uses two tiltable plane mirrors and a shiftable focus lens to adjust the direction of the focused laser beam and the position of the focus to adapt to different cantilever lengths, positions and orientations [4]. The adjustable angle of one tiltable plane mirror is ±3°, when the other tiltable plane mirror is fixed. Accordingly, the realized lateral focus displacement for adjustment is 250 μm ∼ 290 μm. The adjustable tilt and shift ranges are essential to adapt the system in case of exchanging the cantilever.
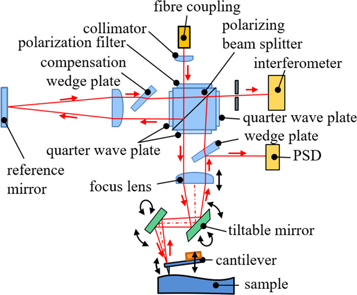
Figure 1. Functional principle of the MAFM.
Download figure:
Standard image High-resolution image3. Metrological properties
This MAFM sensor is mounted onto the NMM-1 by the slide-in system of the Zerodur plate, which is part of the measuring frame (figure 2). Electrical integration is well provided with the set of analogue inputs of the NMM-1 for different probe systems. The lateral scanning motion and the vertical motion (e.g. for the constant force, amplitude or frequency mode) are performed by the NMM-1. A corner mirror carrying the object to be measured is positioned by a three-axis drive system. The position of the corner mirror is measured with three homodyne interferometers supplied by three frequency stabilized lasers.
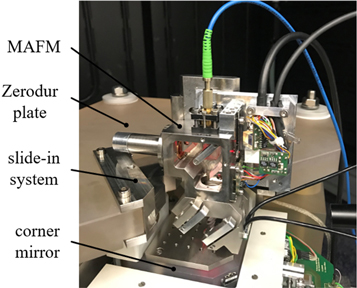
Figure 2. MAFM on NMM-1.
Download figure:
Standard image High-resolution imageThe three interferometers inside the NMM-1 measure the position of the corner mirror in real time so that the positioning control loop can assure a movement resolution of less than 0.1 nm [12]. The metrological properties of this MAFM are influenced by the total measuring system, i.e. the probing system and the NMM-1.
3.1. Stability of the characteristic curves
In order to perform measurements, the MAFM sensor has to be calibrated against the traceable z-interferometer of the NMM-1. The sampled output signals of the MAFM sensor must be converted in length values using polynomial coefficients, which are derived from the characteristic curves of the output signals of the probing system. The working range and set point (needed for the force control) are determined from the approach and retract curves. From the consecutively repeatedly recorded (two hundred times) characteristic curves the linearity and the repeatability of the polynomial coefficients, i.e. the offset and the slope can be analysed. The residuals r, or rather the deviations of the calibration are calculated according to the equations derived in [7]. The standard deviations of the slope are less than 4·10−4 nm/digit and the standard deviations of the mean residuals r do not exceed 0.6 nm. The offset and the standard deviations highly depend on temperature. In our system, the temperature dependence of the drift of the bending signals can be estimated as 100 nm/K.
3.2. Signal noise
The analog signals of the MAFM are connected to the 16-bit A/D-converter of the digital signal processor (DSP) of the NMM-1. In order to analyse the signal noise, the bending signal dz and the position data of the z-axis of the NMM-1 lz were recorded by the A/D-converter of the DSP unit for 10 s. A moving average filter was applied to the raw data in order to remove the drift and calculate the signal noise values. The standard deviation of the signal noise without contact to the measured surface amounts to 0.2 nm (figure 3, red). The standard deviation of the signal noise with contact to the measured surface and without or with control of the NMM-1 is 0.93 nm or 1.41 nm (figure 3, green or blue), respectively. In this case, the MAFM operates as a passive probe system, where the lateral scan motion and vertical scan/control motion are carried out by the NMM-1. The NMM-1 control dynamics is limited by the high masses of the stage and corner mirror of the NMM-1. The signal noise of the bending signals was therefore dominated by the influence of low-frequency disturbances on the stage.
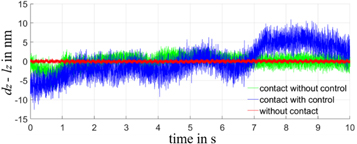
Figure 3. Bending signals (raw data).
Download figure:
Standard image High-resolution image3.3. Measurement uncertainty contributions
The measurement uncertainty is defined as the parameter assigned to the measurement result, which characterises the spread of the values that can be reasonably assigned to the measured results [13]. According to the guide to the expression of uncertainty in measurement (GUM), the individual values of each uncertainty component can be evaluated according to type A method, which determines by evaluating several statistically independent measured values from the series of measurements, or type B method, which determines by other means, for example by taking the values from a calibration certificate or personal experience [14].
The measurement uncertainty depends on the entire measurement chain. At the beginning of the measurement chain is the laser source. With the laser interferometric measuring method, the measured path difference is represented by a function of the wavelength of the He-Ne laser. Since the measurements do not take place in a vacuum, the influence of the refractive index n of the medium must be taken into account. Environmental influences such as temperature, air pressure, air humidity and CO2 content play a role in determining the refractive index and measurement uncertainty. A measurement of the CO2 content is omitted due to the lower influence and high power loss of the CO2 sensor [7]. The current refractive index n of the air for a wavelength of 632.991234 nm can be calculated with known data of temperature, air pressure and air humidity and is only carried out after a new sampling of environmental data.
Firstly, the water vapour partial pressure pv in Pa is calculated from the saturation water vapour partial pressure psv in Pa using the relative humidity RH in % and the air temperature T in K derived from the air temperature ϑ in °C (T = ϑ + 273.15 K) according to equation (1) [7, 15, 16].

with the following coefficients of the Davis formula:
- ADav = 1.2378847·10–5,
- BDav = −1.9121316 10–2,
- CDav = 33.93711047,
- DDav = −6.3431645·103.
The correction with the measured values for air pressure p in Pa and air temperature ϑ in °C is carried out according to equation (2) [7, 15].

Subsequently, the refractive index is corrected with a specified value for the CO2 content x (default value 300 ppm) and the calculated water vapour partial pressure pv according to equations (3) and (4) [7, 15].


with the following coefficients of the Bönsch equations and substitution constants:
- DBoe = 93214.6,
- EBoe = 0.5953·10–8,
- FBoe = 0.009876·10–8,
- GBoe = 0.0036610,
- HBoe = 0.5327·10–6,
- IBoe = 400,
- Substitution constant c1 = 2.6822780908·10–4 for λ = 632.991234 nm,
- Substitution constant c2 = 3.7061624213·10–10 for λ = 632.991234 nm.
A simple recursive filtering of the air refractive index minimises the jumps of the length measurement value, which result from the limited resolution of the environmental measurement.
By forming the partial derivatives for each environmental parameter, the relative sensitivities of the refractive index of air per unit can be determined for the working point. The influence of temperature, air pressure and water vapour pressure on the refractive index is quantified with the coefficients of −0.903·10−6 / K, 0.268·10−8 / Pa and −3.706·10−10 / Pa, respectively. The products of the coefficients and the uncertainty of the parameter estimation show that a change in the environment temperature has the greatest influence on the refractive index of the air n.
As an incremental measuring method, the evaluation of the measurement signals based on the detection of the number and fraction of the interference fringes starting from a reference point. The fringe counter must be initialised by setting it to zero at a certain position before a measurement, where the length difference between the measuring arm and the reference arm must be known. This length difference is called the dead path length lt. If the zeroing of the measurement is set at the position of the dead path length (figure 4, position 0), the difference of the beam lengths lg results from the measured length lm and the dead path length lt. For a difference measurement between two measurement positions, the result can be calculated as difference between the measured lengths of the two positions (e.g. ld = lm2 − lm1).
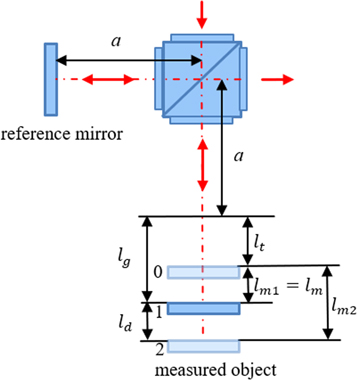
Figure 4. Schematic presentation of the dead path (zeroing position 0, measuring positions 1 and 2).
Download figure:
Standard image High-resolution imageThe uncertainty contribution of the dead path length results from the fluctuation of the vacuum wavelength and of the refractive index and thus from the fluctuation of the wavelength due to change of the environmental conditions. With the same length a of the measuring arm and reference arm, the two arms can compensate each other by the same change of environmental conditions. If the optical paths of the measuring arm and the reference arm are not the same, the change in wavelength causes a change in the fringe counter, although the position of the measured object and the reference mirror do not change.
Taking the influence of the dead path into account, the calculation of the measuring length lm(t) at time t can be carried out according to the following equation [7]:

Here n(0) is the refractive index when the fringe counter is set to zero and n(t) is the current refractive index. Because the beam is folded once at the mirror, an interferometer factor kIF of 2 is used. The division factor kTF depends on the electronics used in the NMM-1 for demodulating the interferometer signals and is given as kTF = 16384 (14-bit arctan register). λvac(t) and λvac(0) are the current vacuum wavelength and the vacuum wavelength at zeroing, respectively. N(t) is the sum of the counted number of interference fringes multiplied by the division factor and the current arctan value. Based on this calculation for the measuring length and by adding the other uncertainty contributions, a measurement uncertainty for the positioning or individual measuring point can be determined. The uncertainty of the position measurement of the NMM-1 has been discussed in detail in [7, 17]. A positioning uncertainty of 3 nm (k = 2, a level of confidence of 95%) is assumed for the used revision status of the NMM-1 [18].
For the measurement results an overlay of the uncertainty contributions can be assumed. According to GUM, a model of the calculation must be developed in order to assess the uncertainty of the measurement results. For measurements with the MAFM sensor the profile height (z-direction) is calculated as the difference between the calibrated signal and the z-axis position data of the NMM-1. In intermitted contact mode (IM), the profile height (z-direction) is determined as the difference between the calibrated amplitude signal and the z-axis position data of the NMM-1. However, in contact mode (CM) the profile height (z-direction) is given as the difference between the calibrated bending signal and the z-axis position data of the NMM-1. Measurement results using the AFM can be considered at least as the difference between two probing points [7]. For example, in CM the height information H of the measurement result is given as the difference between two measuring points at the times ti and ti−1 with i ≥ 1:

According to GUM, the term of the standard uncertainty of each uncertainty component u(xi ) and its sensitivity coefficient ci are required as uncertainty contribution for the determination of the combined measurement uncertainty of the measurement result. The sensitivity coefficients are determined by the differential quotients and describe the dependence of the measurement result on the input variables [14].

The correlations between the input variables must be taken into account, for example, the correlation between air refractive indexes n at times ti and ti−1. In order to achieve the decoupling of the influencing variables for the uncertainty calculation, the environmental data, refractive indexes or wavelengths at times ti can replaced by the sum of the value at time ti−1 and the difference value up to the time ti [7].

On one hand this means that only the changes or scattering during the measurement as a result of the scattering of the vacuum wavelength, the scattering of the acquisition of the environmental values as well as the occurring changes of the environmental values affect the difference. On the other hand, the uncertainties of the determination of the values at time ti−1 are included, for example, as uncertainties of the calibration of the laser light sources and of the environmental sensors as well as the determination of the dead path length.
In order to estimate the drift and the creep of the bending signal, the uncertainty values for the residuals r of the calibration characteristic curves are included. In CM the combined uncertainty for the determination of the step height standards is 5.81 nm in a time period of up to 3 h in the laboratory of the FMT with a temperature stability of ±40 mk, an air pressure fluctuation of ±50 Pa and a humidity fluctuation of ±0.9%. The uncertainty of the residual u(r) and the positioning uncertainty of the NMM-1 u(lz) are the main contributions.
4. Application of measurements
The MAFM sensor was used for measurements of different lengths and scales of step height standards, pitch standards and areal measurements [4]. The measurements were carried out both in the CM and in the IM with the cantilever PPP-CONTSCR and PPP-XYNCHR of the XY-Alignment-Series from the company Nanosensors [19].
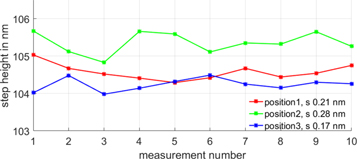
In the following, exemplary measurement results of step height standards from the company NT-MDT are presented. The step height standards named TGZ1 with a nominal step height of (21.4 ± 1.5) nm and TGZ2 with a nominal step height of (108 ± 2) nm were scanned forwards (f) and backwards (b) at different positions. For every position the measurements were repeated 10 times. The step height was calculated according to DIN EN ISO 5436–1 [20]. Before the calculation a leveling function was applied to correct the tilt of the standards.
Table 1 shows the determined mean step height (m) and standard deviation (s) of TGZ1 and of TGZ2 measured in CM and IM. The standard deviations of both standards in CM do not exceed 0.6 nm. The measured values for the step height of TGZ1 agree with the nominal values. However, the measured values of TGZ2 in both modes are smaller than the given nominal value, but the measured values determined in both modes for TGZ2 agree with each other.
Table 1. Results of step height measurements.
| Forward | Backward | |||
|---|---|---|---|---|
| Standard | m in nm | s in nm | m in nm | s in nm |
| CM | ||||
| TGZ1 | 21.51 | 0.34 | 21.64 | 0.6 |
| TGZ2 | 104.57 | 0.21 | 104.09 | 0.27 |
| IM | ||||
| TGZ1 | 22.67 | 1.26 | 22.77 | 1.49 |
| TGZ2 | 102.35 | 1.51 | 102.54 | 1.2 |
As an example, figure 5 shows the measurement results of TGZ2 in CM at three different positions (only obtained results of the forward scans are shown). It is obvious that even though the measured values of TGZ2 are smaller than the nominal value, a good agreement between the measurement results is shown. The uniformity and possibly the cleanness of the standards also have an impact on the measurements results.
Figure 5. Measurement results at three positions (forward scans).
Download figure:
Standard image High-resolution image
5. Conclusion and outlook
This paper deals with a new metrological atomic force microscope. The MAFM sensor combines an interferometer with a PSD to detect the cantilever torsion, bending and position. The new measuring system can be adapted to cantilevers with different lengths, positions and orientations due to the two tiltable plane mirrors and the shiftable focus lens.
Due to the integration into the NMM-1, this MAFM sensor can benefit from the high-precision, traceability and large measuring range of the NMM-1. The conducted measurements are influenced by the metrological properties of the integrated probing system. Metrological properties, such as stability of the characteristic curves, noise level and the combined measurement uncertainty of the realised MAFM system have been analysed. The influencing variables for the calculation of the combined uncertainty in measurement have been dertermined. The combined uncertainty depends on the measuring time, fluctuation of refractive index due to change of environmental conditions, the dead path length and the NMM-1.
The investigation of the MAFM sensor in the NMM-1 for different high-precision and large-scale traceable measurement tasks have been carried out. As examples, results of step height determination are illustrated.
Nowadays, high-speed measurements are becoming more and more important. This MAFM currently acts as a passive probe system, where the scan motion and vertical motion are carried out by the NMM-1. In order to optimise the control dynamics and to increase the scan speed, this MAFM will be extended into an active probe system, where piezo actuator will be integrated to track the position (in vertical direction) of the cantilever during the measurement.
Acknowledgments
The development of this MAFM was funded by the European Metrology Programme for Innovation and Research (EMPIR) by the project 'Traceable three-dimensional nanometrology (3DNano)'.
Thanks to all colleagues at the FAU who have contributed to the presented developments.
Last but not least, the authors wish to thank the colleagues Dr G. Dai and Dr J. Flügge from Physikalisch-Technische Bundesanstalt (PTB) for their cooperation.
Data availability statement
The data that support the findings of this study are available upon reasonable request from the authors.
Author contributions
Wu leads the editing and review process and contributed data curation, formal analysis, investigation, methodology, supervision, validation, visualisation and writing of the original draft.
Wirthmann and Klöpzig have contributed to editing and review.
Hausotte has the project administration and is responsible for the conceptualisation, methodology, construction process, funding acquisition, editing and idea for the new optical setup. Additionally, Hausotte supported the editing and the review process.