
Abstract
To overcome the existing rapid capacity decay, low conductivity and the expands and contracts in volume of Si/C composite anodes in lithium ion batteries, we have developed a silicon/carbon composite by spray drying and twice organic carbon source cladding process. The samples are characterized by x-ray diffraction (XRD), scanning electron microscopy (SEM), transmission electron microscopy (TEM), Raman spectrometer, thermogravimetric analysis and x-ray photoelectron spectra (XPS). The electrochemical performance are analyzed by half-cell and full-cell experiments. The results show that the silicon/carbon composite is core–shell structure with the silicon embedded graphite as core and organic carbon layers as the shell, the particle size range from 8 μm to 24 μm. The first reversible capacity and initial coulombic efficiency of the silicon/carbon composite are 936.4 mAh g−1 and 88.6% in half-cell. The silicon/carbon composite exhibits a high capacity retention up to 80% after 680 cycles in full-cell, indicating an excellent cycling stability. The structure is beneficial to control volume expansion, improve conductivity and electrochemical performance.
Export citation and abstract BibTeX RIS

Original content from this work may be used under the terms of the Creative Commons Attribution 4.0 licence. Any further distribution of this work must maintain attribution to the author(s) and the title of the work, journal citation and DOI.
1. Introduction
In recent years, lithium-ion batteries (LIBs) have been widely used in the fields of computers, mobile phones, power batteries and energy storage due to their high energy density, high operating voltage, long life and other advantages [1–3]. However, the theoretical specific capacity of commercial graphite anode material is only 372 mAh g−1, which can't meet the requirements of LIBs for high energy density [4]. The theoretical capacity of silicon can be as high as 4200 mAh g−1, which is considered as the most promising anode material to replace or supplement graphite anode materials [5, 6]. However, the problems of poor cyclic stability, severe volume changes during the cycle and low electrical conductivity exist in silicon materials [7]. When the silicon expands in volume during the cycle, the solid electrolyte interphase (SEI) can be broken and expose surfaces that have not been passivated, which causing the electrolyte continue decomposing on the surface of silicon, so Li+ is consumed continuously, leading to the continuous decaying of battery capacity [8–10].
A lot of research and efforts have been made to overcome the weakness of silicon materials in recent years by reducing the particle size of silicon [11], preparing the hybrid structures of silicon-carbon [12], control the material morphology [13]. Recently, many efforts have been made to prepare Si/C nano-composite anodes and they improve the overall electrochemical performance of the lithium ion batteries, the composite anodes take the advantages of both carbon (good electrical conductivity, small change in volume and reasonable ability to insert lithium, etc.) and silicon (high capacity, etc.), they have shown better control of volume changes during the cycle [14, 15]. Considerable efforts have been made to prepare carbon coated graphite/silicon composites as anode materials for lithium ion batteries by using the facile spray drying method, which can quickly dry up the slurry and very easy to industrialize and the asphalt is also considered as an organic carbon source to coat on silicon, but the coating of asphalt on graphite/silicon composite only underwent fusion and heat treatment for one time, which is not conducive to obtain more uniform and dense carbon layers on graphite/silicon composite [16–18].
In this work, we have prepared the silicon/carbon composite by spray drying method and twice high-temperature heat treatment with asphalt. The spray drying process prevent the silicon from agglomerating by quickly dry up the slurry, which is also easy to achieve large-scale industrial production. The two times heat treatment with asphalt can obtain uniform and dense coating carbon layers on Si/graphite composite, which can restrain the volume expansion of silicon and improve the conductivity of silicon/carbon composite. This silicon/carbon composite now reached the pilot scale production and can easily achieve large-scale industrial production, it also has excellent electrochemical performance, simple preparation process and abundant raw materials. The obtained silicon/carbon composite is used as anode material in 18650 cylindrical lithium ion batteries, the results are reported in the following chapters.
2. Experimental
2.1. Anode material preparation
First, ball milled the ethanol solution with silicon for 4 h at 1200 r min−1 and 6 h at 850 r min−1 to get evenly dispersed slurry of nano-silicon (the mass of silicon is 7.2 Kg), then add the ethanol slurry of nano-silicon and solid graphite (9.16 Kg) into stirring pot and stirred for half an hour, the solid content was controlled at 20%. Next, spray drying of nano-silicon—graphite slurry to get material with uniform inlay of silicon into graphite, the inlet temperature is 170 °C and outlet temperature is 80 °C, the atomizer is 280 Hz. The product of spray drying was processed in fusion machine for 10 min at 850 r min−1, then mixed with asphalt (3.28 Kg) for the first time at 400 r min−1 for 30 min and granulated, then heat treated under 480 °C for 3 h and 950 °C for 2 h. The product of first heat treatment was crushed and mixed with asphalt (2.18 Kg) at 850 r min−1 for 30 min and heat treated under 480 °C for 3 h and 950 °C for 2 h again, the heating rate is 2 °C min−1. After crushing, screening and demagnetizing, the final silicon/carbon composite was prepared.
The anode material of 18650 cylindrical lithium ion batteries was prepared by mechanical mixing of the silicon/carbon composite and artificial graphite to 450 mAh g−1 and the content of silicon/carbon composite was 16%, the cathode material was NCM811 in full cell.
2.2. Characterization
X-ray diffraction (XRD) was conducted on a PANalytical X'Pert Powder using Cu Kα radiation (λ = 0.154 nm). The microscopic features of the samples was examined by field emission scanning electron microscopy (FE-SEM, SU-8010, Hitachi) and transmission electron microscopy (TEM, JEM2100F, JEOL). Thermogravimetric analysis (TGA) was carried out using the Netzsch 209 F3 Instrument at a heating rate of 10 °C min−1 from room temperature to 950 °C under air. Nitrogen adsorption and desorption isotherms were determined by nitrogen physisorption at 77 K on a Micromeritics Tristar 3020 analyzer. The surface area was calculated with Brunauer–Emmett–Teller (BET) method. Raman scattering was conducted on a Renishaw micro-Raman spectrometer (λ = 514 nm). Particle size distribution was carried out on an OMEC LS-909 Laser particle size analyzer. X-ray photoelectron spectra (XPS) was carried out by using a Thermo scientific escalab 250xi.
2.3. Electrochemical measurement
The half-cell performance of silicon/carbon composite were tested by CR2025 button batteries with lithium tablet as anode and silicon/carbon composite (with mass of silicon/carbon: SP: CMC: SBR = 1.8 g: 0.08 g: 0.04 g: 0.08 g) as cathode and assembled in a glove box filled with Ar. The electrolyte solution was 1 M LiPF6 with ethyl carbonate (EC) and diethyl carbonate (DMC) as solution.
The full-cell is 18650 cylindrical lithium ion battery with designed capacity of 2.92 Ah. The positive electrode was prepared by coating a mixture of NCM811, carbon nanotubes (CNTs), super P and polyvinylidene fluoride (PVDF) with mass of 1440 g: 7.5 g: 22.5 g: 30 g onto the aluminum foil. The negative electrode was prepared by coating a mixture of silicon/carbon composite, artificial graphite, carbon nanotubes (CNTs), super P, sodium carboxymethyl cellulose (CMC) and styrene-butadiene rubber (SBR) with mass of 240 g: 1188 g: 1.5 g: 15 g: 19.5 g: 36 g onto copper foil. Double-sided coating density of cathode and anode were 40 mg cm−2 and 19.72 mg cm−2. The compaction density of cathode and anode were 3.4 mg cm−3 and 1.6 mg cm−3. All performance of full-cell were tested on NEWARE battery testing system, the cycling performance was tested with a voltage range between 2.75 and 4.2 V at 0.5 C for charging and 1 C for discharging.
3. Results and discussion
The schematic illustration of preparation process for the silicon/carbon composite is shown in figure 1. First, ball milled the ethanol solution with micro silicon, after repeated collisions with ZrO2, the micron-sized silicon is gradually ground into nano-silicon. Then add the ethanol slurry of nano-silicon and solid graphite into stirring pot, after stirred for 30 min the whole slurry of nano-silicon and graphite is spray-dried to obtain graphite material with uniform inlay of silicon (Si/graphite). The Si/graphite then stirred in a fusion machine which can help make the material neater. Then mix the Si/graphite with asphalt in a stirring pot, after stirring, granulation, high-temperature heat treatment and crushing, the first coating product is obtained. Then the first coating product is mixed with asphalt again in a stirring pot, after stirring, high-temperature heat treatment, crushing, screening and demagnetizing, the final silicon/carbon composite is obtained. The purpose of two times high-temperature treatment with asphalt is to obtain more uniform and dense carbon layers on Si/ graphite.
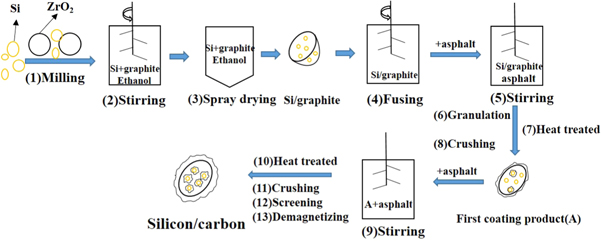
Figure 1. Synthesis process of silicon/carbon composite.
Download figure:
Standard image High-resolution imageThe surface morphology of micro silicon, nano-silicon and graphite are characterized by SEM as show in figure 1 in supporting information (available online at stacks.iop.org/NANOX/2/010021/mmedia), the median size of nano-silicon and graphite are 110 nm and 12.66 μm. The surface morphology and microscopic fine structure of the silicon/carbon composite are characterized by SEM and TEM as show in figure 2. It can be seen from figures 2(a)–(b) that the silicon/carbon has an elliptic ball structure with particle size range from 8 μm to 24 μm and the silicon is evenly distributed on the surface of the material. A thickness of about 50 nm carbon layers can been seen clearly on the surface of silicon/carbon (figure 2(c)). The high resolution TEM image in figure 2(d) clearly shows the presence of an amorphous carbon layers with about 5 nm thickness, which is coated on Si nanoparticles and the coated Si nanoparticles have a lattice distance of 3.14 Å for Si (111) [19]. It is clearly seen from the mappings in figure 2(e) and figure 2(f) that the silicon is evenly distributed on the composite. The double coating of nano-silicon and graphite by carbon layers is very beneficial to control the volume expansion of silicon during charging and discharging process and block the direct contact between silicon/carbon and electrolyte to avoid repeated growth of SEI membrane, thus the coulombic efficiency and cyclic stability of the silicon/carbon material are improved [20].

Figure 2. The SEM images (a) and (b) and TEM images (c) and (d) of silicon/carbon composite, EDX element mapping of carbon (e) and Si (f) in silicon/carbon composite.
Download figure:
Standard image High-resolution imageFigure 3(a) shows the XRD pattern of silicon/carbon composite and the raw material of silicon. In the XRD pattern of the silicon raw material, the five diffraction peaks at 28°, 47°, 56°, 69° and 76° are indexed as the (111), (220), (311), (400) and (331) crystal planes of crystalline silicon (JCPDS 27–1402), respectively [21]. After coating and high temperature treatment, the XRD pattern of the silicon/carbon maintains the characteristic peak of the silicon raw material and the five diffraction peaks at 26°, 42°, 44°, 54° and 77° are indexed as the (002), (100), (101), (004) and (110) crystal planes of graphite (JCPDS 41–1487), respectively [22].
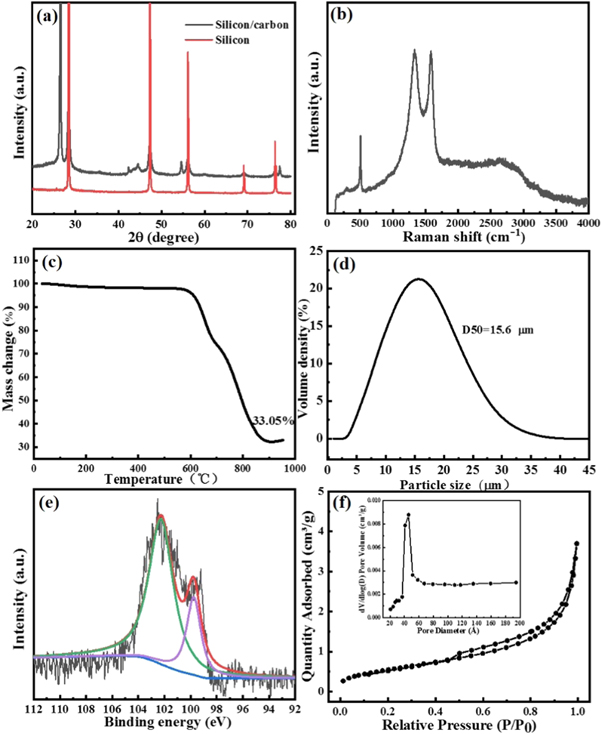
Figure 3. (a) XRD patterns of silicon/carbon composite and the raw material of silicon, (b) Raman spectra of silicon/carbon composite, (c) TG curve of silicon/carbon composite, (d) Particle size distributions of silicon/carbon composite, (e) XPS spectra of silicon/carbon composite, (f) Nitrogen adsorption-desorption isotherms and corresponding pore size distribution curves of silicon/carbon composite.
Download figure:
Standard image High-resolution imageRaman spectroscopy is further used to characterize the structure of silicon/carbon composite as show in figure 3(b). The peak at 507 cm−1 can be assignable as the characteristic band of crystalline silicon core [23]. The observation of the two peaks at 1337 cm−1 and 1586 cm−1 are assignable as the D band and G band, which represent the sp3 hybrid orbital in disorder carbon and sp2 hybrid orbital in graphitized carbon, respectively [24]. And the peak at 2653 cm−1 related to the 2D peak of graphene. The ratio (1.01) of ID/IG demonstrates that silicon/carbon has a high extent of graphitization and excellent conductivity.
Figure 3(c) shows the TG curve of silicon/carbon composite measured in air. The measured residual mass is about 33.05%, which means the content of silicon in the silicon/carbon composite. The particle size distributions of silicon/carbon composite is show in figure 3(d), illustrating that its median size is 15.6 μm and most of them distribute from 8 to 24 μm, which consistent with the above SEM results.
The Si2p XPS survey spectra of silicon/carbon composite is shown in figure 3(e). There are two peaks at 99.7 eV and 102.2 eV, which corresponding to Si-Si and Si-O bonds and the latter Si-O bonds perhaps because of the natural oxidation of silicon [25].
The nitrogen adsorption-desorption isotherm analysis is carried out to understand the pore properties of silicon/carbon composite. It can be seen from figure 3(f) that the silicon/carbon composite shows typical IV isotherm curve and its BET specific surface area is 2.06 m2 g−1 and the pore diameter distribution result (Inset in figure 3(f)) by the Barrett–Joyner–Halenda (BJH) desorption analyses shows the average pore distribution is about 5 nm, which suggesting that the carbon layers tightly coated on the nano-silicon and graphite, this helps to reduce the direct contact between the nano-silicon and electrolyte and alleviate volume expansion of silicon, thus improving the electrochemical performance of the material.
Figure 4(a) shows the initial charge-discharge curve of silicon/carbon at a current density of 100 mA g−1 with a potential range from 0.005 V to 2.0 V (versus Li/Li+) in half cell. The initial charge and discharge specific capacity of silicon/carbon are 936.4 mAh g−1 and 1056.4 mAh g−1, its initial coulombic efficiency is 88.6%. The sample exhibits a typical discharge plateau at 0.05–0.1 V and a charge plateau at 0.4 V, which corresponding to the alloying and de-alloying process of silicon with lithium [26]. The observed large irreversible capacity in the first cycle may be ascribed to the amorphous carbon on the surface of silicon/carbon which can suppress the electrolyte decomposition remarkably and contribute to the formation of the stable SEI films [20, 27, 28]. The coulombic efficiency of second cycle is nearly 100%, which indicates that a stable SEI film has been formed on the surface of silicon/carbon composite. The content of silicon in the silicon/carbon composite is 33.05%, so the gravimetric capacity of silicon alone is as high as 2100 mAh g−1.

Figure 4. (a) charge-discharge curves of silicon/carbon at a current density of 100 mA g−1 in half-cell, (b) electrochemical cycling performance of the silicon/carbon composite in full-cell, (c) the Nyquist plots and (d) equivalent circuit model in half-cell.
Download figure:
Standard image High-resolution imageThe specific capacity and retention plot and cyclic voltammetry curves are shown in figure 2 in supporting information. The specific capacity retention of silicon/carbon composite was tested by CR2025 button batteries with lithium tablet as anode and silicon/carbon composite as cathode, the specific capacity keeps 97.37% after 90 cycles (0.2 C), indicating a good specific capacity retention rate. Figure 2(b) in supporting information shows the initial three cyclic voltammetry curves of the silicon/carbon composite electrode in the potential range of 0.01 to 1.6 V at a scan rate of 0.1 mV s−1. During the first CV curve, no obvious reduction peak is appeared. This because the silicon particle is well encapsulated by the carbon layers, so the electrolyte cannot be decomposed on the surface of the silicon. With the increase of cycle numbers, the peak value gradually increases due to the gradual activation of the silicon/carbon composite. The peak around 0.14 V appeared from the third cycle can be attributed to the lithiation of amorphous silicon. The peak at 0.31 V and a weak peak at 0.51 V are shown in the anodic scan, which corresponding to the phase transformation from LixSi to amorphous silicon [25, 29].
Figure 4(b) shows the electrochemical cycling performance of the silicon/carbon composite at a voltage window of 2.75–4.2 V, the current density is 0.5 C for charging and 1 C for discharging and the initial discharge capacity and coulombic efficiency are 2.858 Ah and 84.2% in full-cell. The silicon/carbon shows a little fast capacity decay after 500 cycles and finally keep a capacity retention of 80% after 680 cycles. Such excellent electrochemical cycling performance mainly attributed to the uniform coating of carbon layers on graphite and nano-silicon, which can help maintain stable solid electrolyte interphase (SEI) and prevent the nano-Si from agglomerating and expanding [20].
The Nyquist plots of Si and silicon/carbon composite after cycling for 24 h is carried out with frequency range from 10–2 to105 as shown in figure 4(c), the equivalent electrical circuit model as shown in figure 4(d) is used to fit the Nyquist plots, in which Rs represents electrolyte resistance, Rct is charge transfer resistance at the electrolyte and electrode interface, CPE and W represent surface film capacitance and Warburg impedance, the corresponding impedance parameters are shown in table 1. The semicircle in the high and intermediate frequency is associated with charge transfer resistance [30], the inclined line represents Warburg impedance owing to the ion transport process [31]. It is seen that the silicon/carbon composite has a much smaller semicircle diameter than the pure Si, indicating the lower resistance values in silicon/carbon composite, probably because the presence of carbon layers has high electrical conductivity and decreases the electrode resistance [32].
Table 1. The impedance parameters of Si and silicon/carbon after 24 h cycles.
| Resistance | Si | Silicon/carbon |
|---|---|---|
| Rs (Ω) | 6.7 | 0.9 |
| Rct (Ω) | 49.9 | 3.2*10–14 |
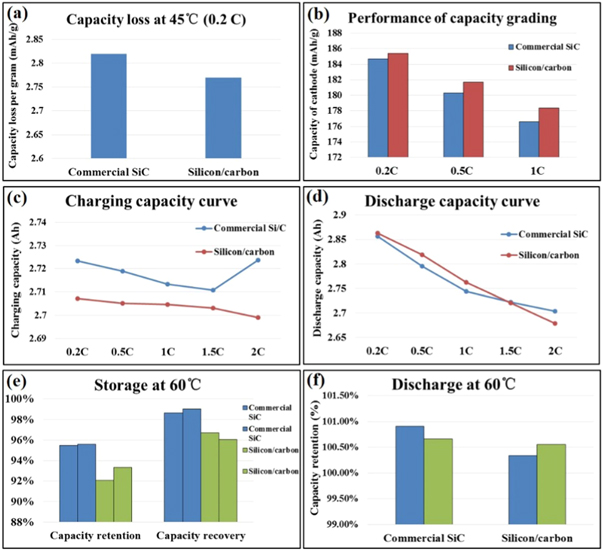
After first cycle test, the batteries are stored at 45 °C for 48 h to allow the electrolyte to be fully saturated and speed up some of the side effects, so the electrochemical performance of lithium batteries can be stabilized quickly, then capacity grading test is proceeded at 0.2 C, 0.5 C and 1 C. As show in figure 5(a), the capacity loss of silicon/carbon composite after stored at 45 °C for 48 h is almost the same with commercial Si/C, indicating a stable battery system. The capacity grading performance at 0.2 C, 0.5 C and 1 C of silicon/carbon composite is better than commercial Si/C as show in figure 5(b).
Figure 5. (a) capacity loss and (b) capacity grading performance of silicon/carbon composite after stored at 45 °C in full-cell, (c) charge rate performance and (d) discharge rate performance of silicon/carbon composite and commercial Si/C in full-cell, (e) storage performance and (f) discharge performance of silicon/carbon composite at 60 °C in full-cell.
Download figure:
Standard image High-resolution image
Figures 5(c)–(d) show the rate performance of the silicon/carbon composite at different current densities. The charge rate performance is slightly worse than commercial Si/C, but it has better discharge rate performance at low rate. The (2 C/1 C) rate performance of silicon/carbon for charging and discharging are above 100% and 97%, respectively, indicating a high capacity retention at different current density of silicon/carbon composite.
The storage and discharge performance of silicon/carbon composite at 60 °C are further studied and the results showed in figures 5(e)–(f). After storage at 60 °C for seven days, the capacity retention and recovery of silicon/carbon are above 92% and 96%, respectively. Its discharge performance at 60 °C is higher than 100.34%, which is comparable to commercial Si/C, indicating excellent high temperature storage and discharge performance of silicon/carbon composite.
4. Conclusions
In summary, a silicon/carbon composite material as anode material in lithium ion batteries has been designed through spray drying method and twice high-temperature heat treatment with asphalt. In this structure, silicon is uniformly embedded in graphite and the surface of both silicon and graphite are coated with carbon layers. The spray drying process prevent the silicon from agglomerating, while the carbon layers can restrain the volume expansion of silicon and improve the conductivity of silicon/carbon composite, also the direct contact between silicon and electrolyte is blocked to avoid repeated growth of SEI membrane, so the electrochemical performance of silicon/carbon composite is effectively improved. As a consequence, the first reversible capacity and initial coulombic efficiency of the silicon/carbon composite are 936.4 mAh g−1 and 88.6% in half-cell and the full-cell 18650 cylindrical battery using our silicon/carbon composite as anode exhibits a high capacity retention up to 80% after 680 cycles , indicating an excellent cycling stability. Meanwhile, the storage and discharge performance at 60 °C and rate performance of silicon/carbon composite are also comparable to commercial Si/C. Therefore, the preparation strategy of the silicon/carbon composite is of great significance for the development of anode composite materials and the industrialization of next generation silicon-carbon materials.
Data availability statement
All data that support the findings of this study are included within the article (and any supplementary files).