

Abstract
Electrical contact resistance (ECR) measurements performed via conductive atomic force microscopy (C-AFM) suffer from poor reliability and reproducibility. These issues are due to a number of factors, including sample roughness, contamination via adsorbates, changes in environmental conditions such as humidity and temperature, as well as deformation of the tip apex caused by contact pressures and/or Joule heating. Consequently, ECR may vary dramatically from measurement to measurement even on a single sample tested with the same instrument. Here we present an approach aimed at improving the reliability of such measurements by addressing multiple sources of variability. In particular, we perform current-voltage spectroscopy on atomically flat terraces of highly oriented pyrolytic graphite (HOPG) under an inert nitrogen atmosphere and at controlled temperatures. The sample is annealed before the measurements to desorb adsorbates, and conductive diamond tips are used to limit tip apex deformation. These precautions lead to measured ECR values that follow a Gaussian distribution with significantly smaller standard deviation than those obtained under conventional measurement conditions. The key factor leading to this improvement is identified as the switch from ambient conditions to a dry nitrogen atmosphere. Despite these improvements, spontaneous changes in ECR are observed during measurements performed over several minutes. However, it is shown that such variations can be suppressed by applying a higher normal load.
Export citation and abstract BibTeX RIS
1. Introduction
Atomic force microscopy (AFM) is a powerful tool that provides researchers with the ability to conduct a wide variety of surface characterization studies at the nanometer scale and below [1]. Among the various modes of AFM, conductive atomic force microscopy (C-AFM) is particularly useful due to its capability of simultaneously measuring the topography and electrical properties of a sample surface with high spatial resolution. Specifically, C-AFM can be utilized to record maps of current (or resistance) on a sample surface under application of a constant bias voltage [2–5] as well as to perform current (I) versus voltage (V) spectroscopy to extract information about the electronic properties of the sample system under investigation [6–11].
The main advantage of utilizing C-AFM to study the electrical properties of surfaces (including but not limited to electrical contact resistance (ECR)) lies in the fact that the AFM tip inherently forms a 'single asperity' contact with the sample surface [12], eliminating the main difficulty associated with interpreting results obtained through micro- and macroscopic probes that ultimately result in multiple asperity contacts, the properties of which (such as the number of asperities in contact, as well as their shape, size, etc) are not known a priori. Considering the important role that electrical properties such as ECR play in small-scale electrical as well as electro-mechanical systems [13–15], the information obtained via C-AFM has the potential to provide crucial input for the effective design of such devices. On a more fundamental level, the simplified single asperity contact geometry facilitated by the AFM tip allows detailed studies of electron conduction on the nanometer scale that could lead to new physical insights.
Despite the significant potential of C-AFM as described above, the method has suffered from reliability and reproducibility issues since its first utilization in the 1990s [16, 17]. This is mainly due to the fact that the resistance to electron conduction at the nanoscale tip-sample junction is highly susceptible to changes in chemistry as well as surface structure. Such changes can be induced by varying environmental conditions, including temperature and humidity, and facilitated by the chemical reactivity of the tip and sample materials as well as their mechanical characteristics. A quantitative evaluation of some factors leading to sizeable variances in C-AFM measurements was presented earlier [18], and results demonstrated that ECR could vary by at least an order of magnitude in a single experimental run.
Attempts have been made to improve the reliability and reproducibility of C-AFM measurements by changing the tip material. While metallic or metal-coated tips typically used for C-AFM (e.g. Pt, Pt/Ir and Ti/Ir tips) have the desirable property of low resistivity, they suffer from wear and are susceptible to oxide formation which leads to inaccuracies in the measurement of surface electrical properties [19]. On the other hand, while conductive diamond tips are highly wear resistant, hard to deform and do not form oxide layers under ambient conditions, they have significantly higher resistivities and larger radii of curvature than metallic and metal-coated tips, leading to a reduction in current and spatial resolution. The topographical roughness of the sample itself also affects the reproducibility of C-AFM measurements: during repeated measurements on a rough sample, the AFM tip may land on areas of different local roughness, which would consequently lead to differences in effective contact area and thus, ECR. Finally, environmental conditions influence the reliability of ECR measurements to a great extent. Under uncontrolled ambient conditions, oxidation of the tip and sample, the presence of adsorbates, and changes in humidity and temperature can lead to a very high standard deviation in measured ECR values [18]. These issues can be overcome by performing experiments under ultra-high vacuum (UHV) conditions, but metallic tips wear easily in UHV due to the lack of a lubrication layer formed by adsorbates [20].
Motivated as above, in the present study we aim to improve the reliability and reproducibility of ECR measurements via C-AFM by addressing multiple sources of variability. Specifically, we perform ECR measurements on atomically flat terraces of highly oriented pyrolytic graphite (HOPG) via I-V spectroscopy using conductive diamond tips under an inert nitrogen (N2) environment and at closely controlled temperatures. The atomically flat HOPG surface eliminates the impact of sample roughness variations on measured ECR values. The use of diamond tips minimizes complexities related to tip wear and deformation. Before starting measurements, the HOPG sample is annealed under N2 to desorb contaminants. The ECR measurements performed in this fashion exhibit significantly lower standard deviation than those obtained using conventional measurement conditions. Finally, even under ideal conditions, we observe spontaneous changes in ECR values during measurements extending over several minutes. However, application of a higher normal load is shown to be one way to suppress these changes. Overall, the approach reported here constitutes a well-defined route towards more reliable and reproducible C-AFM measurements.
2. Materials and methods
The improved C-AFM measurements were performed on ZYB-quality HOPG samples (Ted Pella) that were cleaved using the Scotch Tape method under ambient conditions and immediately inserted into the controlled environment of the sample chamber in a commercial AFM (Asylum Research, Cypher VRS). A constant flow of dry N2 gas through the sample chamber was maintained overnight to purge ambient gases and achieve an inert N2 atmosphere. Under the N2 environment, the HOPG sample was heated at 100 °C for 60 min to desorb adsorbates from the sample surface. The degassed HOPG sample was then allowed to cool to a temperature of 38 °C, which was maintained stable (± 0.1 °C) throughout the experiments with a built-in sample heater via PID control.
In this stable environment, relatively small areas (40 nm × 40 nm) on the HOPG surface were scanned in contact mode using either Pt tips (HQ:NSC18/Pt, μmasch) or conductive diamond tips (CDT-CONTR, Nanosensors), on an atomically flat terrace without step edges in close proximity. A schematic of the C-AFM set-up along with a representative topography map are shown in figure 1. The representative area presented in figure 1 is atomically flat, with a root-mean-square (RMS) roughness of ∼0.5 Å, thus eliminating the effect of sample roughness variations on the reproducibility of measurements. To extract ECR values, consecutive I-V spectroscopy measurements (in a 'vertical' C-AFM setup [11]) were performed on such regions of the HOPG sample over varying periods of time (from a few minutes to a few hours). ECR values were extracted from the slope of the linear region of each I-V spectroscopy curve with an applied bias voltage ranging from −100 to 100 mV. The majority of experiments were performed with no normal load other than the adhesion force, which was found to be, via force-distance spectroscopy, in the range of 20 to 30 nN for conductive diamond tips and around 10 nN for Pt tips. The surface was imaged before and after force-distance spectroscopy experiments to verify that there was no damage to the HOPG substrate.

Figure 1. Schematic of our C-AFM set-up, with a topography map of a 40 nm × 40 nm area on an atomically flat HOPG terrace recorded by a conductive diamond tip in contact mode. The RMS roughness of the scanned area is ∼0.5 Å.
Download figure:
Standard image High-resolution image3. Results and discussion
3.1. Comparison between conventional and improved ECR measurements
To determine the extent to which the precautions discussed above (the use of wear-resistant and mechanically strong conductive diamond tips, suppressing fluctuations in environmental humidity and temperature, as well as degassing the sample before the measurements) have improved the reliability and reproducibility of C-AFM-based ECR measurements, we performed comparative experiments, the results of which are summarized in figure 2.
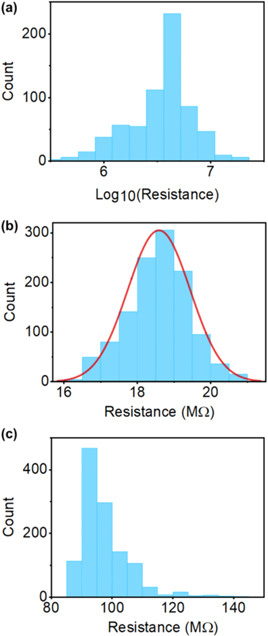
Figure 2. Comparison of histograms of ECR values obtained from I-V spectroscopy curves recorded under different conditions: (a) Pt tip under ambient conditions with no control over humidity and temperature, (b) conductive diamond tip under dry N2 atmosphere at a controlled temperature of 38 °C, with sample degassing performed prior to the experiments (the solid red line is a Gaussian fit), and (c) Pt tip under dry N2 atmosphere with no control over temperature and no sample degassing. Comparison of (a) and (c) shows that the switch to the dry N2 environment plays a vital role in reducing the variability of measured ECR values. No normal load other than the adhesion force acted between the tip and the sample in all measurements shown here.
Download figure:
Standard image High-resolution imageIn particular, figure 2(a) is a histogram of the measured data that demonstrates the spread of ECR values measured on a single location on a flat HOPG terrace under ordinary laboratory conditions (i.e. with no control over humidity and temperature) over a span of 70 min using a Pt tip. As one can clearly observe from the presented data, ECR values recorded in this fashion (extracted from 1157 individual I-V curves) vary dramatically, over more than an order of magnitude, reminiscent of the results presented by Engelkes et al in their detailed study of ECR variations [18]. In addition to the variance in the recorded ECR values, the absolute values (with a mean ECR of 2.45 MΩ and a standard deviation of 2.95 MΩ) are significantly higher than what would be expected from a nanoscopic contact formed between a platinum tip and HOPG (which is on the order of a few kΩ to tens of kΩ [21]), pointing towards the potential presence of contaminant layers on the probe and/or the sample [22–25].
In contrast to figure 2(a), figure 2(b) presents results (extracted from 1200 individual I-V curves recorded over 70 min) that were obtained by taking all the precautions described in section 2, i.e. with a conductive diamond tip, under an N2 atmosphere and a controlled temperature of 38 °C, with degassing of the HOPG sample performed prior to the I-V spectroscopy experiments. The data obtained in this fashion are in striking contrast to those presented in figure 2(a): ECR values now exhibit a much narrower distribution that can be fit reasonably well with a Gaussian, with a mean of 18.6 MΩ and a standard deviation of only 0.90 MΩ. While the absolute values of the ECR are higher than those obtained via the Pt tip, this can be tentatively attributed to the fact that the resistivity of the conductive diamond is expected to be at least two orders of magnitude higher than the resistivity of platinum [26, 27].
While it is obvious from the comparison of the data in figures 2(a) and (b) that the combined measures of using a hard and wear-resistant tip material and controlling environmental factors have led to a dramatic improvement in reliability and reproducibility, it is not possible to determine which precaution had the most significant impact on the improvement of the data. To address this question, we repeated our C-AFM-based ECR measurements with the Pt tip one more time, but now under an inert N2 atmosphere, albeit with no control of temperature or sample degassing (figure 2(c)). The data (extracted from 1200 individual I-V curves recorded over 70 min) now exhibit a significantly more narrow distribution (with a mean of 98.0 MΩ and a standard deviation of 12.6 MΩ) than what was achieved under ambient conditions in figure 2(a).
Despite the fact that the variability in ECR measurements observed via the use of Pt tips under the dry N2 atmosphere (figure 2(c)) is still appreciably higher than what is achievable with the conductive diamond tips (figure 2(b)), the drastic improvement after the switch from ambient conditions to N2 highlights the major impact that environmental conditions and, in particular, changes in humidity can have on C-AFM-based ECR measurements. On the other hand, at first glance it may be surprising that the mean ECR measured with the Pt tip (98.0 MΩ) is higher than the ECR measured with the conductive diamond tip (18.6 MΩ). This difference, however, can be explained by the fact that (i) a degassing procedure was not used for the measurement with the Pt tip and (ii) the measurements were not taken at the same location on the same terrace and different HOPG terraces can exhibit significantly different conductivities [2].
While experiments reporting on the variability of C-AFM-based ECR measurements and the underlying mechanisms are quite rare in the literature [18, 28, 29], it is still possible to consider our results within the context of these studies. In particular, for C-AFM measurements performed on decanethiol-coated gold substrates, it was reported that the resistance values obtained in a single experimental run with a given AFM tip varied up to three orders of magnitude, depending on the topographical roughness of the gold substrate employed in the experiments [18]. Moreover, switching from measurements in air to those performed under cyclohexane (analogous to the switch from ambient conditions to the dry N2 atmosphere in our experiments) minimized the issues associated with uncontrolled changes in humidity, leading to a drastic decrease in standard deviation [18]. Another study focusing on a similar material system (self-assembled monolayers of azobenzene thiol molecules on gold) reported results along the same lines, with resistance values varying over more than an order of magnitude [29]. Finally, C-AFM measurements on a granular gold film resulted in resistance values that varied over two orders of magnitude, and the authors attributed the large variability in the results to atomic re-arrangements and mechanical instabilities at the tip-sample junction [28]. The ECR distributions achieved via our improved methodology (see e.g. Figure 2(b)) are significantly more narrow than those reported in the discussed experiments [18, 28, 29], possibly due to the combined use of mechanically strong AFM tips and strictly controlled environmental conditions.
3.2. Spontaneous changes in ECR measurements
Despite the improvements in reliability reported in section 3.1, we have observed that at least one source of variability remains. In particular, when measurements are continuously performed for durations of a few minutes and longer (with all the precautions described earlier), spontaneous (i.e. sudden) changes in ECR can be observed. Figure 3 presents two experimental runs (performed with conductive diamond tips for ∼30 min and ∼15 min after contact has been established between tip and sample) that comprise spontaneous jumps to different 'branches' of ECR as highlighted by the red arrows. Specifically, in figure 3(a), after an initial gradual drop, the ECR spontaneously jumps to a lower branch, stays stable for about 2 min and then jumps back to the value before the spontaneous drop. The ECR then remains fairly stable for about 12 min, which is then followed by another spontaneous drop. In the second experimental run presented in figure 3(b), there is no initial drop, but the data shows a prominent downward jump in ECR at the ∼3 min mark, followed by a stable region for about 9 min and then another downward jump of smaller magnitude.
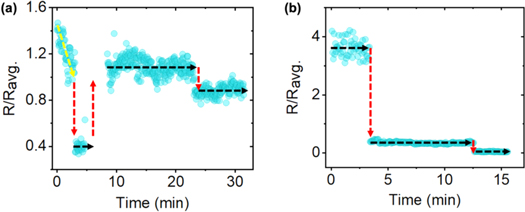
Figure 3. Two experimental runs showing the variation of ECR over (a) ∼30 min and (b) ∼15 min after contact has been established between tip and sample. The time between two consecutive data points is 3.6 s. The dashed arrows guide the eyes through the initial drop (yellow), followed by spontaneous jumps between different ECR 'branches' (red) and periods of nearly constant ECR (black). The gap in data around the 6 min mark in (a) is due to unstable I-V curves recorded after the spontaneous jump from which ECR values could not be extracted.
Download figure:
Standard image High-resolution imageWhile the initial gradual drop in resistance in figure 3(a) can be tentatively explained by creep [30], the spontaneous jumps in figures 3(a) and (b) appear to be of a different character. During C-AFM measurements, the tip-sample junction is subject to the combined effects of electrically-, thermally-, and mechanically-induced stresses [31]. While, the flow of current through the constricted tip-sample junction leads to Joule heating [32] and consequently thermal stresses, the junction also undergoes electrical stress due to the repeated, cyclic application of bias voltage over an extended period of time to perform I-V spectroscopy [33], in addition to mechanically-induced stresses though the action of adhesive forces acting between the tip and the sample. The potential influence of piezo creep on the contact should also not be ignored. A mechanism that may explain a sudden drop in ECR is the spontaneous breakdown of an insulating contaminant layer [20]. On the other hand, the rapid increase to higher ECR values cannot be explained through a similar mechanism. As such, an alternative explanation that involves spontaneous changes in the atomic-scale structure of the AFM tip apex, perhaps by the re-positioning of a cluster of atoms near the contact in a metastable configuration [34], can result in the experimentally observed jumps between different ECR branches. Support from atomic-scale simulations will be needed to gain more insight into the underlying physical mechanisms.
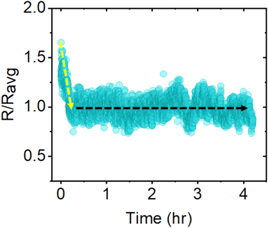
Regardless of the underlying mechanisms, in order to explore whether the occurrence of spontaneous jumps in ECR can be minimized through experimental means, we recorded a ∼4-hr-long run with a conductive diamond tip in which I-V curves were continuously recorded under an applied normal load of 30 nN, which is on the same order as the typical adhesion force measured between diamond and HOPG. While the results, presented in figure 4, still exhibit an initial gradual drop in ECR, no spontaneous jumps in ECR are recorded subsequently, demonstrating that sudden changes in ECR can be suppressed through the application of normal load at the tip-sample junction. A potential physical mechanism could involve a deepening of potential energy minima for atomic clusters at the tip apex with increasing normal load [35], making it harder for the clusters to jump between different spatial configurations at the apex. The confirmation of this hypothesis would again require input from atomic-scale simulations.
Figure 4. Variation of ECR over ∼4 h after contact has been established between tip and sample, under an applied normal load of 30 nN. The time difference between two consecutive data points is 3.6 s. After the initial drop (yellow), the absence of spontaneous jumps between different ECR 'branches' over several hours (black) is noticeable.
Download figure:
Standard image High-resolution image
4. Conclusions
An improved approach to C-AFM-based ECR measurements was presented. The method minimizes the impacts of sample surface roughness, tip deformation and wear, sample contamination, as well as fluctuations in humidity and temperature on the acquired data. The ECR values measured using our approach exhibit a fairly Gaussian distribution with much lower standard deviation than those obtained under conventional measurement conditions. We have identified the key factor leading to improved data acquisition as the switch from ambient conditions to a dry N2 atmosphere. Despite the precautions taken, we still observe spontaneous changes in ECR values over time. While support from atomic-scale simulations is needed to understand the details of the physical mechanisms underlying these changes, it is found that the application of normal load suppresses their occurrence. Overall, the approach reported here represents a significant step towards increasing the reliability and reproducibility of C-AFM measurements.
Acknowledgments
This work was supported by the Air Force Office of Scientific Research (AFOSR) Award No. FA9550-19-1-0035.
Data availability statement
The data that support the findings of this study are available upon request from the authors.