
Abstract
In this work, two different methods (sol-gel and biosynthesis) were adopted for the synthesis of zinc oxide (ZnO) nanoparticles. The leaf extract of Azadirachta Indica (Neem) was utilized in the biosynthesis scheme. Structural, antibacterial, photocatalytic and optical performances of the two variants were analyzed. Both variants demonstrated a wurtzite hexagonal structure. The biosynthesized variant (25.97 nm) exhibited smaller particles than that of the sol-gel variant (33.20 nm). The morphological analysis revealed that most of the particles of the sol-gel variant remained within the range of 15 nm to 68 nm while for the biosynthesized variant the range was 10–70 nm. The antibacterial assessment was redacted by using the agar well diffusion method in which the bacteria medium was Escherichia coli O157: H7. The zone of inhibition of bacterial growth was higher in the biosynthesized variant (14.5 mm). The photocatalytic performances of the nanoparticles were determined through the degradation of methylene blue dye in which the biosynthesized variant provided better performance. The electron spin resonance (EPR) analysis revealed that the free OH · radicals were the primary active species for this degradation phenomenon. The absorption band of the sol-gel and biosynthesized variants were 363 nm and 356 nm respectively. The optical band gap energy of the biosynthesized variant (3.25 eV) was slightly higher than that of the sol-gel variant (3.23 eV). Nevertheless, the improved antibacterial and photocatalytic responses of the biosynthesized variants were obtained due to the higher rate of stabilization mechanism of the nanoparticles by the organic chemicals (terpenoids) present in the Neem leaf extract.
Export citation and abstract BibTeX RIS

Original content from this work may be used under the terms of the Creative Commons Attribution 4.0 licence. Any further distribution of this work must maintain attribution to the author(s) and the title of the work, journal citation and DOI.
1. Introduction
As a rapidly growing sector in materials science, nanotechnology and nanoscience deal with materials that have particles within a size range of 1 to 100 nm and a high surface-to-volume ratio [1]. In general form, these particles are termed as nanoparticles (NPs) which exhibit highly controllable physical, chemical and biological properties in the atomic and sub-atomic levels. However, these unique features create opportunities to use them in different sectors such as electronics, optoelectronics, agriculture, communications, and biomedicine [2, 3].
Although, several NPs are showing their effectiveness in different sectors of technology, but zinc oxide (ZnO) NPs have gained much more importance in the recent years due to their attractive and outstanding properties such as high chemical stability, high photostability, high electrochemical coupling coefficient and a wide range of radiation absorption [4]. Again, ZnO NPs are also recognized as n-type multi-functional semiconductor materials that have a wide band gap of 3.37 eV and exciton binding energy up to 60 meV even at room temperature [1]. Nowadays, ZnO NPs are predominantly used as antimicrobial agents, delivering systems vaccines and anti-cancer systems, photocatalyst, biosensors, energy generators and bio-imaging materials [5–7]. Among themselves, the photocatalytic application of ZnO NPs is significant. However, the photocatalytic performance of ZnO NPs can be significantly enhanced by adopting two ways. The first one involves the reduction of particle sizes by using efficient synthesis methods, while the second one involves the change of structural morphology by the incorporation of several elements (such as metal, non-metal, noble metal, transition metal, etc) into the crystal structure of ZnO NPs. However, in this work, we will proceed by adopting the first one.
Several fabrication techniques are used to produce ZnO NPs such as thermal hydrolysis techniques, hydrothermal processing, sol-gel method, vapor condensation method, spray pyrolysis and thermochemical techniques [8]. Nevertheless, recently a new synthesis method has been introduced and that is called biosynthesis scheme in which the NPs are prepared by using biological materials having significant reducing and stabilizing features. Moreover, NPs with variable size and shape can be achieved through this process.
Researchers proposed several possible plant extracts and fungal biomasses that were used in the green synthesis of ZnO NPs such as Aloe Barbadensis Miller (Aloe Vera) leaf extract [9], Poncirus trifoliate leaf extract [10], Parthenium hysterophorus L. (Carrot grass) leaf extract [11], Aspergillus aeneus [12], Calotropis procera latex [13], Sedum alfredii Hance [14], Physalis alkekengi L. [15], etc. However, the smaller particle size of ZnO NPs was observed by using Poncirus trifoliate leaf extract (8.48–32.51 nm), while for others, the results were satisfactory. In addition, another potential element for the preparation of ZnO NPs through the biosynthesis method is considered to be a leaf extract of Azadirachta indica (Neem leaf). The leaf extract contains highly active phytochemicals and enzymes that participate in the oxidation or reduction reactions that occur during the fabrication method and manipulate the bulk ZnO to convert into ZnO NPs [16]. Moreover, Neem leaf provides significant biological restrictions against bacterial growth and fungal growth [17].
The present study focused on the preparation of ZnO NPs by two different methods. The first one is the sol-gel method, while the second one is the biosynthesis method in which the Neem leaf extract was used as a mandatory element. A comparison of the properties (structural, antibacterial, photocatalytic and optical) between the two variants of ZnO NPs was performed. Here, the sol-gel synthesized and biosynthesized ZnO nanoparticles were nominated as ZnO A NPs and ZnO B NPs respectively.
2. Methodology
2.1. Materials
All the starting raw materials including zinc acetate dihydrate [Zn(CH3COO)2.2H2O, Merck Specialties, India], sodium hydroxide [NaOH, Merck Specialties, India] and absolute ethanol [CH3CH2OH, Merck Specialties, Germany) were maintained at a high purity level (>99%). However, in the biosynthesis method, another raw material was also used and that was the leaf of Azadirachta indica (Neem leaf).
2.2. Synthesis of ZnO nanoparticles (ZnO A NPs) by sol-gel method
At first, 20 gm Zn(CH3COO)2.2H2O was mixed into 150 ml distilled water and stirred for 20 min at 35 °C to produce a zinc acetate solution. Again, 80 gm NaOH powder was weighed, mixed into 80 ml water and stirred for around 20 min at 35 °C for producing NaOH solution. After mixing both solutions, the titration reaction was performed by the addition of 100 ml ethanol into the drop-wise manner accompanied by vigorous stirring. The stirring was continued for around 90 min to complete the reaction for obtaining a gel-like product. Then the gel was dried at 80 °C overnight and calcined in an oven at 250 °C for 4 h. Finally, ZnO nanoparticles were prepared. However, the overall chemical reaction for the preparation of ZnO nanoparticles by using NaOH can be expressed as:

2.3. Synthesis of ZnO nanoparticles (ZnO B NPs) by biosynthesis method
At first, the neem (A. Indica) leaves were collected from the Azadirachta Indica trees on the campus of Rajshahi University of Engineering and Technology, Bangladesh. After washing with distilled water, the leaves were dried into a dryer for 24 h. Then 20 gm dried leaves were smashed and mixed with 50 ml distilled water. After that, the mixture was stirred by a magnetic stirrer and heated at 60 °C for 1 h. As the mixture displayed a yellow color, it was filtered using the WhatmanTM filter paper. However, the extract solution was used for further preparation of ZnO nanoparticles. The overall process for the preparation of Neem leaf extract is stereotyped in figure 1.
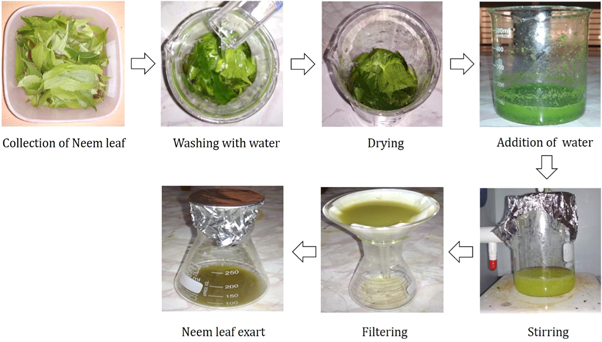
Figure 1. Process flow diagram for the preparation of Neem leaf extract.
Download figure:
Standard image High-resolution imageThe next step included the preparation of the zinc acetate solution. For this, 21.94 gm Zn(CH3COO)2.2H2O was mixed into 50 ml water and stirred for 20 min at 35 °C. Similarly, in order to prepare a NaOH solution, 4 gm NaOH powder was added into 50 ml distilled water and simultaneously stirred for 20 min at 35 °C. Both solutions were then mixed by vigorous stirring. During this stirring process, the neem leaf extract was drop-wise mixed with the solution. As the addition of neem leaf continued, white precipitation of nanoparticles appeared. Then the solution was filtered and the filtered product was dried at 80 °C for 4 h. After that, the dried powder was calcined at 250 °C for 4 h and grounded to obtain the desired ZnO nanoparticles.
2.4. Characterization of ZnO NPs
X-ray diffraction was performed for structural analysis employing 40 kV-40 ma (scanning step of 0.02°) and Cu- Kα radiation having wavelengths of Kα1 = 1.54060 Å, Kα2 = 1.54439 Å (Bruker Advance D8, Germany). Morphological characterization was accomplished by scanning electron microscopy (ZEISS EVO 18, UK). The optical properties were determined through UV–vis spectroscopy (SHIMADZU UV/Vis-1650 PC, Japan) into a range of 200–800 nm.
2.5. Antibacterial analysis of ZnO NPs
Escherichia coli bacteria were mainly involved in the determination of the antibacterial performance of ZnO NPs. Initially, the bacteria was stock-cultured in brain heart infusion (BHI) growth medium at −20 °C. Around 3 ml of BHI broth was added to 300 ml of stock-culture and preserved the culture overnight at 36 °C ± 1 °C for 24 h. After 24 h of incubation, dilution of the bacterial suspension (inoculum) was accomplished by using sterile saline. To indicate the bacterial growth during the test, a solution of 2-(4-iodophenyl)−3-(4-nitrophenyl)−5-phenyltetrazolium chloride (INT) in ethanol was added to the bacterial inoculum. Then the inoculum was distributed on a Mueller Hinton Agar Petri Dish in a consistent manner. After that, ZnO A NPs and ZnO B NPs were placed into the wells (prepared by cutting the agar gel) and the systems were preserved at 36 °C ± 1 °C for 24 h to allow successive incubation. After 24 h, the growth of bacteria was monitored and finally, the zone of inhibition for bacterial growth was determined in mm scale.
2.6. Photocatalytic analysis of ZnO NPs
The photocatalytic analysis was performed by monitoring the degradation of Methylene Blue (MB) dye due to ZnO NPs under the influence of UV radiation (having intensity ∼120 μW cm−2 and wavelength ∼300–400 nm). At first, 5 gm NPs were added into MB solution and mixed properly. The mixture was placed in the dark for 2 h and then irradiated with UV rays with subsequent stirring action and at a variation of time (0, 40, 80, 120, 160, 200 min). The absorbance of the mixture was measured by UV–vis spectroscopy (SHIMADZU UV/Vis-1650 PC, Japan). The efficiency of photodegradation was measured by the following equation:

Where C0 is the absorption of MB solution before the addition of ZnO NPs and C1 is the absorption of the mixture solution with respect to time t.
ESR (electron spin resonance) analysis was performed using the EPR spectrometer (Bruker EMX MicroX, Germany) for the identification of the major factor that provides effective photocatalytic performance. During this characterization, DMPO (5,5-dimethyl-1-pyrroline-N-oxide) was used as a spin-trapped reagent in methanol and aqueous state. Moreover, the analysis was performed both in the presence and absence of light irradiation.
3. Results and discussion
3.1. Effect analysis of Neem leaf extract
Neem leaf extract contains various phytochemicals such as flavones, quinines, organic acids, aldehyde and ketones which act as reducing agents and significantly reduces the particle sizes. After the successive reduction of particle sizes, the NPs are also affected by the terpenoids. Because of the interaction between the terpenoids and the ZnO NPs become stabilized as terpenoids are effective capping and stabilizing agents. The corresponding mechanism is graphically abstracted into figure 2. Moreover, the possible seven types of terpenoids that are present in Neem leaf extract are stereotyped in figure 3.
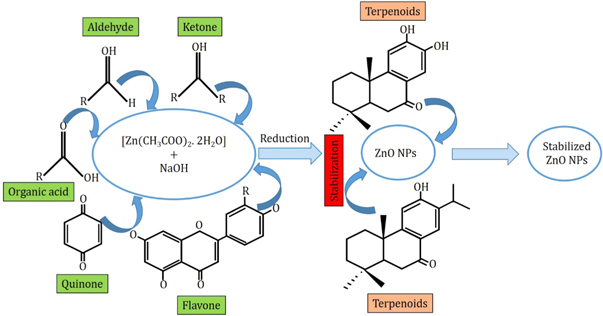
Figure 2. Schematic representation of the mechanism of size reduction and stabilization of ZnO NPs during the biosynthesis fabrication scheme using Neem leaf extract.
Download figure:
Standard image High-resolution image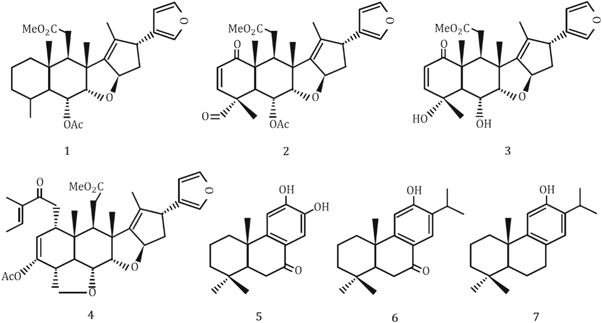
Figure 3. Chemical structures of different types of terpenoids subsisting in the Neem leaf extract.
Download figure:
Standard image High-resolution image3.2. X-ray diffraction analysis
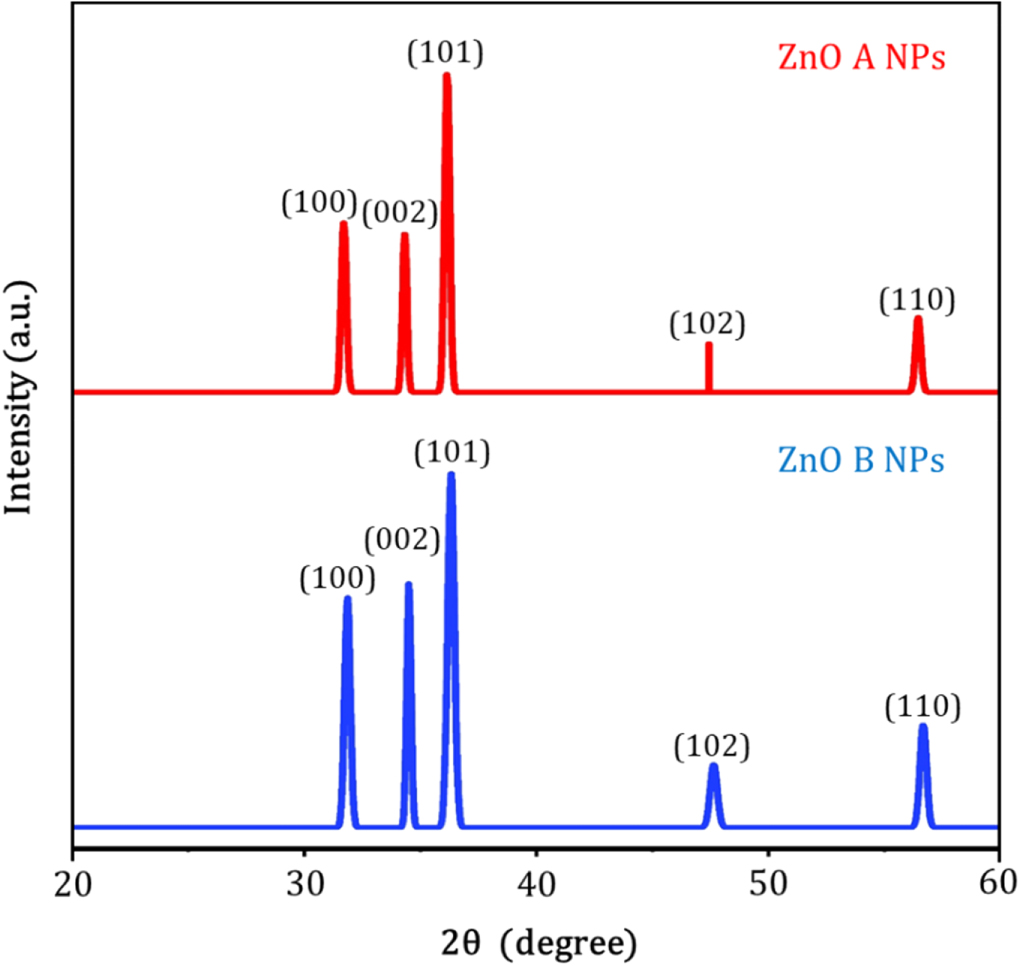
Figure 4 represents the corresponding X-ray diffraction patterns of ZnO nanoparticles synthesized by sol-gel and bio-synthesis schemes respectively. The intense peaks at the crystal faces (100), (002), (101), (102), (110) assure the emergence of hexagonal wurtzite structure (as shown in figure 5) which belong to the space group of P63mc (JCPDS card no. 36-1451) [18]. The bio-synthesized ZnO nano-particles show more acute diffraction peak value introducing the appearance of the high percentage of crystalline phases. In addition, no impurity phases are present in the samples.

Figure 4. XRD patterns of ZnO A and ZnO B NPs.
Download figure:
Standard image High-resolution image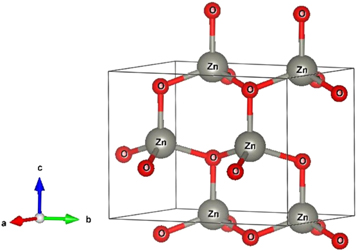
Figure 5. Schematic wurtzite crystal structure of ZnO NPs.
Download figure:
Standard image High-resolution imageHowever, considering the most severe diffraction peak (101), the crystallite size (D) can be calculated in accordance with the Debye Scherer formula [19]:

Hither, β is the Full Width at Half Maxima of the corresponding peak, k is a dimensionless shape factor (∼0.94), while λ is the wavelength of Cu Kα radiation (1.54 Å) and ϴ is the Bragg angle. D is mainly the mean size of the ordered domains which is considered to be equal to the particle size (applicable for only particles less than 100 nm). So, the average particle size of ZnO A NPs and ZnO B NPs is 33.20 nm and 25.95 nm respectively [19]. Again, there remains an inverse relationship between the β and the D which means that narrower peaks are resulted due to larger particles while broader particles are obtained because of smaller particles. The ZnO NPs showed a good agreement with this statement.
Since the crystallite size can be further employed for the determination of defect concentration within the specimen which is designated as the dislocation density (δ) and the leading formulae is adopted for this purpose [20]:

From the exploration of diffraction data, the lattice constant (a & c), inter-planar spacing (d) and unit cell volume (V) of the specimens (table 1) can also be enumerated by utilizing the following formulas respectively [21]:


And,

Where, h, k, l belong to Miller indices.
Table 1. Structural information on ZnO A and ZnO B NPs.
| Structural parameters | ZnO A NPs | ZnO B NPs |
|---|---|---|
| FWHM (°) at (101) | 0.26313 | 0.33652 |
| Lattice constant (Å) | a = 3.50423 | a = 3.49295 |
| c = 4.95573 | c = 4.93979 | |
| Inter-planar spacing, d (Å) | 2.47786 | 2.46988 |
| Cell volume, a2c (Å3) | 52.70156 | 52.19439 |
| Average crystallite size (nm) | 33.20 | 25.97 |
| Dislocation density, δ (nm−2) | 0.00907 | 0.01482 |
| Bond length (Zn-O), L (Å) | 2.06488 | 2.05823 |
| Lattice strain, ε | 0.00107 ± 0.00128 | −0.00038 ± 0.00092 |
Besides, the lengthening of the stricture (L) between Zn and O can be enumerated by the following equation [20]:

Where u corresponds to parameterized constant belonging to wurtzite structure and can be expressed as:

In accordance with the Williamson-Hall proposition, the lattice strain was calculated by adopting the undermentioned equation [20]:

Whither, λ belongs to the wavelength of dispersion, β stands for the FWHM (full width at half maximum) of the corresponding peak, θ and ε correspond to the diffraction angle and strain residing into the specimen respectively. Actually, the strain value is attained from the slope of the linearly fitted  versus
  plot which is stereotyped in figure 6 and the acquired outcomes are shown in table 1. However, the positive slope value for ZnO A NPs denotes the presence of tensile strain into the crystal, while the negative slope value for ZnO B NPs ensures the presence of compressive strain [22]. The compressive strain in ZnO B NPs is caused due to the reduction of the lattice parameters as compared to ZnO A NPs.
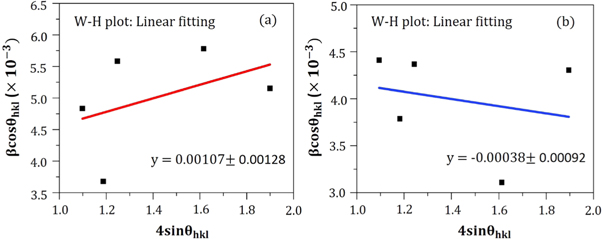
Figure 6. W-H plot of (a) ZnO A NPs and (b) ZnO B NPs for the measurement of lattice strain.
Download figure:
Standard image High-resolution image3.3. Morphological analysis
Figures 7(a) and (b) shows the scanning electron micrographs of ZnO A and ZnO B NPs respectively. From the previous section, we have learned that the average particle size of ZnO B NPs (25.97 nm) is smaller than that of ZnO A NPs (33.20 nm). This can be also caused due to the presence of terpenoids in the Neem leaf extract. The terpenoid act not only as a stabilizing agent but also as a powerful reducing agent that interacts with ZnO NPs and reduces its size significantly [8, 17]. Moreover, the maximum particles of ZnO A NPs remain between the range of 15 nm to 68 nm, whereas for ZnO B NPs the range lies from 10 nm to 70 nm.
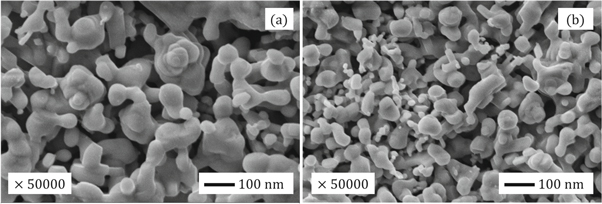
Figure 7. SEM micrographs of (a) ZnO A NPs and (b) ZnO B NPs.
Download figure:
Standard image High-resolution image3.4. Antibacterial activity
Antibacterial activity of ZnO A NPs and ZnO B NPs was analyzed by adopting the agar well diffusion method using Escherichia coli O157: H7 as the bacterial medium. Generally, there involve three mechanisms behind the interaction between the bacteria and the NPs. The first one involves the formation of extremely active hydroxyls and the second one involves the deposition of NPs on the bacteria surface. In addition, for the last one, the NPs accumulates in the cytoplasm or in the periplasmic region of bacteria cell which disrupts the cellular operations and simultaneously disorganizes the membrane. However, in consideration of E. coli, ZnO NPs firstly disorganize the membrane of E. coli and enters into the cytoplasmic region. Positioning themselves into the cytoplasm, the NPs neutralizes the respiratory enzymes and increases the emersion of cytoplasmic contents into the outward direction which impairs the membrane and finally kills the E. coli bacteria resulting in a zone of inhibition of bacterial growth around itself [3, 23].
From figure 8, it is observed that the zone of inhibition of bacterial growth due to ZnO A NPs is different from the zone of inhibition that is caused by ZnO B NPs. However, ZnO B NPs introduce a higher zone of inhibition than ZnO A nanoparticles and the measurements of the inhibition zone of bacterial growth are tabulated in table 2. According to Krishna R Rangupathi, the antibacterial activity of nanoparticles is a size-dependent property and the property enhances with the reduction of particle size [23]. As the ZnO B NPs have smaller particle size as well as higher surface area, they show more antibacterial potential than that of ZnO A NPs [2].
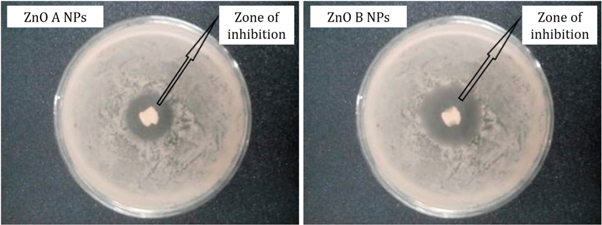
Figure 8. Antibacterial analysis of ZnO NPs showing the zone of inhibition of the growth of Escherichia coli O157: H7.
Download figure:
Standard image High-resolution imageTable 2. Antibacterial measurements of ZnO A NPs and ZnO B NPs.
| Sample | Weight of the sample (gm) | Bacteria | The scientific name of the bacteria | Bacteria type | Zone of inhibition, D (mm) |
|---|---|---|---|---|---|
| ZnO A NPs | 1.0 | E. coli | Escherichia coli O157:H7 | Gram negative | 9.3 |
| ZnO B NPs | 1.0 | E. coli | Escherichia coli O157:H7 | Gram negative | 14.5 |
3.5. Photocatalytic activity
In the photocatalytic analysis, the ZnO nanoparticles were used as a photocatalyst in the aqueous solution of methylene blue (MB) dye and the subsequent degradation tendency of these particles was examined significantly. As ZnO is irradiated with UV light having energy equal or higher than the band gap energy (Eg) of ZnO nanoparticles, the electrons (e−) from the valence band (VB) move forward to the nearest empty conduction band (CB) to create pairs of electron-hole (e−/h+). The e−/h+ pairs then diffuse to the surface of the particles and perform redox reactions which are stereotyped in equations (12)–(14). During this reaction, extremely active hydroxyl radicals are formed by the reaction of H+ with H2O and  In the meantime, the reaction between e− and O2 produces superoxide radical anions which finally converts to hydrogen peroxide as displayed in equation (15). Then the free OH· radicals interact with the MB dye and correspondingly decomposes it which results in the disappearance of blue color from the dye solution. A schematic representation of the photodegradation phenomenon of MB dye by ZnO NPs is displayed in figure 9. Again, figure 10 demonstrates the results obtained from the electron spin resonance (ESR) analysis. It is observed that no identical ESR signals are present in the dark environment while significant signals appear in the presence of visible light. However, the characteristic peaks at figures 10(a) and (b) correspond to the DMPO- OH·, and DMPO-·
 respectively. The trapping experiment is further continued to find out the most active species that causes the degradation of MB dye by using several scavengers. Where, sodium oxalate, isopropanol, and benzoquinone were used to scavenge
  OH· and ·
 radicals respectively. However, the addition of these scavengers causes a significant reduction of the MB degradation efficiency of ZnO B NPs as shown in figure 10(c). In addition, it is observed that the lowest degradation efficiency of ZnO B NPs is observed due to the accession of isopropanol which proves that OH· radical provides a greater contribution to the degradation of MB dye.
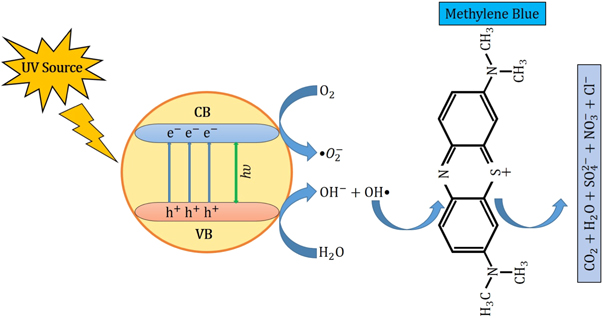
Figure 9. Degradation mechanism of MB dye by ZnO NPs under the influence of UV irradiation.
Download figure:
Standard image High-resolution image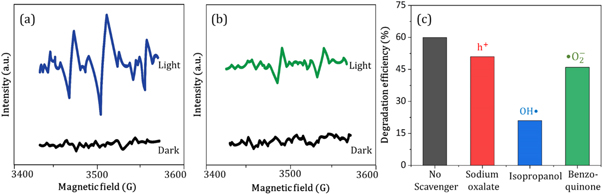
Figure 10. ESR signals of (a) DMPO-OH · and (b) DMPO-· in aqueous and methanol dispersion respectively, (c) MB degradation efficiency (%) of ZnO NPs in the presence of different scavengers.
Download figure:
Standard image High-resolution imageHowever, the corresponding reactions in the photodegradation scheme can be summarized as below [24, 25]:


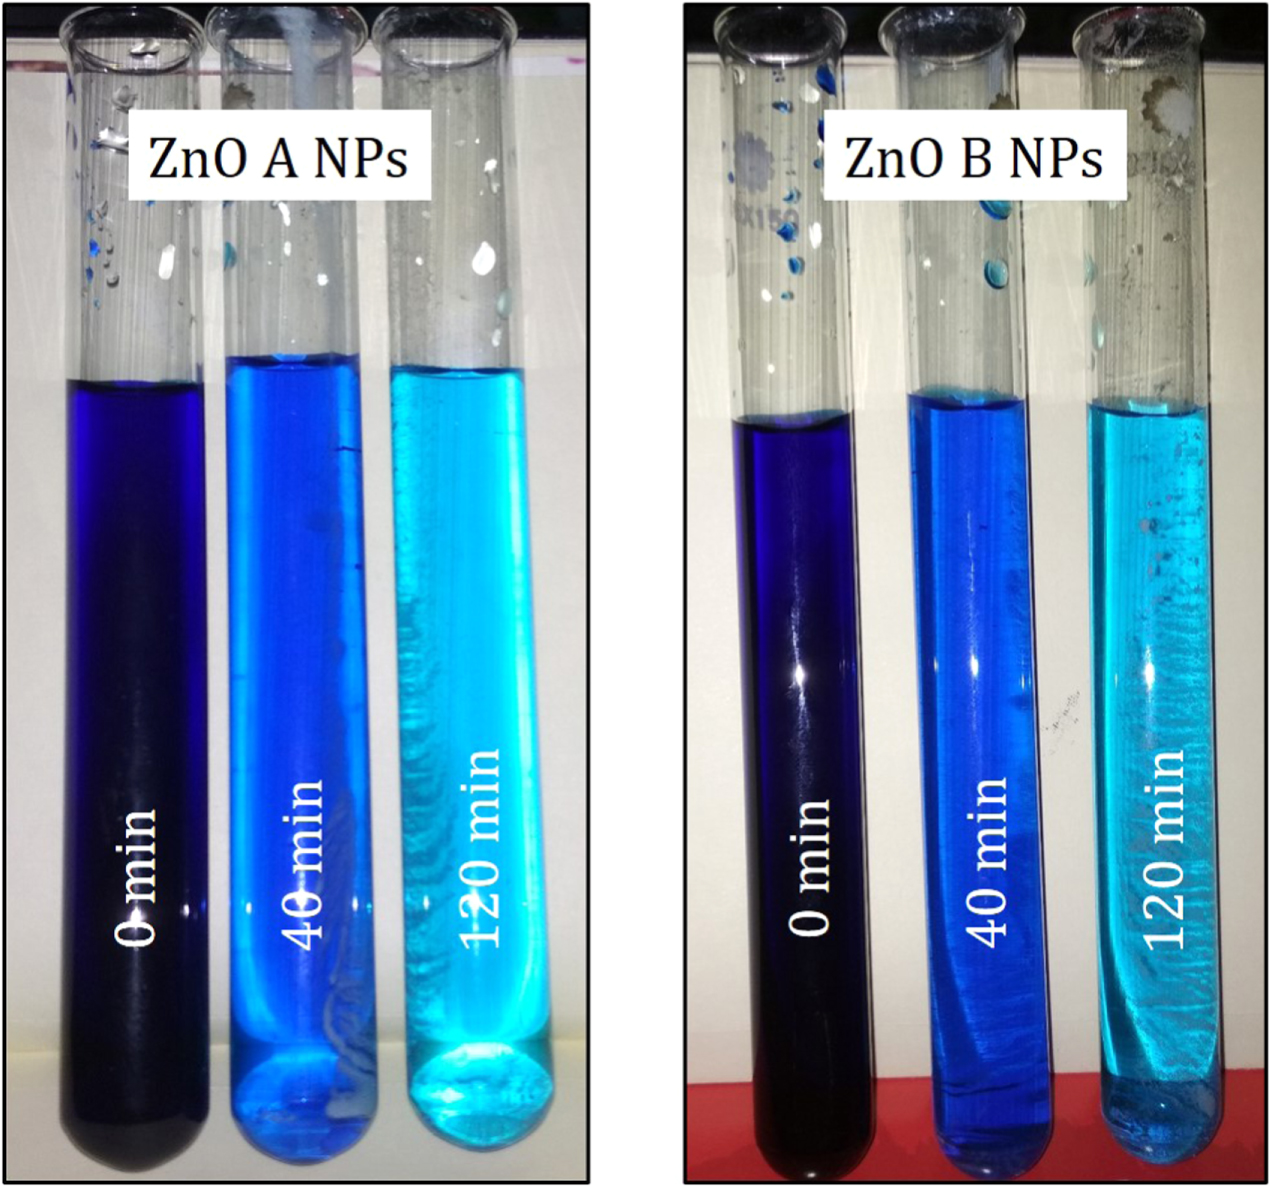
Figure 11 displays the discoloration of MB dye due to the photocatalytic action of ZnO NPs at different times (0, 40 and 120 min). However, figures 12(a) and (b) illustrates the absorption spectra of MB dye as a function of wavelength under the influence of UV radiation at a variation of time i.e. 0, 40, 80, 120, 160, 200 min. From the graph, it is observed that the absorption rate of MB containing ZnO B NPs decreases more rapidly than that of ZnO A NPs. Moreover, the degradation efficiency (η) of ZnO NPs (biosynthesized and sol-gel synthesized) with respect to time is illustrated in figure 13. The degradation of MB for sol-gel synthesized ZnO are 35.3%, 45.7%, 56.1% 62.4%, 68.9% at 40, 80, 120, 160 and 200 min respectively. Again, the values for biosynthesized ZnO are 36.9%, 47.5%, 62.7%, 72.1%, and 80.2% at 40, 80, 120, 160 and 200 min respectively. So, MB dye degraded more rapidly in the presence of ZnO B NPs backing the reason for smaller particle sizes than that of ZnO A NPs. As the particles become smaller, the active surface area for the photocatalysis increased which results in enhanced degradation of MB [26]. Moreover, there remain terpenoids in the neem leaf extract which stabilizes the nanoparticles by capping themselves which also causes in the increment of photocatalytic action [27].

Figure 11. Visual inspection of the degradation phenomenon of MB dye by ZnO NPs.
Download figure:
Standard image High-resolution image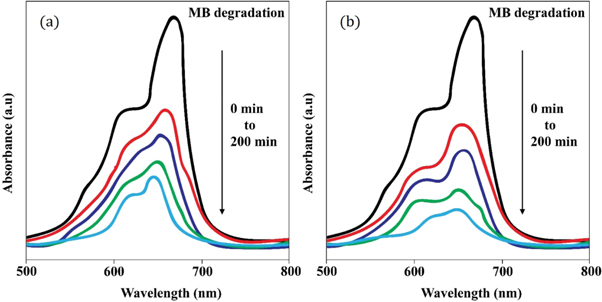
Figure 12. Absorption spectrum of (a) ZnO A NPs and (b) ZnO B NPs as a function of wavelength at 0, 40, 80, 120, 160, 200 min.
Download figure:
Standard image High-resolution image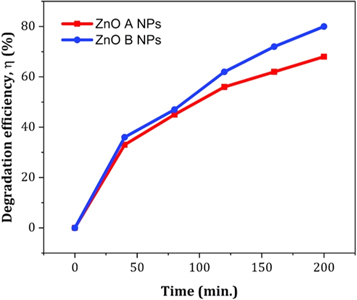
Figure 13. The degradation efficiency of ZnO NPs for methylene blue dye with respect to time.
Download figure:
Standard image High-resolution image3.6. Optical analysis
Figures 14(a) and (b) displays the room temperature absorption spectrum of ZnO nanoparticles fabricated by sol-gel and biosynthesis methods correspondingly. Here, the absorption wavelengths are remaining within the maximum allowable limit of the absorption band of bulk ZnO (∼373 nm). Although the absorption slightly increases up to a wavelength of 363 nm for ZnO A NPs, the maximum incremental value for ZnO B NPs is 356 nm. The slight shift of the absorption peak may be caused due to the variation of particle size and their configuration [28]. However, this phenomenon results in the presence of a wide range of particle size distribution of ZnO [29]. Moreover, the redshift of ZnO A NPs compared to ZnO B NPs corresponds to the formation of agglomeration in the specimens significantly. Furthermore, in accordance with Gunanlan Sangeetha et al the shifting of absorption band to the higher wavelength as well as higher energy was associated with the increment of the size of nanoparticles [30]. Moreover, considering the direct interband transition between the valence band and the conduction band, the absorption band gap energy was measured by adopting the following Tauc's formula [31]:

Where A is an energy-independent constant, α is the absorption coefficient, hυ is for the photon energy, and Eg is the optical band gap energy. The Eg of the ZnO NPs was obtained from the (αhυ)2 versus hυ plot (as shown in the inset of figures 14(a) and (b). Where the extrapolation of the linear segment of the graph to (αhυ)2 = 0 provides the value of Eg for ZnO NPs. It is observed that the optical band gap energy of ZnO B NPs (3.25 eV) is higher than that of ZnO A NPs (3.23 eV). This incremental phenomenon is mainly attributed to the quantum confinement effect. According to this theory, as the particle size decreases, the electrons in the valence band and the holes in the conduction band confine themselves within a space having a dimension of the de Broglie wavelength. However, this confinement influences the quantization of the energy and the momentum of the corresponding carriers and also enhances the optical transition energy between the valence band and the conduction band resulting in a broad band gap [32].
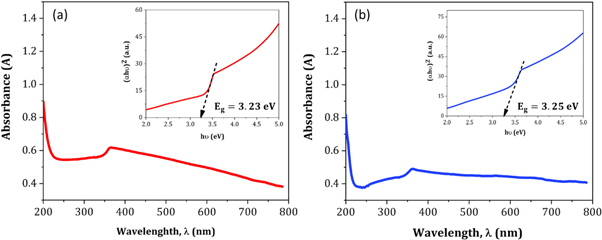
Figure 14. Absorption spectra of (a) ZnO A NPs and (b) ZnO B NPs (inset shows (αhυ)2 versus hυ plot for the determination of band gap energy.
Download figure:
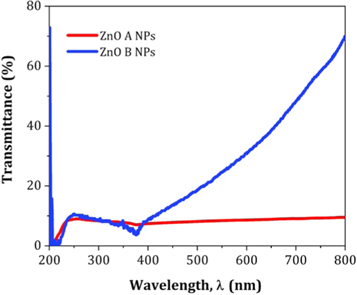
Standard image High-resolution imageFigure 15 displays the UV visible transmittance spectrum of ZnO A NPs and ZnO B NPs. Here, the transparency of ZnO B NPs is greater than that of ZnO due to the reduced particle size of ZnO B NPs. From the research of Takuya Tsuzuki, it is clear that smaller particles are capable to show higher transparency at the visible range of spectrum [33]. However, the UV blocking characteristics are almost similar for each of the variants of NPs.
Figure 15. Typical transmittance spectra of ZnO NPs.
Download figure:
Standard image High-resolution image
4. Conclusion
In summary, ZnO NPs were synthesized by two different methods i.e., sol-gel and biosynthesis method. The green synthesis of ZnO NPs allows avoiding the toxic chemical agents that are used in the sol-gel method for the size reduction. However, the Neem leaf extract possesses some phytochemicals which not only performs in the reduction of the particle sizes but also provide sufficient stabilization. Although, the average particle size of ZnO B NPs (25.97 nm) was smaller than that of ZnO A NPs (33.20 nm), the optical band gap energy of ZnO B NPs was higher than that of ZnO A NPs due to the quantum confinement effect. In addition, the antibacterial and photocatalytic properties of ZnO B NPs were greater than that of ZnO A NPs. Where, the zone of inhibition of bacterial growth for ZnO B NPs was 14.5 mm and for ZnO A NPs, it was 9.3 mm. Moreover, the degradation efficiency of ZnO B NPs at 200 min was 80% while for ZnO A NPs, the corresponding efficiency was 68%. Again, from the ESR analysis, it was proved that the OH · radicals were the main contributing factor for the degradation of MB dye. So, based on the comparison between the properties of the two variants, it is concluded that the biosynthesis method shows more effectiveness than the sol-gel method for the synthesis of ZnO NPs.
Acknowledgments
The authors are grateful to Rajshahi University of Engineering & Technology (RUET) for providing the opportunity to perform various tests. Special thanks go to Tasmia Zaman, Assistant Professor, Department of Glass & Ceramic Engineering, Rajshahi University of Engineering & Technology, Bangladesh for her cordial assistance.