
Abstract
The utilization of air injection as a method to enhance oil recovery in oil fields has gained prominence due to its cost-effectiveness and widespread availability, particularly in heavy oil production. This study focuses on optimizing the oxidative cracking process of Algerian crude oil by employing air injection supplemented with H2O2 and analyzing the interaction of key operating parameters like temperature and catalyst amount using response surface methodology. The predicted values derived from the response functions closely aligned with experimental data, demonstrating high accuracy (R2 = 0.9727 for liquid oil, R2 = 0.9176 for residue, and R2 = 0.7399 for gas phases). Using the developed second-order model, optimal conditions were determined through contour and surface plots, as well as regression equation analysis using Design software. At these optimal parameters (14.78 wt% of H2O2, 2 l min−1 of air flow, 100 ml of crude oil at 354.05 °C for 40 min), the oxidative cracking process yielded 96.32% liquid oil, 3.018% residue, and 0.662% gas products. Notably, the experimental produced liquid oil constituted 96.07 vol. %, matching well with the optimization outcomes. Physicochemical analysis of liquid product phase obtained from oxidative cracking process of petroleum confirmed the prevalence of light aliphatic compounds (C2-C11) at 70.59%, alongside 29.41% of C12-C36. The process also resulted in reduced viscosity, density, refractive index, and sulfur content in the liquid phase. The combination of air injection and H2O2 showcases promise in recovering residual oil effectively and contributes to the ongoing advancements in EOR techniques.
Export citation and abstract BibTeX RIS
1. Introduction
Until now, fossil fuels remain the primary resource for fuels and chemical products. However, unconventional oil resources have been underutilized due to the costly and challenging extraction processes required due to their complex reservoir composition [1]. Typically, as light crude oil gradually depletes from a reservoir, the recovery efficiency tends to decrease, resulting in the deposition of more viscous residual crude oil. These reserves are considered vital to secure the supply of rising fuels and by-products demand [2, 3]. As reservoir pressure declines, one method of Enhanced Oil Recovery (EOR) involves injecting water or other fluids into the field to help bring crude oil to the surface [4–6]. In the simplest case, the Enhanced Oil Recovery (EOR) process serves as a tertiary method employed after primary and secondary recovery stages. Its aim is to displace oil trapped in pores by capillary forces, significantly enhancing both oil displacement efficiency and volumetric sweep efficiency [7, 8]. Traditionally, thermal and nonthermal (i.e., chemical and miscible methods) are the most familiar forms of EOR recovery processes. Thermal techniques like steam-assisted gravity drainage (SAGD) work by lowering fluid viscosity to minimize flow resistance, demonstrating economic feasibility with a recovery factor between 25% and 75% of the original oil in place (OOIP) [9]. Nevertheless, thermal processes incur significant production costs due to their high energy consumption, carbon output, and water usage, and sometimes they require solvent injection such as propane or butane [10]. Indeed, the emission of greenhouse gases and the disposal of wastewater have well-known negative consequences on the environment, posing significant challenges for these processes in reality [11]. Non-thermal methods have proven to be successful in most applications and include physical, chemical, and biological methods. Numerous studies indicate that injecting gases like air, nitrogen, carbon dioxide, among others, is an efficient approach to enhance the efficiency of oil recovery in reservoir development [12]. Among EOR processes, air injection is considered one of the methods with huge potential applications due to its abundance, availability, and low cost. Rapid reservoir re-pressurization, extraction of lighter components for subsequent oil recovery, oil swelling through flue-gas dissolution, the promising potential of miscible flooding, the formation of thermally induced microfractures in the reservoir, and the reduction of crude oil viscosity due to thermal effects are all significant aspects in oil recovery methods [13]. Moreover, crude oil has the capability to undergo oxidation reactions, producing flue-gas sweep and thermal drive. Additionally, the in situ generated CO2 can interact with the crude oil, leading to a reduction in interfacial tension and oil viscosity [14, 15]. Indeed, air injection has been successfully implemented in various types of reservoirs containing both light oil [16, 17] and heavy oil [18, 19]. In these reservoirs, air serves as an oxygen donor, facilitating In Situ Combustion (ISC) reactions. Within the ISC process, three primary reactive zones emerge: Low-Temperature Oxidation (LTO) occurring below 350 °C, Fuel Deposition or Thermal Cracking (FD/TC) spanning the range of 350–550 °C, and High-Temperature Oxidation (HTO) taking place above 600 °C. The intensity of oxidation reactions and the transition from Low-Temperature Oxidation (LTO) to High-Temperature Oxidation (HTO) primarily hinge on the temperature and pressure conditions within the reservoir [20]. In the Low-Temperature Oxidation (LTO) zone, interactions between gas and liquid phases lead to the creation of water and partially oxygenated hydrocarbons, including alcohols, carboxylic acids, aldehydes, ketones, and hydroperoxides. During the Fuel Deposition (FD) zone, processes like distillation and visbreaking occur, where the lighter fractions of crude oils are consumed or transformed. Within the High-Temperature Oxidation (HTO) region, the deposited coke undergoes combustion, generating heat that aids in propagating the thermal front and improving the mobility of fluids in the reservoir [21]. Various studies have demonstrated that incorporating catalysts into oil production systems can boost oil recovery by enhancing the mobility of oil trapped within the continuous water phase present in the pores of the reservoir rock [22–25].
The application of hydrogen peroxide as a catalyst in reservoirs is an economically viable process that is relatively similar to steam injection, with additional advantages such as the generation of high-quality steam in situ, with concentrations above 25%–30%, resulting in significant cost reductions [26]. Furthermore, hydrogen peroxide decomposes in the reservoir to generate heat and form water and oxygen, which are environmentally favorable products and effective in oil recovery. Moreover, when oxygen reacts with resident hydrocarbons, it generates additional heat and CO2, which can support steam and hot water flooding operations. Additionally, this reaction contributes to oil recovery when hydrogen peroxide is injected [27]. According to Moss et al's study in 1994, the continuous injection of an H2O2 solution progressively enhances the progression of the heat reservoir, steam-rich area, hot-water region, combustion front fueled by oxygen, and the accumulation of CO2 throughout the formation. Moreover, it can efficiently displace oil while also potentially repairing formation damage [28, 29]. Other authors have reported that the injection of an H2O2 solution favors the formation of biosurfactants and methane oxidation within the reservoir. This influences the dynamics of oil recovery due to the extensive penetration of H2O2 deep into the reservoir, facilitating a broader dispersion of oil biodegradation within its confines [30–34].
This study aims to investigate the feasibility of the combined effect of air and peroxide injection for improved oil recovery from petroleum oil via the oxidative cracking process. Preliminary experimental results are presented, and the process parameters are discussed using response surface methodology, as well as the investigation of physiochemical properties of products.
2. Experimental section
2.1. Materials
The Sonatrach Company provided crude oil samples sourced from the Algerian Hassi-Messaoud petroleum field. O2 gas was purchased from Linde Gas Algeria (medical grade, 99.999%). H2O2 solution (30 wt%) was supplied by Sigma-Aldrich company and used as received.
2.2. Oxidative cracking procedure
Figure 1 depicts the schematic representation of the experimental setup employed for the recovery of heavy oil from a cylindrical oxidation tube (1.25 m length, ID = 0.1m). A furnace oven is utilized to simulate the reservoir temperature required for the oxidation process and gas injection process at different temperature ranges (320 °C–360 °C), oxidant/oil mass amount (0–15 ml). Preceding each experiment, the pressure vessel undergoes an air purging process by utilizing a vacuum pump to reach a vacuum close to 0.15 MPa. To generate gas under high-temperature conditions, the air is preheated and then injected at 40 °C into the oxidation tube placed in the furnace oven. Initially, the air flow rate into the pressure vessel is established at 2 l min−1, which is subsequently reduced gradually to 1.5 l min−1 by using a low rate volume flow controller. 100 ml of petroleum with different amounts of H2O2 (0–15 ml) at a constant flow rate of 0.5 ml min−1, are introduced into the oxidation tube. Each experimental test concludes when no additional liquid oil is produced, and this is noted using a weight balance to track and monitor the recovery efficiency. At the end of experiments, a chromatogram apparatus is employed to assess and identify the composition of the oxidized oil.
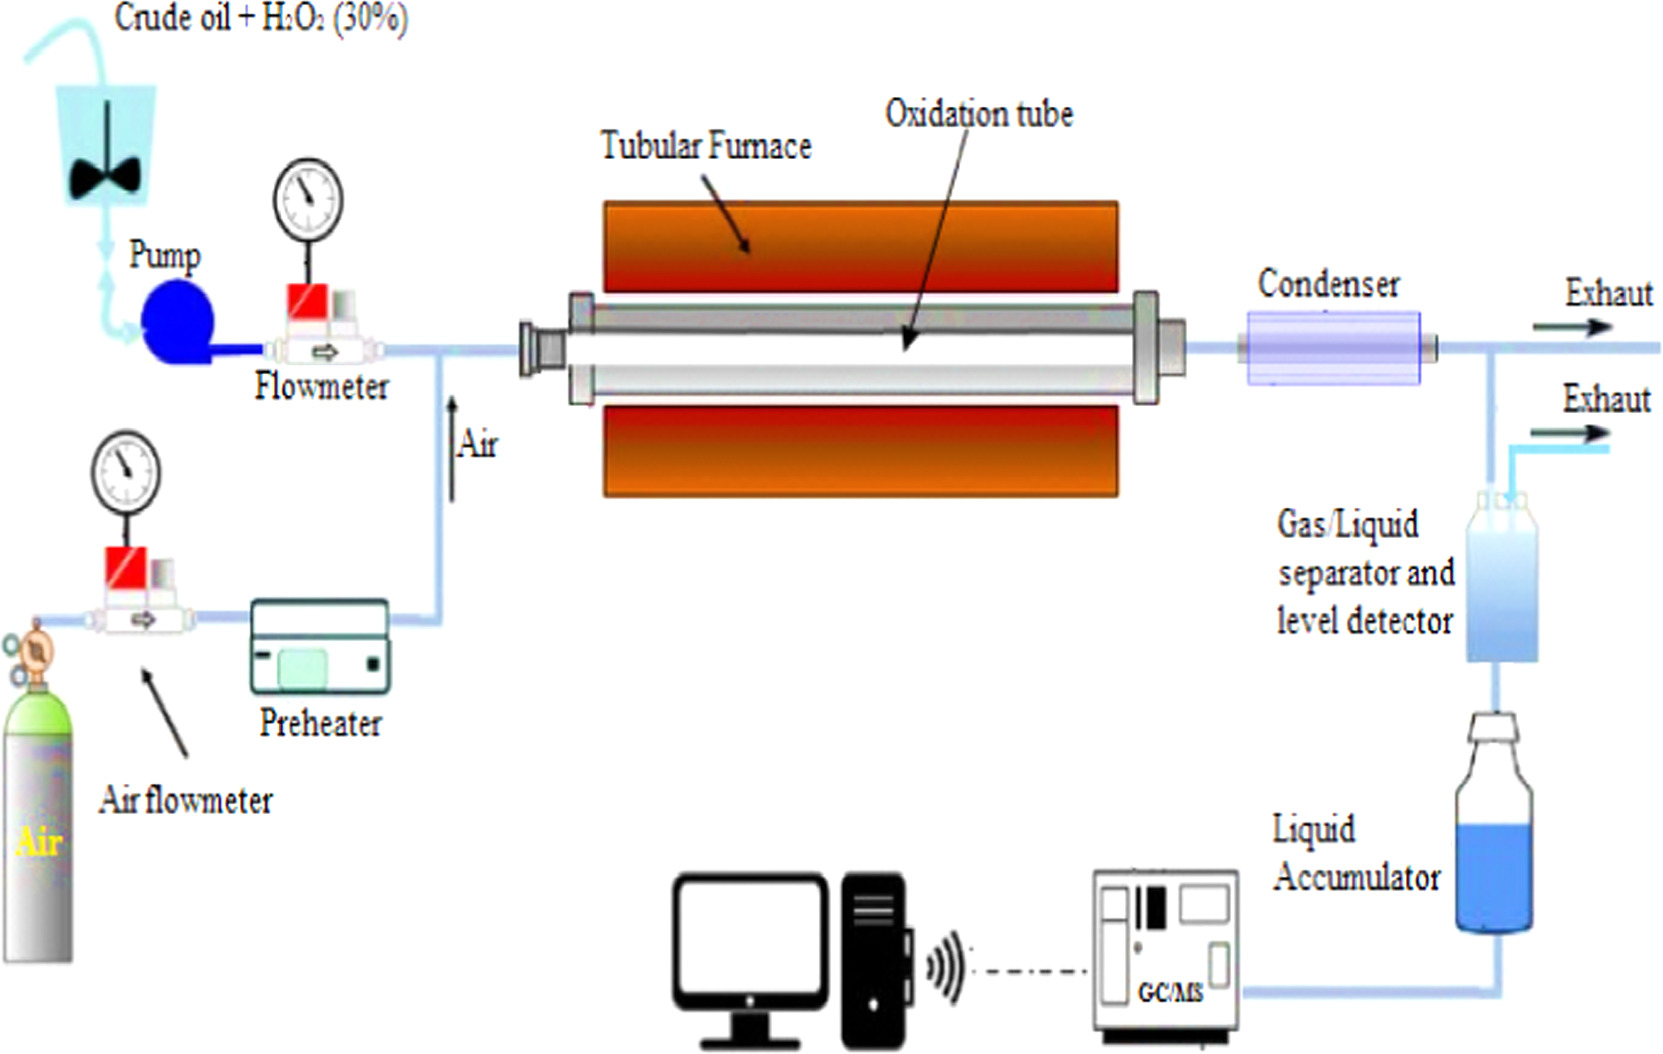
Figure 1. Schematic experimental setup of the oxidative cracking process of crude oil.
Download figure:
Standard image High-resolution image2.3. Experimental design and optimization of process parameters
Design Expert 12.0, a statistical software, was utilized for designing experiments, performing regression analysis, and conducting graphical analysis on the collected data. Furthermore, statistical evaluation of the obtained model was employed for assessing the analysis of variance (ANOVA) and optimizing the oxidative cracking of crude oil. It was also used to assess the relations between the designated independent variables and the yield of liquid, gas, and residue phases as response values via Response Surface Methodology (RSM) based on Central Composite Design (CCD) with five coded levels (−1.41, −1, 0, +1, and +1.41). In this study, the effects of oxidant volume (0–15 ml) and temperature (320 °C–360 °C) at constant pressure were evaluated. Hence, a Central Composite Design (CCD) matrix comprising 17 experiments encompassing the complete design involving two factors was utilized to construct quadratic models. The experimental data derived from these CCD model experiments can be expressed in the form of the following equation:

Where Y denotes the predicted response (liquid phase yield, gas yield or residue phase yield), and β0, βi, βii and βij characterize the proposed model coefficients, and xi and xj determine the coded variables values, and k and e are the variables number and the error term, respectively. The total experiments number in CCD is calculated by applying the following equation:

The replicated runs examine the factors at the center point of the design space, aiming to understand curvature and estimate pure error [35]. This helps to ensure the reliability of the experimental results and provides valuable insights into the behavior of the system under study.
2.4. Analytical analysis of oils samples
The physicochemical properties of oils samples were were assessed in accordance with ASTM standard methods, including: density at 20 °C (ASTM D-4052–11), kinematic viscosity at 20 °C (ASTM D-445), pour and freezing points (ASTM D-97), flash point (ASTM D-56–05), total acid number (ASTM D-974–04), sulphur-content (ASTM D-4294–10), base sediment and water (ASTM D-96), water content (ASTM D-95–05) and salinity (ASTM D-6470). Atomic Absorption Spectrophotometer (AAS) (Perkin Elmer Model Analyst 700, Norwalk, CT) was used for metal quantification at appropriate wavelengths following the (ASTM D-6728) method. The concentrations of metals were obtained from the absorbance plot. Quality Control and Assurance - Replicate analyses were performed on samples to yield a mean, which was used to determine trueness, and the standard deviation of the mean was used to measure precision. Elemental analyses were conducted using a Buck Scientific flame atomic absorption spectrometer (model VGP 210). Gas chromatography (GC) was performed on a Clarus 500 Perkin Elmer autosystem gas chromatograph connected with a flame ionization detector (FID) and equipped with a selective PIONA capillary column (100 m × 0.25 mm i.d.). The samples were analyzed in split/splitless mode using helium as the carrier gas to cover both the response and linear range of the FID detector. The injector temperature was set at 250 °C, while the detector temperature was maintained at 320 °C. The oven temperature followed a programmed sequence: starting at 60 °C (held for 2 min), then progressing to 135 °C (held for 2 min), followed by 185 °C (held for 2 min), all at a rate of 5 °C/min. Subsequently, it reached a final temperature of 290 °C at a rate of 5 °C/min. The system has the capability to detect compositions up to C36 +.
3. Results and discussion
3.1. Effect of operating parameters on oxidation of crude oil
Figures 2(a)–(c) shows the yield of the liquid, residue, and gas phases, respectively, obtained from the oxidative cracking process operating at 300 °C, 320 °C, 340 °C, and 360 °C, respectively, without and with the addition of H2O2. The thermal impact was evident as the liquid yield rose with increasing test temperatures. The recovery factor exhibited a minimum of 60% at 300 °C and peaked at 70% at 360 °C in the absence of H2O2. This could be attributed to the heightened diffusivity of air within crude oil at elevated temperatures. This increased diffusivity enables greater air absorption into the crude oil, subsequently reducing its viscosity significantly and thereby promoting oil recovery [36, 37]. Some authors stated that the increasing temperature gradient is favourable for crude oil recovery, and their relationship can be predicted to obtain the statistical multiple regression equation [38, 39].
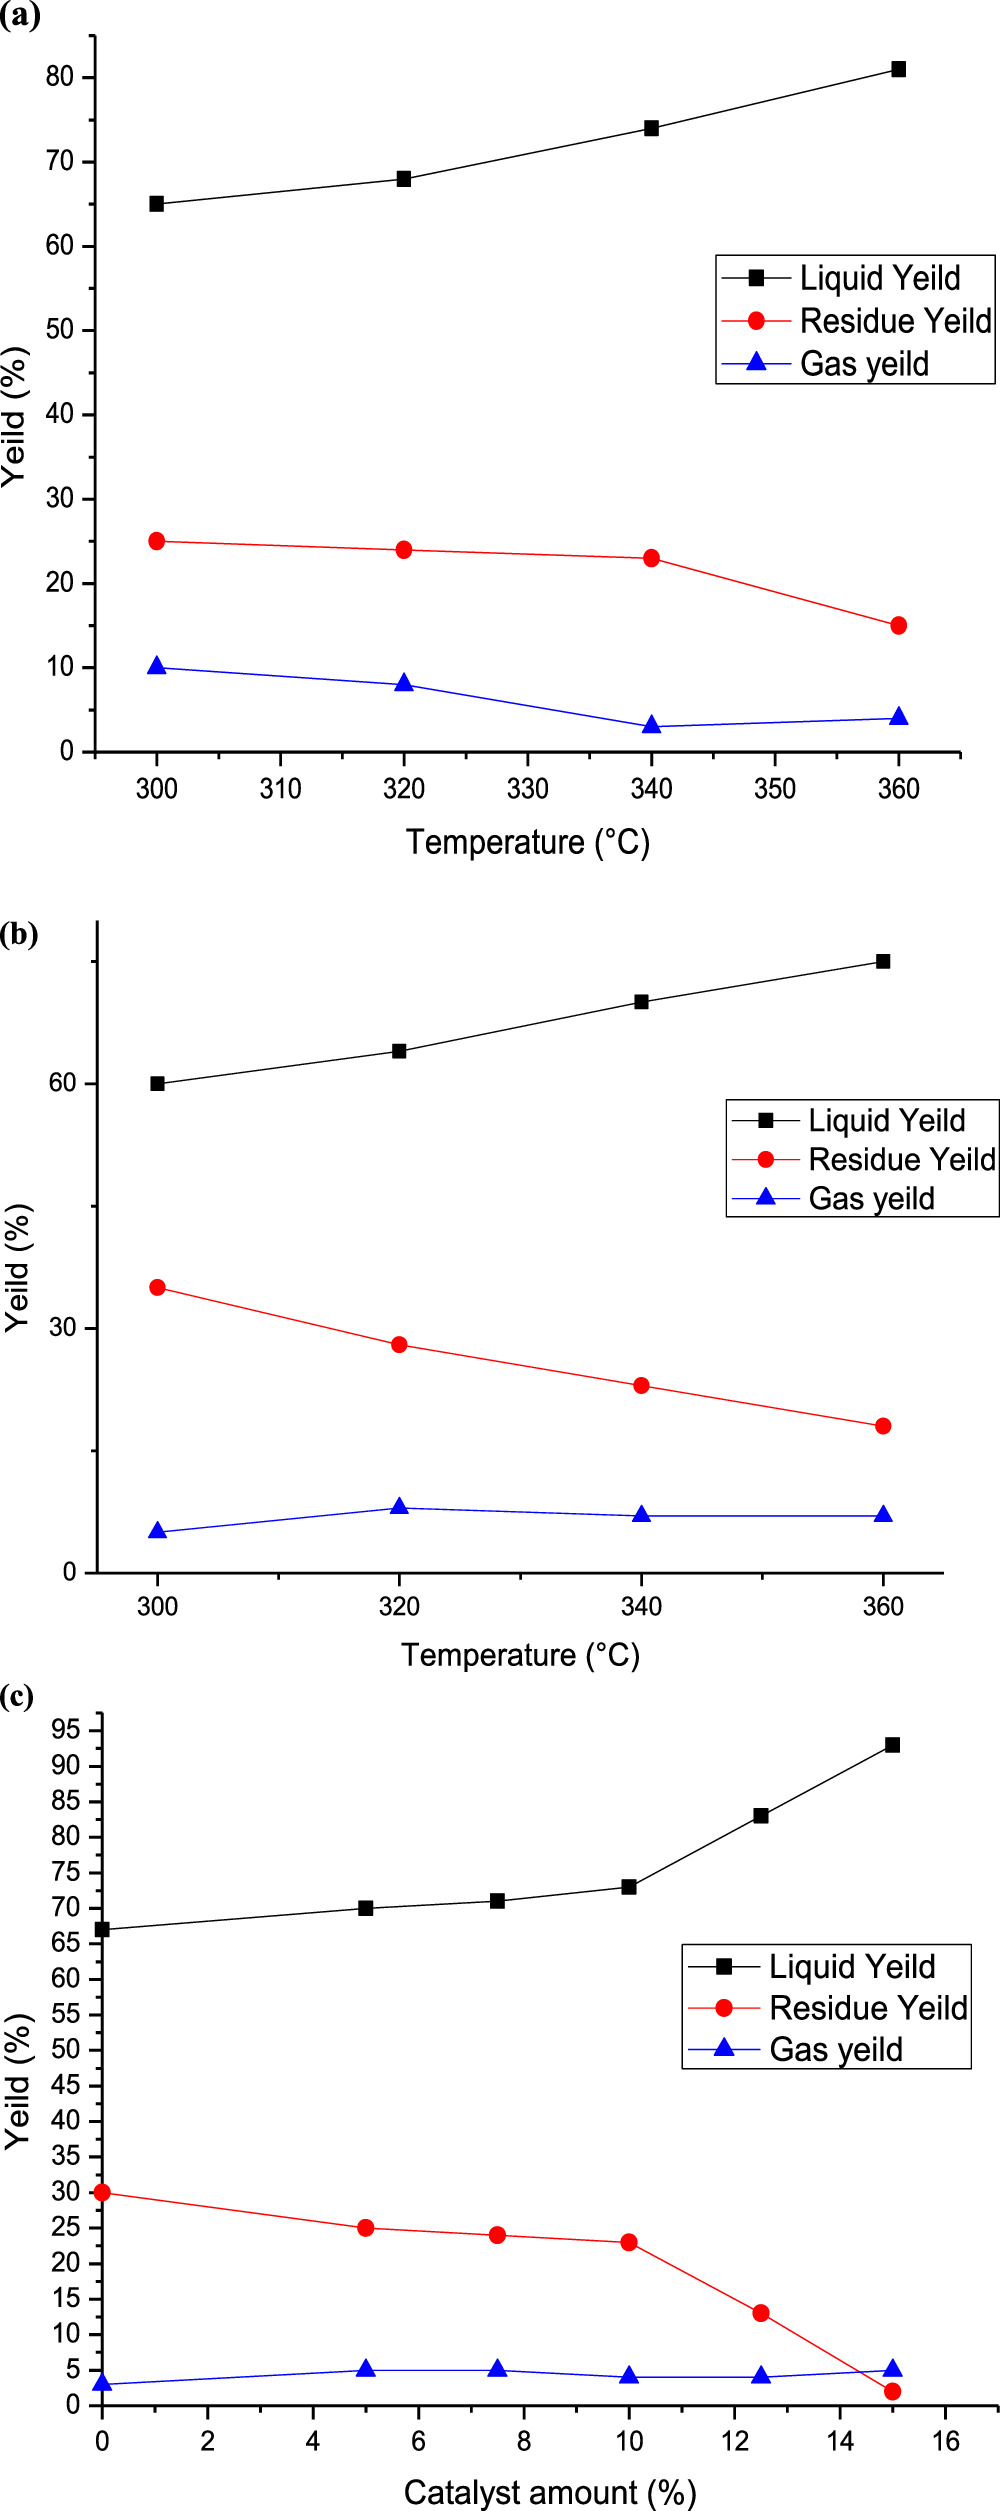
Figure 2. Experimental parameters impact on the oxidative cracking of crude oil: (a) effect of temperature in the absence and (b) in the presence of catalyst (7.5%) at 340 °C, and (c) effect of catalyst at atmospheric pressure.
Download figure:
Standard image High-resolution imageAs expected, the addition of H2O2 into the oxidation tube leads to a rise in the liquid phase yield, as demonstrated in figure 2. The results consistently demonstrate that in all these experiments conducted in the presence of H2O2, the yield of the liquid phase increased with rising temperatures, and the highest yield was obtained at 7.5 ml of H2O2. This may be explained by the decomposition of hydrogen peroxide in proximity to the resident hydrocarbons under favourable operational conditions. This decomposition generates adequate quantities of heat, water, and oxygen, which react with the hydrocarbons in the oil, producing additional heat, water, and carbon dioxide as well as recovering hydrocarbon from the formation [27, 30].
3.2. Optimizing significant variables using response surface methodology
In this study, Response Surface Methodology with Central Composite Design (RSM-CCD) was utilized to assess and comprehend the relationship between the given responses (liquid phase yield (Y1), residue phase yield (Y2), and gas phase yield (Y3)) and the independent variables, including temperature (X1, 300–360 °C) and catalyst amount (X2, 0–15 ml), to accurately predict the optimal values for the responses under investigation. Table 1 displays the matrix, range of independent variables, and the levels of the design model. The values were obtained from the software and may require transformation if the error (residuals) is a function of the magnitude of the response (predicted values).
Table 1. Central composite design for oxidative cracking of crude oil.
| Trials | X1 | X2 | Liquid product yeild (%) | Residue product yeild (%) | Gas products yeild (%) | |||
|---|---|---|---|---|---|---|---|---|
| Experimental | Predicted | Experimental | Predicted | Exprimental | Predicted | |||
| 1 | 300 | 0 | 61 | 61.74 | 29 | 28.73 | 10 | 9 .34 |
| 2 | 320 | 0 | 64 | 63.63 | 28 | 28.27 | 8 | 8.43 |
| 3 | 330 | 0 | 67 | 65.58 | 26 | 26.89 | 7 | 7.97 |
| 4 | 340 | 0 | 68 | 68.18 | 26 | 24.75 | 6 | 7.52 |
| 5 | 360 | 0 | 75 | 75.39 | 18 | 18.18 | 7 | 6.60 |
| 6 | 340 | 0 | 67 | 68.18 | 25 | 24.75 | 8 | 7.52 |
| 7 | 340 | 5 | 70 | 68.97 | 25 | 24.47 | 5 | 6.16 |
| 8 | 340 | 7.5 | 71 | 72.01 | 24 | 22.10 | 5 | 5.47 |
| 9 | 340 | 10 | 73 | 76.84 | 23 | 18,24 | 4 | 4.79 |
| 10 | 340 | 12.5 | 83 | 83.43 | 13 | 12.89 | 4 | 4.11 |
| 11 | 340 | 15 | 93 | 91.79 | 5 | 6.06 | 2 | 3.43 |
| 12 | 300 | 7.5 | 65 | 65.02 | 25 | 24.31 | 10 | 10.34 |
| 13 | 320 | 7.5 | 68 | 67.19 | 24 | 24.74 | 8 | 7.91 |
| 14 | 330 | 7.5 | 70 | 69.27 | 20 | 23.80 | 10 | 6.69 |
| 15 | 330 | 7.5 | 70 | 69.27 | 21 | 28.73 | 9.00 | 6.69 |
| 16 | 340 | 7.5 | 72 | 72.01 | 21 | 22.10 | 7 | 5.47 |
| 17 | 360 | 7.5 | 81 | 79.50 | 15 | 16.41 | 4 | 3.04 |
The adequacy of the model was evaluated using the R-squared (R2) coefficient, while the statistical significance of the model was verified through the F-test to assess the model's ability to explain the variability in the data. The results for the analysis of Variance (ANOVA) are depicted in table 2, indicating that the model accurately predicted the experimental data within a 95% confidence interval. From a statistical perspective, when the P-value associated with model terms is below 0.05, it indicates the statistical significance of these terms, suggesting their appropriateness within the model [40]. The P-values derived from the regression analysis of the crude oil cracking indicate that, within the optimization study, the model terms A, B, A2, and B2 were significant (P < 0.05) concerning the yields of both liquid and residue products. Meanwhile, the significant model terms for gas product yield were identified as A and B through linear regression analysis. To assess the validity of the model, various statistical criteria including F-values, R2-values, and the lack of fit were calculated. It is desirable for the probability value associated with lack of fit to be greater than 0.1 [41].
Table 2. Analysis of variance (ANOVA) for liquid, residue and gas products yields response surface-reduced quadratic model.
| Source | Sum of squares | Degree of freedom | Mean square | F -value | p-value |
|---|---|---|---|---|---|
| Liquid products yield (%) | |||||
| Model | 953.15 | 5 | 190.63 | 78.45 | < 0.0001 |
| A-Temperature | 126.86 | 1 | 126.86 | 52.21 | < 0.0001 |
| B-Catalyst amount | 452.68 | 1 | 452.68 | 186.29 | < 0.0001 |
| AB | 0.1998 | 1 | 0.1998 | 0.0822 | 0.7797 |
| A2 | 21.89 | 1 | 21.89 | 9.01 | 0,0120 |
| B2 | 150.73 | 1 | 150.73 | 62.03 | < 0.0001 |
| Residual | 26.73 | 11 | 2.43 | ||
| Lack of Fit | 25.73 | 8 | 3.22 | 9.65 | 0.0444 |
| Pure Error | 1,0000 | 3 | 0.3333 | ||
| Cor Total | 979.88 | 16 | |||
| Residue products yield (%) | |||||
| Model | 545.53 | 5 | 109.11 | 24.49 | < 0.0001 |
| A-Temperature | 37.81 | 1 | 37.81 | 8.49 | 0,0141 |
| B-Catalyst amount | 318.62 | 1 | 318.62 | 71.53 | < 0.0001 |
| AB | 2.08 | 1 | 2.08 | 0.4669 | 0.5085 |
| A2 | 29.07 | 1 | 29.07 | 6.53 | 0.0268 |
| B2 | 106.26 | 1 | 106.26 | 23.85 | 0.0005 |
| Residual | 49.00 | 11 | 4.45 | ||
| Lack of Fit | 37.87 | 8 | 4.73 | 1.28 | 0.4641 |
| Pure Error | 11.13 | 3 | 3.71 | ||
| Cor Total | 594.53 | 16 | |||
| Gas products yield (%) | |||||
| Model | 65.08 | 3 | 21.69 | 12.33 | 0.0004 |
| A-Temperature | 34.82 | 1 | 34.82 | 19.80 | 0.0007 |
| B-Catalyst amount | 8.88 | 1 | 8.88 | 5.05 | 0.0426 |
| AB | 6.75 | 1 | 6.75 | 3.84 | 0.0719 |
| Residual | 22.87 | 13 | 1.76 | ||
| Lack of Fit | 12.74 | 10 | 1.27 | 0.3775 | 0.8939 |
| Pure Error | 10.13 | 3 | 3.38 | ||
| Cor Total | 87.94 | 16 | |||
R2= 0.9727, Adjusted-R2= 0.9603, Predicted-R2= 0.9082, standard deviation (Std. Dev.) =1.56, mean =71.65, C.V.% = 2.18, Adequate Precision= 32.4580R2= 0,9176, Adjusted-R2= 0,8801, Predicted-R2= 0,8119, standard deviation (Std. Dev.) =2.11, mean =21.79, C.V.% = 9.68, Adequate Precision= 18,0814R2= 0.7399, Adjusted-R2= 0.6799, Predicted-R2= 0.6008, standard deviation (Std. Dev.) =1.33, mean =6.66, C.V.% = 20.22, Adequate Precision= 11.3555
The regression equations can be reformulated to reflect the simplified quadratic model by omitting insignificant terms for liquid product yield (Y1), residue yield (Y2), and gas product yield (Y3) obtained from oxidative cracking using air and H2O2 injection in coded and actual parameters. These equations can be mathematically represented through the following set of regression equations:


The predicted R2 values for liquid, residue, and gas product yields (0.9727, 0.9176 and 0.7399, respectively) showed reasonable consistency with the adjusted R2, with differences between them being less than 0.2. Adequate precision, which assesses the signal-to-noise ratio, is considered favorable when exceeding a value of 4 [42].
The normal probability plot of the studentized residuals is depicted in figure 4(a). It reveals a consistent alignment of residuals from all responses along a relatively straight line, indicating conformity to a normal distribution of errors. This affirms the satisfaction of the normality assumption. In figure 4(b), residuals are plotted against predicted responses to identify potential non-constant variance across the range of predicted values and influential observations within the data. As evident, the data points exhibit a scattered and random distribution throughout the range, strengthening the assertion of a well-fitted model and ensuring no compromise to the assumptions of independence or constant variance. Indeed, the comparison between predicted response and actual values (figure 4(c)) displays a distribution closely surrounding the diagonal line, confirming the model's substantial compatibility with the experimental data. This demonstrates sufficient precision and indicates an excellent correlation between the predicted and experimental values.
3.3. Process parameters impact on yields of liquid, gas and solid fractions
The contour plots in figure 4 illustrate the effect of temperature and oxidant amount during oxidative cracking of crude oil on increased product yields. The influence of the selected variables on the fuel oil yield was evident. The catalyst amount and temperature are among the most influential parameters in the process, significantly affecting the oxidative cracking reactions of crude oil and accelerating the breaking of chemical bonds. A preliminary analysis of the results, as depicted in figure 3, indicates that an increase in temperature and the fraction of supplied H2O2 leads to higher yields of liquid hydrocarbon fractions.
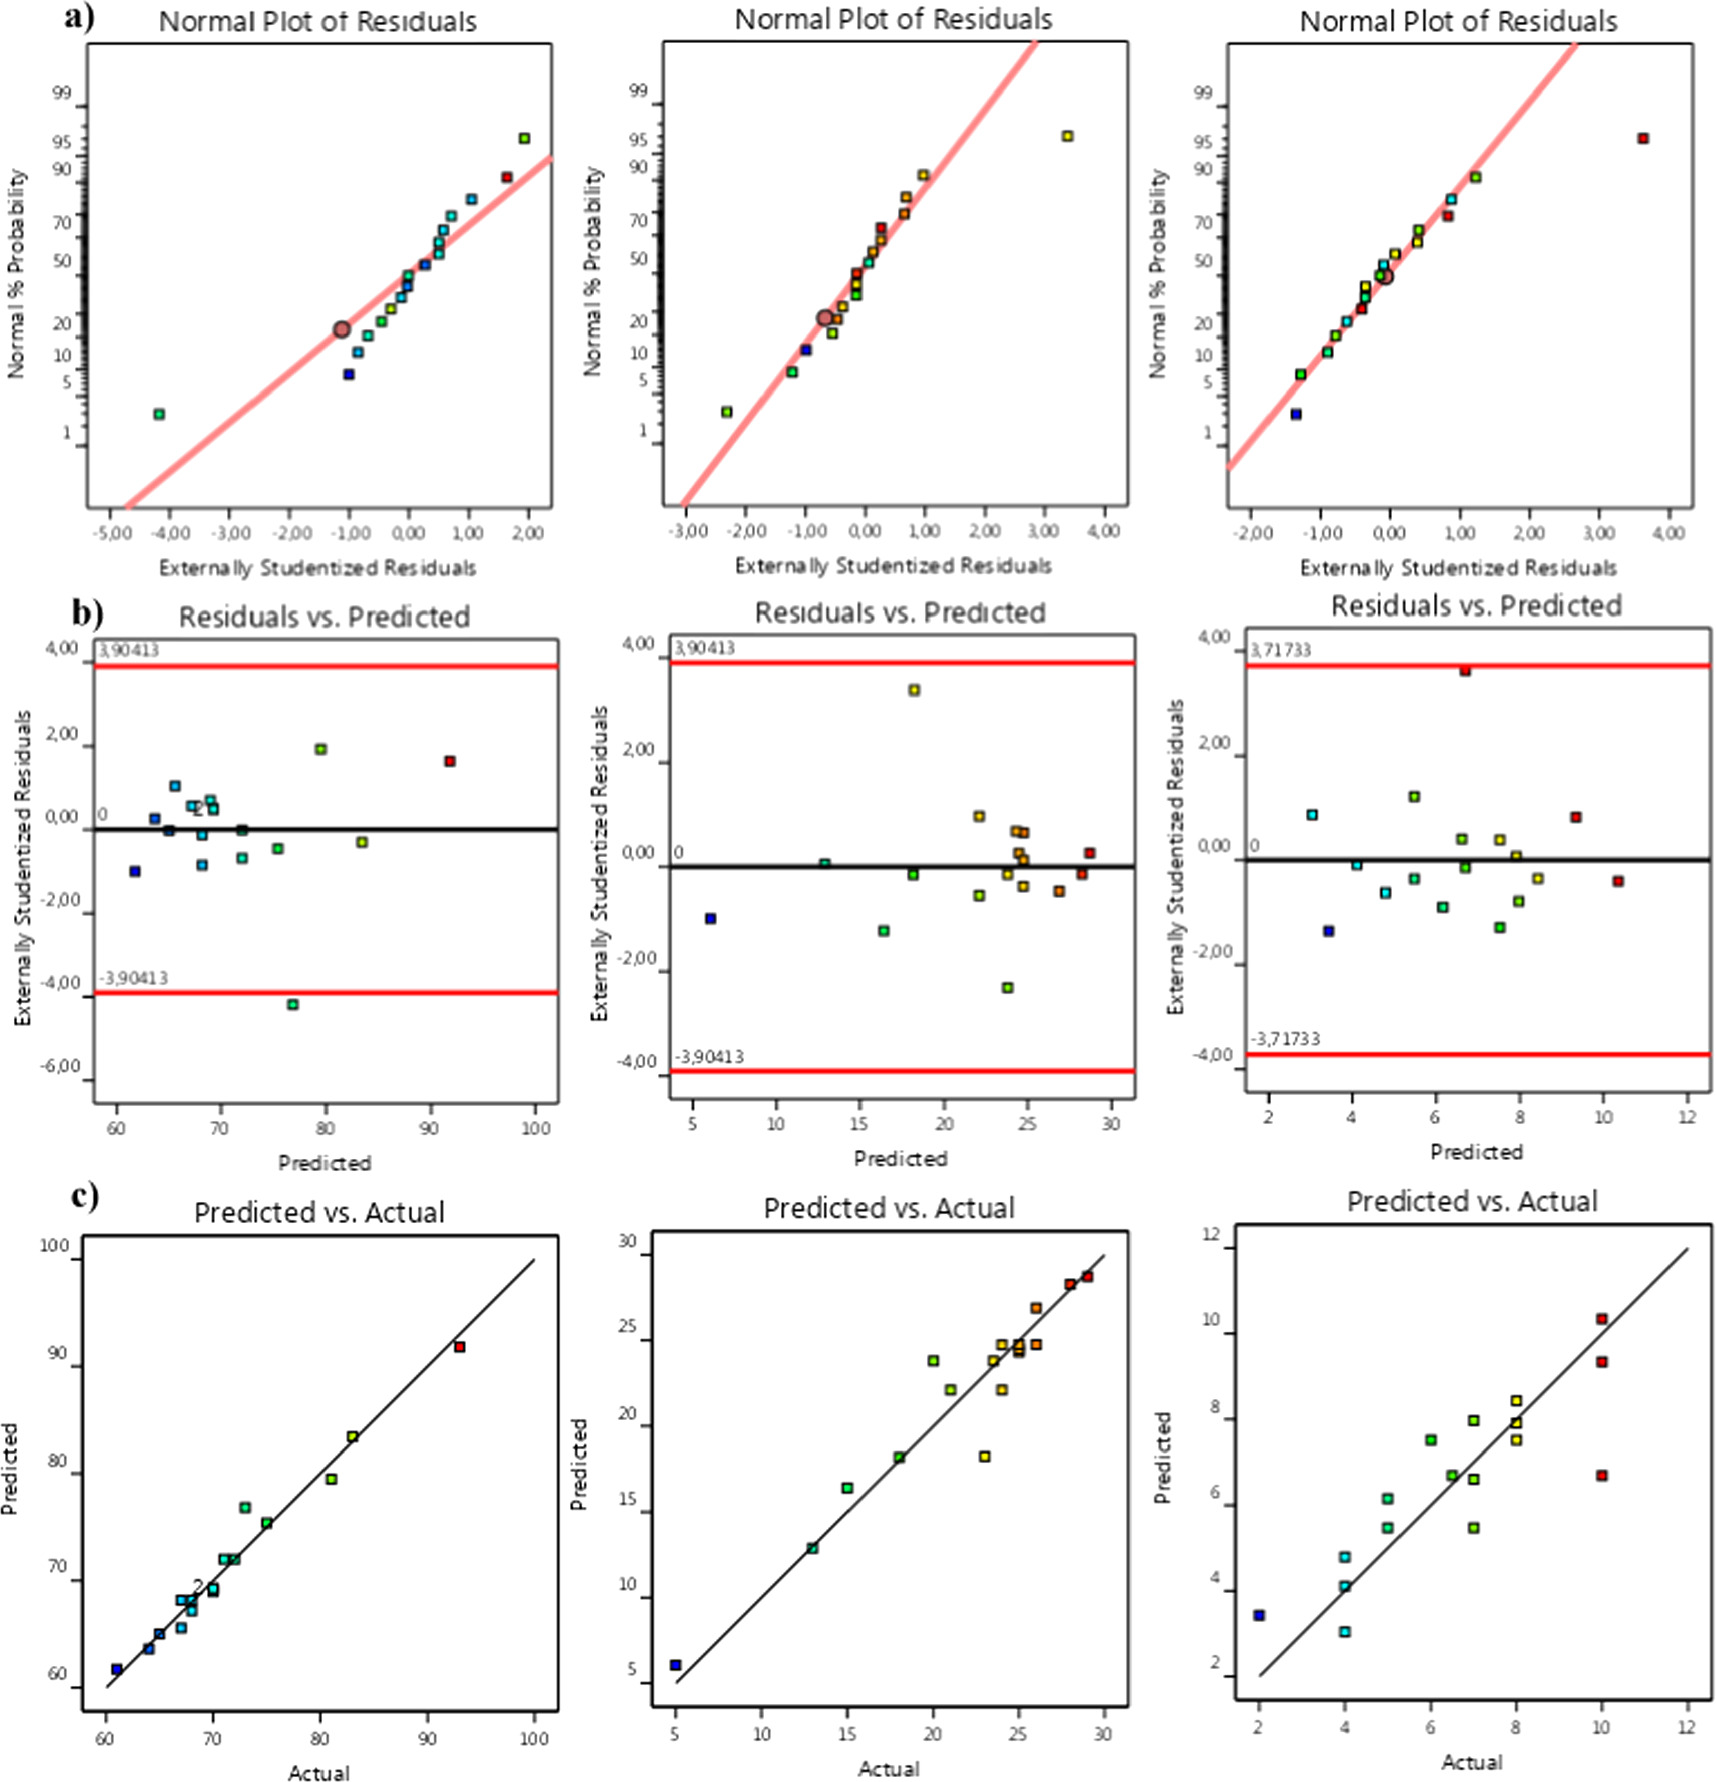
Figure 3. Residual analysis of the predicted model for liquid, residue and gas products yield respectively from left to right: (a) normal probability plot of residuals, (b) residual versus the run number, and (c) predicted values against the actual values of response values.
Download figure:
Standard image High-resolution imageThe results depicted in figure 3 indicate that the liquid yield reaches its maximum near the higher-level points of temperature and oxidant amount. According to the contour results from figure 3(b), when a small amount of oxidant (less than 7.5 ml) is added to the crude oil, the liquid product yield moderately increases, ranging from 61 to 70% within the defined temperature range. However, if the H2O2 amount exceeds 7.5 ml, there is a considerable increase in the yield of liquid products. This could be attributed to the reduction in oil viscosity and density achieved by mixing crude oil and H2O2 before the oxidation test, enhancing crude oil mobility and liquidity. Consequently, this facilitates the activation and subsequent movement of residual oil. Another advantageous aspect of employing hydrogen peroxide as the primary oxidant is its promotion of water production, carbon dioxide, and heat, which are favorable for in situ-combustion when combined with air. It is evident that the introduction of air alters the thermodynamic equilibrium and significantly enhances the conversion of crude oil. Moreover, a sufficient amount of H2O2 with air injection leads to high-molecular-weight cracking and intermediate molecular-weight during H2O2 decomposition by generating free entities such as linear radicals (HO. and HOO.) and aromatic radicals (Ar.) [43]. It should be noted that the hydroxyl radical, possessing a high oxidation potential (E0 = 2.8 V), exhibits the capability to interact with a wide range of organic hydrocarbons, leading to the complete mineralization of these hydrocarbons by producing water, carbon dioxide, and inorganic salts. Alternatively, it can also transform these compounds into less reactive or aggressive products [44]. Furthermore, the utilization of oil-soluble catalysts such as H2O2 can facilitate the predominant reaction mode from oxygen addition to bond scission in the mechanism process [45]. From figure 4, it is evident that at temperatures below 340 °C, the yield of the liquid fraction remains below 80 vol. %. However, as the temperature increases from 340 to 360 °C, there is a notable increase in the yield. This is attributed to the intensified molecular movements and the averaging of local magnetic fields, leading to increased molecular mobility [46]. The highest design temperature of the reactor was approximately 360 °C, resulting in a maximum liquid fraction of over 96 vol. % with a maximal combined desirability of 1 (to figure 4). This phenomenon can be attributed to the paraffinic composition of Algerian crude oil, which makes it prone to cracking and typically results in a higher yield of total liquid products. Similar observations were made in a study by Golovko et al [47], where they found that the yield of liquid, gas, and solid products depended on the nature of the feedstock and the catalyst amount. They reported that at 450 °C and 10% catalyst, the yield of liquid products was 95%–96% for crude paraffin feedstock and 72% for asphaltenic feedstock [47].
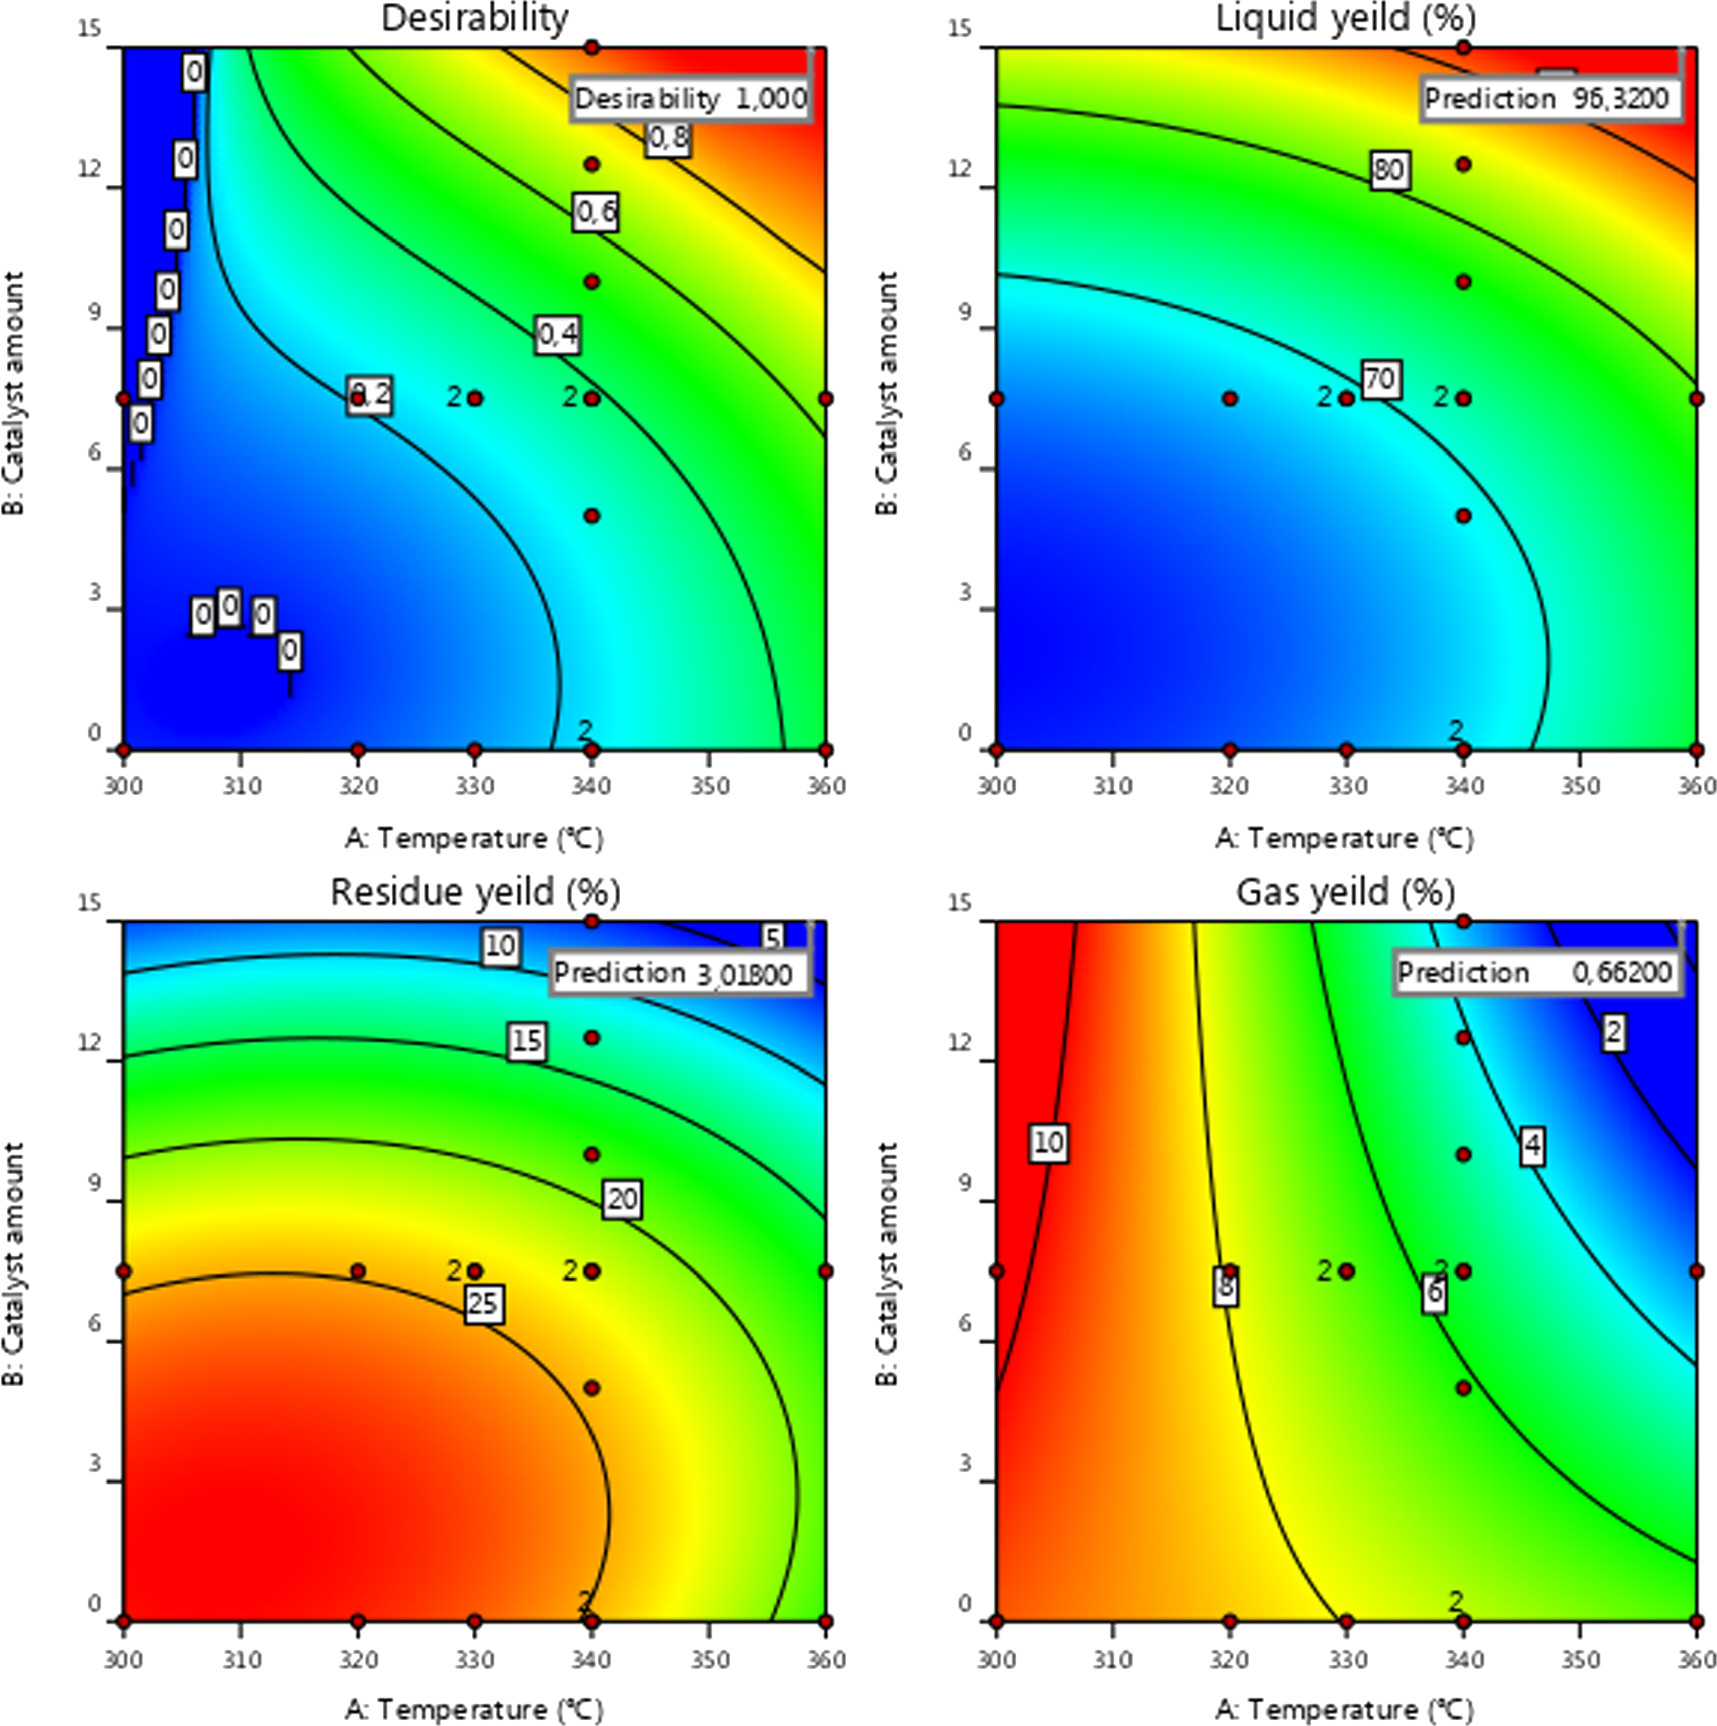
Figure 4. Contour plot relative to the impact of temperature and H2O2 concentration on Liquid, Residue, and Gas Yields.
Download figure:
Standard image High-resolution imageIn contrast, as depicted in figure 4, the gas yield increased with an increase in catalyst amount from 0 to 7.5 wt% at 305 °C, but then gradually decreased with further increases in catalyst amount and temperature from 320 °C to 360 °C. This decrease can be attributed to the subsequent conversion of crude oil into more liquid and solid products. Hydrogen peroxide (H2O2), being a highly effective free radical initiator, plays a significant role in reducing the activation energy required for the initial step of chain reactions. This property enables it to facilitate the formation of hydrocarbon radicals within crude oil. Additionally, hydrogen peroxide accelerates subsequent C–C bond scission reactions, further enhancing its efficacy in converting crude oil to gaseous and light liquid compounds [48]. However, the decrease in gaseous products can be associated with the paraffinic composition of the crude oil used, which leads to the formation of more liquid products [47].
Meanwhile, the solid residue yield gradually decreased as the temperature increased from 300 to 330 °C, and then gradually increased from 330 to 345 °C. As the variable range increased, both gas and solid yield responses decreased gradually. The yield of the solid fraction was higher than that of the gas. This can be explained by the occurrence of pyrolysis, cyclization, and dehydrogenation condensation reactions once the desired temperature is reached and oxygen from the air and the amount of oxidant (H2O2) are consumed. During these reactions, complex aromatic hydrocarbons may transform into resin and/or undergo further oxidation to form asphaltene, with a small portion of hydrocarbon gases due to alkyl side chain ruptures. Consequently, heavy oil components undergo a series of intermolecular interactions such as condensation, aromatization, and dealkylation, resulting in the formation of more complex and higher molecular-weight compounds, thereby increasing the yield of the residue fraction [49]. Another reason for the increase in solid residue yield may be the inhibition of breakdown of high-molecular-weight hydrocarbons present in petroleum by increasing the concentration of the catalyst (H2O2) with air, thereby promoting the conversion of these hydrocarbons into lighter petroleum fractions [50, 51]. Furthermore, resin and asphaltene mostly consist of condensed aromatic rings as their main building blocks, along with fatty parts linked to these rings, complex branching, and a high degree of aromatization. This makes their molecular structure highly polar and susceptible to attack by oxygen, resulting in quick reactions and high activity, particularly at lower temperatures [52, 53].
The oxidative cracking process was conducted under optimal conditions (14.78 wt% of H2O2, 2 l min−1 air, 100 ml of crude oil at 354. °C) to validate the proposed statistical model solutions and determine the actual corresponding yields. The resulting actual liquid yield achieved 96.07 vol. %, closely matching the theoretical liquid yield, thus confirming excellent agreement. This alignment was further evidenced by the arrangement of data points representing predicted and actual values (figure 4).
3.4. Proprieties of produced liquid phase
The values for different parameters such as density, viscosity, and sulfur content obtained for the oil samples as a function of temperature are presented in figure 5. Under the same reaction conditions, it is observed that as the temperature rises, the oil viscosity decreases. However, this decrease occurs at a diminishing rate, gradually slowing down over time. For example, at 80 °C, the viscosity of the resulting crude oil after the reaction was 3.61 cst, and it rapidly drops to 1.85 cst at 300 °C, representing a decrease of more than 50%. Then, the reduction of viscosity slows down gradually. As shown in figure 5(a), when the temperature increases to 360 °C, it drops to 1.048 sct, indicating good fluidity of the oil. This can be attributed to the expansion of crude oil volume due to the rising temperature, which increases the distance between molecules and potentially weakens their interaction strength. Moreover, at high temperatures, certain hydrocarbons within the initial crude oil can transition from the liquid phase to the gas phase through volatilization, contributing to a reduction in crude oil viscosity and lowering overall flow resistance [54]. This phenomenon may be related to the good diffusivity and mixing of the air/H2O2 system in crude oil at relatively high temperatures [55]. Additionally, figure 5(b) clearly indicates that the crude oil density declines as the temperature increases, likely due to the volatilization of certain components within the crude oil at high temperatures.
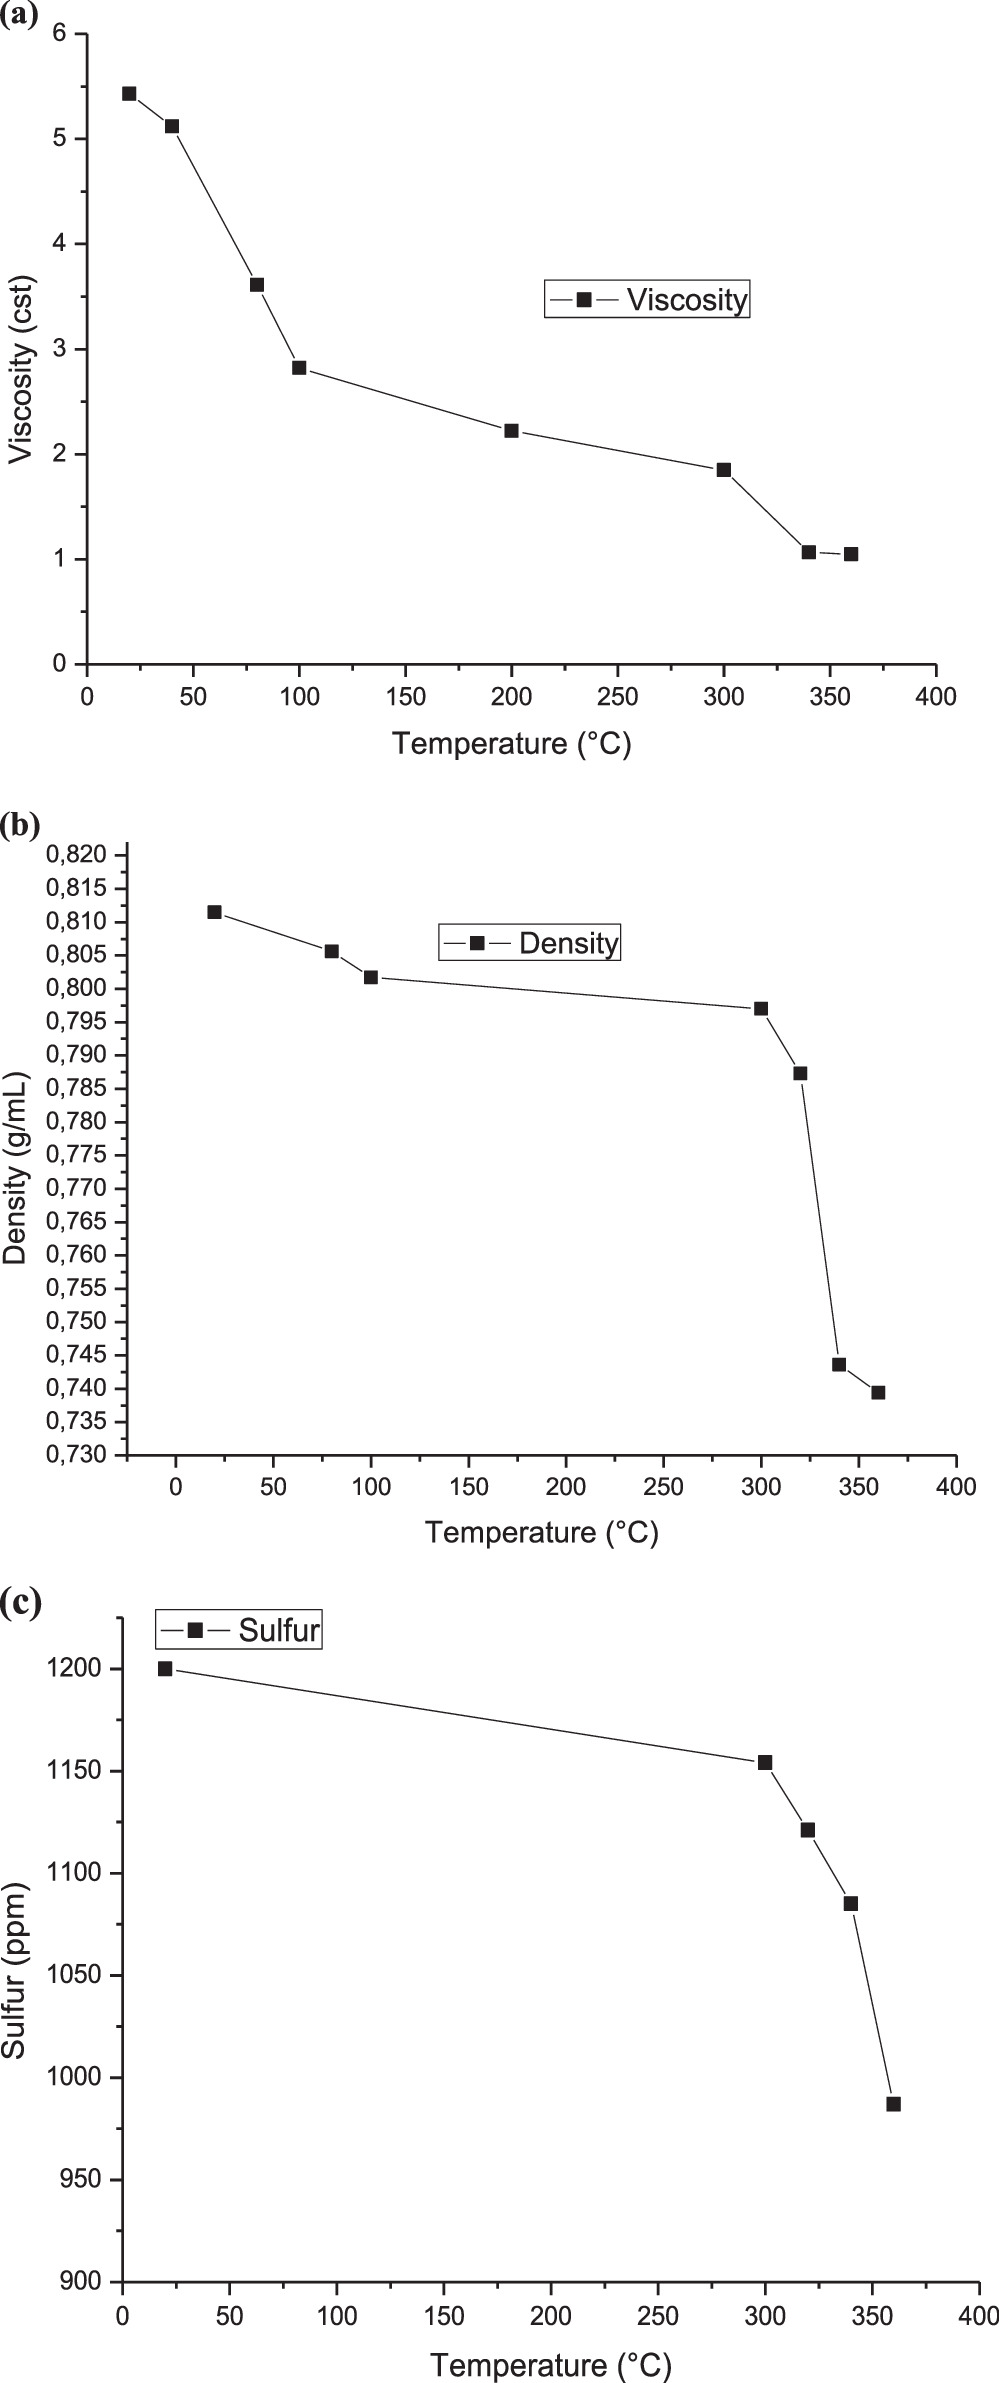
Figure 5. Temperature relation of produced oil with (a) density, (b)viscosity and (c) sulphur-content.
Download figure:
Standard image High-resolution imageThe sulfur content in crude oil decreased from 1200 ppm to 987 ppm. This reduction may be attributed to the conversion of total sulfur into different compounds, potentially involving the production of H2S through the thermal cracking of the oil at elevated temperatures. Similar phenomena have been observed by other authors [23].
Table 3 illustrates the changes in the oil properties subjected to the oxidative cracking process described earlier, which involved the use of air/H2O2. The data in table 3 shows that the values of density, specific gravity, viscosity, and kinematic viscosity assayed refer to light crude oil and are non-sulfurous. The analyzed oil exhibits negligible levels of water content and sediment content. However, the oil's total acid number (TAN) is relatively high, likely owing to the presence of carboxylic acid groups, which adsorb strongly onto the carbonate surface by displacement of water [55]. Metal concentrations increase in the following order: Na > Fe > Ca > Mg > Mo > V > Pb > Ni > Zn for the virgin crude oil. The levels of Na, Fe, and Ca were relatively high, indicating that the Algerian crude oil may contain salts, while the Fe content may be attributed to the presence of products generated from equipment corrosion [56]. From table 4, the Kw (KUOP) or Waston factor values of untreated and treated Algerian crude oil are 12 and 12.55, respectively.
Table 3. Crude oil and produced oil physicochemical properties.
| Proprieties | Analysis method | Crude oil before oxidation | Produced oil after oxidation |
|---|---|---|---|
| Density at 20°, g/cm3 | ASTM D 4052 | 0.8115 | 0.7394 |
| Kinematic viscosity at à 37.8 °C (cSt) | ASTM D 445 | 5.43 | 1.073 |
| Acid number, mgKOH/g | ASTM D7304 | 0.963 | 0.996 |
| Refractive index, nD 70 | ASTM D 1747 | 1.5469 | 1.5127 |
| Flash point,°C | ASTM D | <−5 | <−5 |
| Freezing point,°C | −54 | −51 | |
| Pour point,°C | ASTM D 97 | −51 | −45 |
| Carbon residue, w% | ASTM D 4530 | 2.56 | 3.92 |
| Ash conten, w% | ASTM D 482 | <0.002 | — |
| Wax content, w% | SH/T 0425–2003 | 2.8 | 2.7 |
| Sulfur content, ppm | ASTM D4629 | 0.1 | 1200 |
| Water content, w% | ASTM D4006 | 0.1705 | 0.1843 |
| Salinity, ppm | ASTM D 3230 | 40 | 37 |
| KUOP | ASTM UOP375–07 | 12 | 12.55 |
| SARA, w% | ASTM D2007 | ||
| Saturates | 73.12 | 79.03 | |
| Aromatics | 19.19 | 17.43 | |
| Resins | 7.33 | 3.42 | |
| Asphaltenes | 0.36 | 0.12 | |
| Metals content, μg/g | |||
| Fe | 21.8 | 21.8 | |
| Ni | 1.7 | 1.4 | |
| Cu | <0.1 | <0.1 | |
| Zn | 0.4 | 0.4 | |
| V | 1.1 | 1.1 | |
| Mo | 1.3 | 1.1 | |
| Pb | 1.2 | 1.1 | |
| Mg | 4.6 | 4.5 | |
| Ca | 15.7 | 15.2 | |
| Na | 24 | 23 |
Table 4. Hydrocarbons group found produced liquid phase and crude oil.
| Compound | Virgin crude oil(wt%) | Produced oil (wt%) |
|---|---|---|
| nC1 | 0 | 0 |
| nC2 | 0.03 | 0.09 |
| nC3 | 0.44 | 1.59 |
| Cyc-C3 | 0 | 0 |
| iC4 | 0.33 | 1.18 |
| nC4 | 1.4 | 4.59 |
| neo-C5 | 0 | 0 |
| iC5 | 1.04 | 3.49 |
| nC5 | 1.64 | 5.02 |
| C6 group | 3.28 | 8.97 |
| M-Cyc-Pentane | 0.63 | 1.37 |
| Benzene | 0.56 | 1.09 |
| Cyclohexane | 0.7 | 1.48 |
| C7 group | 3.64 | 8.33 |
| M-Cyc-Hexane | 1.66 | 3.42 |
| Toluene | 0.55 | 1.07 |
| C8 group | 4.63 | 8.85 |
| Ethylbenzene | 0.26 | 0.16 |
| M-and P-Xylenes | 0.89 | 1.43 |
| o-xylene | 0.33 | 0.44 |
| C9 group | 4.1 | 6.02 |
| 1,2,4TM-Benzene | 0.74 | 0.86 |
| C10 group | 4.39 | 6.18 |
| C11 group | 4.36 | 4.96 |
| C12 group | 4.04 | 3.4 |
| C13 group | 4.05 | 3.4 |
| C14 group | 4.11 | 2.93 |
| C15 group | 3.33 | 2.3 |
| C16 group | 3.36 | 2.05 |
| C17 group | 3.12 | 1.77 |
| C18 group | 3.03 | 1.57 |
| C19 group | 2.93 | 1.43 |
| C20 group | 2.57 | 1.17 |
| C21 group | 2.49 | 1.07 |
| C22 group | 2.35 | 0.95 |
| C23 group | 2.21 | 0.85 |
| C24 group | 2.04 | 0.79 |
| C25 group | 1.95 | 0.69 |
| C26 group | 1.78 | 0.61 |
| C27 group | 1.72 | 0.57 |
| C28 group | 1.64 | 0.52 |
| C29 group | 1.54 | 0.48 |
| C30 group | 1.45 | 0.44 |
| C31 group | 1.37 | 0.40 |
| C32 group | 1.27 | 0.33 |
| C33 group | 1.21 | 0.32 |
| C34 group | 1.26 | 0.28 |
| C35 group | 1.15 | 0,39 |
| C36+ | 8.43 | 0.17 |
| Total | 100 | 100 |
The results of SARA analysis (table 4) indicate that this crude is mostly composed of saturates (73.19 wt%) and aromatics (19.28 wt%). According to the data in table 4, the resulting oil produced after oxidative cracking using air/H2O2 has a density of 0.7956 g cm−3 and a viscosity of 1.69 mPa at 20 °C. Additionally, the produced oil contains up to 96% of saturates and aromatics, with the saturate hydrocarbon content notably higher than that observed in the virgin crude oil.
The obtained distillation data of the narrow cuts are presented in table 1 (see supplementary information) and show that the temperature efficiency of the oil increases and its cumulative volume percent grows after the oxidative cracking process. It is interesting to note that the yield of the distillate fraction sharply rises at 40 °C, which is associated with the production of light hydrocarbons during the oxidative cracking of high-molecular-weight hydrocarbons present in crude oil. Similar trends were noted during the distillation of several crude oils [30]. From table 3, it can be observed that the density, refractive index, and characterization factor KUOP increase with increasing temperature of narrow-boiling range petroleum fractions. However, it is found that the density and refractive index decrease for the narrow cuts of treated crude oil via oxidative cracking using air and H2O2.
3.5. Analysis of hydrocarbon groups in oil samples
GC-chromatograms offer a descriptive fingerprint of the primary components present within the oil [57]. Figure 6 clearly demonstrates that the GC-chromatograms of treated and untreated crude oil are dominated by resolved hydrocarbons, largely composed of n-alkanes and their isomers. The n-alkanes of the samples mainly distribute in a carbon range from n-C2 to n-C36. The detection of n-alkanes within the carbon range of C9 to C13 typically suggests the existence of volatile compounds, indicating a reduced level of weathering and degradation in the sample. A slight increase in the peak intensities of light paraffins (C2-C22) and a decrease in heavy saturate molecules (C25-C35) in the GC-chromatogram of the treated oil were observed. The samples also contain aromatics such as benzene, toluene, and xylene. Upon careful scanning of the chromatogram, no carboxylic acids or other oxygenated compounds were identified in the analysis. Comparable findings were reported in the study conducted by Shvets et al in 2017 [58]. Table 4 summarizes the hydrocarbon group analysis results as well as the percentage composition. The crude oil samples exhibit an abundance distribution of n-alkanes between C2 -C36 before and after treatment via oxidative cracking process using air injection and H2O2. The most significant acyclic hydrocarbons identified were M-cyc-pentane, cyclohexane, and M-cyc-hexane, representing 3.05% of the total Algerian crude oil composition and 4.59% of the total composition of the produced oil by the proposed process. BTX-based compounds and their alkyl substituted compounds were detected in the crude oil samples. As observed from table 4, there was an increase in the weight percentage of light hydrocarbons from C2 to C11, with a mass percentage of 70.59% compared to 35.6% in untreated crude oil. This phenomenon may be ascribed to the process of cracking heavier compounds, resulting in the formation of lighter components, particularly when air injection and H2O2 act as oxidants. Another reason for composition changes in this study is the generation and accumulation of numerous highly reactive free radicals during oxidation, as suggested by Sarma et al (2002) [59]. This leads to the opening of exothermic reaction pathways, resulting in the generation of highly reactive free radicals. It is believed that catalysis is associated with these highly reactive free radicals, thereby enhancing the quality of the obtained liquid fractions.

Figure 6. GC–chromatograms for hydrocarbon analysis of (a) untreated crude oil and (b) treated crude oil by oxidative cracking using air and H2O2.
Download figure:
Standard image High-resolution image
These heavy macromolecules, such as asphaltenes and resins, contain stable free radicals generated from the breaking of chemical bonds in molecules as a consequence of catalytic cracking, in addition to the radicals formed when H2O2 decomposes [30, 60–62]. High-molecular-weight radicals could potentially combine with fragments of petroleum molecules, which are radicals generated from the cracking process, as depicted in the proposed mechanism:
-Initiation and propagation


-Chain transfer:


-Chain termination of


These results indicate that the proposed oxidative cracking via H2O2 and air injection could slightly decrease the crude oil density and efficiently decrease its viscosity and sulphur content. Simultaneously, the total production of light hydrocarbons increases as a result of the decomposition of heavy molecules.
4. Conclusions
In this study, we focused on the application of air injection with H2O2 as a catalyst for the oxidative cracking of crude oil. The influence of operating parameters such as temperature and catalyst amount, at constant pressure, on the yields of produced liquid oil, residue, and gas phases as responses were investigated using response surface methodology. The maximum yields of produced oil, residue, and gas product of 96.32%, 3.018%, and 0.662%, respectively, were obtained at optimal parameters of 14.78 wt% of H2O2, 2 l min−1 air gas, 100 ml of crude oil at 354.05 °C for 40 min. By comparing the GC-spectra of the untreated and treated crude oil by the proposed process, significant chemical changes were detected. This process has been effective for reducing the concentration of heavier hydrocarbons, density, viscosity, and sulphur content in crude oil, and it enhances the oil's fluidity, effectively transforming its quality in situ. The proposed oxidative cracking process has been accompanied by the rise of the concentration of light components (C2-C11) with 70.59% and 29.41% of C12-C36. Analysis of the liquid fraction properties under these optimal conditions revealed favorable characteristics of the crude oil treatment, holding high-quality value. The proposed methods outlined in this work hold promise for aiding future research activities and practical implementations in Enhanced Oil Recovery (EOR) within the petroleum and gas industry.
Data availability statement
No new data were created or analysed in this study.
Author contributions
ON: Experimentation, Methodology, Investigation, Formal Analysis. SHM: Writing Original Draf, Analysis, Funding Acquisition, Review and Editing. BH: Supervision, Funding Acquisition, Funding Acquisition Resources and Validation and Methodology.
Declarations
Conflict of interest
The authors state that they have no competing interests to declare.
erxad3cb8supp1.doc (0.3 MB DOC)