
Abstract
The concept of digital transformation has become increasingly significant with advancements in technology. In this study, digital transformation design and implementation were performed in a tire production plant to improve the product and energy efficiency for sustainable production. Initially, production data were obtained by implementing Shop Floor Control infrastructure. In the second stage, a Manufacturing Execution System (MES) was placed on the upper layer and connected to Enterprise Resource Planning (ERP) software on the top layer. Cloud database technology was used for the MES and ERP layers, with servers located outside the plant and a side-to-side VPN providing a plant network connection. The automation architecture was designed for the end-to-end monitoring of the entire production site and was applied to the Banbury Unit. The performance data of the system were compared in terms of energy efficiency, product efficiency, and overall efficiency. The Banbury unit was used 15% more efficiently, recovering 2.4 MWh of energy daily with the proposed system. Additionally, the scrap product rate decreased by 5%, resulting in an annual cost recovery of $39,500.
Export citation and abstract BibTeX RIS

Original content from this work may be used under the terms of the Creative Commons Attribution 4.0 licence. Any further distribution of this work must maintain attribution to the author(s) and the title of the work, journal citation and DOI.
1. Introduction
Nowadays, digital transformation is a frequently discussed concept. Actually, the concept of 'digital transformation' is not new; it started to bediscussed in the 1990s and became a reality in the 2000s. In a narrow sense, 'digital transformation' refers to the concept of 'going paperless' which affects both private businesses and governments and all segments of society, such as the communities of communication, art, medicine, and science [1]. Studies of digital transformation and its applications have gained momentum and interest in this field has been increasing in recent years [2]. Yli-Ojanperä et al explored the potential benefits of Industry 4.0 by searching the literature for information on the fundamental developments that researchers will follow in the coming years. They suggested that there are five paradigms that have to be considered: the Internet of Things (IoT), Cyber Physical Systems (CPS), Information and Communication Technology (ICT), Enterprise Architecture, and Enterprise Integration within Industry 4.0 [3].
Digital transformation provides various functions for consumers, executives, and many people affected by the industry in such a way as to cover many areas and achieve efficiency enhancement [4]. This issue has been discussed with increasing popularity and enthusiasm, and the concepts it covers are still being developed. Although new digital technologies will transform many industries, some challenges require further exploration and research [5]. Xu et al examined recent research on Industry 4.0 from an industrial perspective. Industry 4.0 provides researchers with a new perspective by focusing on industrial applications, highlighting the challenges and possible research opportunities for industrial researchers [6]. Xu had previously examined the latest developments in the field of industrial enterprise information systems using various techniques, and talked about the integration of internal industrial systems which are isolated from each other through new technologies. It was emphasized that the new technologies used would play an important role in the near future [7]. Challenges are inevitably encountered in the transition to digital transformation to provide mobility and full-time monitoring [8].
Digitalization is not easy for businesses that have so far survived with non-digital structures and management. Companies either strive or disappear, and companies that face the danger of extinction are heading for digitalization [3]. Nwaiwu recommended an academic approach regarding the general understanding of digital transformation [9]. Chong et al discussed the conceptual framework of digital production [10]; Araujo provided information about the digitalization approach of companies [11], and Kim tackled CPS research issues associated with recent IT trends. How industries apply these technologies has also been examined [12]. Tyler emphasized that digitalization is not just about using new approaches and that it is necessary to create a strategy that centralizes employees for successful digitalization [13]. Reinhardt et al used the example of Ireland to evaluate the global impact of Industry 4.0; participants' awareness of Industry 4.0 was measured using a questionnaire method to obtain information from enterprises about the Industry 4.0 adoption level, the way planned for the future, and new projects in which technological developments will be implemented. The awareness of the participants working in the departments related to automation was higher than that of all other participants. Therefore, the importance of working with employees who have sufficient knowledge about the methods and principles of the technology to be applied wasemphasized [14].
Studies on digital transformation in the literature are primarily conceptual designs and predictions. A limited number of studies have been performed for industrial applications. In this study, the contributions of digital transformation to industrial facilities were handled in practice and performance data were obtained accordingly. In this context, a digital transformation design and its application to a Banbury mixing unit are proposed in the tire production process. The tire manufacturing industry is also undergoing digital transformation driven by technological advancements, changing consumer demands, and competition. This transformation aims to enhance efficiency, offer personalized products, leverage data insights, enable predictive maintenance, promote sustainability, and gain a competitive edge. By embracing digital technologies, tire companies can improve operations, customer experiences, and innovation, leading to long-term success. The following points emerged from the study:
- Digital transformation was successfully implemented for energy-intensive production.
- Cloud-based ERP and MES systems were established, to streamline operations.
- An effective recipe management structure was created through digital transformation.
- Overall equipment effectiveness improved by 33%, converting an average of 2.4 MWh of energy per month into work.
- A cost saving of $39,500 was achieved.
The proposed digital transformation system design stages are discussed in Digital Transformation section and the data obtained from the application and performance analysis are discussed in the Result and Discussion section. The findings obtained by performance analysis, especially the contributions of the digital transformation to tire manufacturing industry, are presented in the conclusion section.
2. Tire manufacturing
The tire manufacturing industry plays a crucial role in the global economy, contributing to employment, revenue generation, and international trade. Advancements in technology have led to automation and digitalization, improving efficiency and product quality. Companies are increasingly focused on sustainability and energy efficiency to reduce their environmental impact. The interconnected nature of the industry fosters international trade. Tires are essential components in various sectors, making the demand for tires an indicator of economic health. Overall, the tire manufacturing sector is a key player in various markets worldwide, driving economic growth and technological innovation.
2.1. Tire manufacturing process
The tire manufacturing process consists of various stages, involving different machines and systems from raw material input to the final tire output. However, the process relies heavily on labour-intensive methods, leading to numerous efficiency issues. To address these challenges, it is crucial to establish traceability in the production process. Figure 1 presents a general overview of the tire manufacturing process stages.

Figure 1. General Overview of the Tire Manufacturing Process Stages.
Download figure:
Standard image High-resolution imageThe process begins with the entry of natural rubber, synthetic rubber, performance-enhancing chemicals specific to tire types, carbon, and other raw materials into the warehouse. Some rubber materials require 24 h in a warm room to become production ready. The prepared chemicals and raw materials are then fed into the Banbury mixer, and the resulting compound is analyzed in the laboratory.
Next, the compound from the Banbury mixer is drawn according to specific parameters of thickness, width, and length, depending on the tire molds. The ready tread and sidewalls are cut on the basis of predefined recipes. The compound is then fed into the extruder machine, which is referred to as the head. The compound passes through a moldthat varies depending on the tire size, creating the pattern. The compound moves on a conveyor line, and dimensional information is painted onto it. The first weighbridge measures one meter of the compound from the head to calculate the desired tread weight on the exit weighbridge. This ensures adjustments for the desired outcome.
The next step involves cutting the tread based on specified parameters. If the product does not meet the desired length at the end of the line, it falls into the recycle position, and the operator makes this decision. Cooling in a pool is necessary to minimize the stretching effect and maintain the desired tread length after cutting. The tread then goes to the final control weighbridge, where its weight is measured, and the data is visually checked.
In calender machines, the compound is applied to the cord thread, whereas in the bead machine, the compound is applied to the metal piece used for tire rims. The Orbit produces the compound for wrapping various layers of tread onto a conveyor belt, primarily for larger-sized tire machines.
In the bias machine, the coated cord fabric from the calender is cut at specific angles, and all these components are joined together in tire manufacturing machines to form the green tire. The green tire is then molded using various molds in presses, resulting in the final form of the tire. Quality control is performed on the product. In the cold application section, a specially patterned tire tread produced externally is adhered to the cured tire using a special technique and undergoes another curing process.
2.2. The banbury process
The Banbury system is a unit in the first stage of tire manufacturing. Raw material dosing, mixer and batch-off units form the Banbury system. The raw material dosing system consists of carbon, oil, and polymer dosing and auxiliary powder chemical dosing. Weighed carbon, oil, polymer, and chemical bags are automatically put into the mixer according to the recipe values. The raw materials are then mixed in the mixer. The compound obtained from the mixer is transferred to the batch-off section. If the last compound is not the final stage compound, it is returned to the mixer. These processes are repeated until the final stage of the work order is reached. The compound is sent and processed on other machines in the factory [15]. The modelling of the Banbury unit outlined above is shown in figure 2. The Banbury system consists of carbon dosing (1), oil dosing (2), carbon bags (3), mixer (4), batchoff (5), and polymer and chemical dosing (6). Carbon and oil dosing silos are located at the top of the system. The weighing conveyor and inlet cover of the mixer are on the middle floor. Chemicals are released from the weighing conveyor into pre-weighed bags. These bags are filled according to the work order recipes. Precision weighing is performed in this process.

Figure 2. Banbury unit modeling.
Download figure:
Standard image High-resolution image2.2.1. Carbon black dosing
In the dosing system, carbon is unloaded to the carbon black dosing scales by the dosing conveyors from the Bigbag unloading units and is then forwarded to the mixer. Carbon black is important for achieving the black color of the tires. The type of carbon black used can differ based on the recipes. Any error in the carbon dosing section affects the tire. Overdosing or use of the wrong carbon type can cause the product to be scrapped.
2.2.2. Polymer and chemical bag dosing
The mixer has three conveyors. One of them is a weighing conveyor, one is a transfer conveyor and the third is a transmission conveyor. The weighing conveyor has loadcells a linked control screen. The polymer and chemical bag raw material codes and weight set values required in the recipe are displayed on the screen and the operator places the raw material on the weighing plate. If the materials placed are within the tolerance values and the weighing of all the components related to that conveyor is completed, they are transferred to the transfer conveyor and the next raw material and set value are displayed on the screen. However, it is the operator's responsibility to monitor tolerance and manipulate the system.
Chemical bag inputs are also checked in the weighing conveyor. Packaged chemicals are created by packing specific chemicals based on relevant recipes in the chemistry room before they are delivered to the weighing conveyor. The chemicals are weighed and placed into the bag according to the set tolerance values. This process is performed manually. On the weighing conveyor, the chemical bag specified in the recipe must weigh the set weight value. The screen shows the operator which chemical bag should be taken and the bag information. The tolerance can also be manipulated here. Currently, accuracy control cannot be achieved for both raw materials. There is no barcode control or other control mechanism. The proposed system is intended to overcome these problems. The transfer conveyor is used to transfer more compounds to the weighing conveyor after the intermediate products enter the mixer.
2.2.3. Oil dosing
Oil dosing to the mixer is performed through the main oil stock and intermediate oil stock tanks. An Oil Dosing Pump is located under these tanks. The oil dosing process is performed on the dosing scale by these pumps and the Dosage Valves located on the Oil Dosage Cabinet and it is then discharged to the mixer. The compound semi-product obtained from Banbury consists of chemicals, polymer, and carbon and oil raw materials. The raw materials, which will be subjected to the processes and mixed at the rates stipulated in the recipe, are mixed in the mixer and the desired compound is obtained.
3. Digital transformation design
In this design, the principle of establishing a similar hierarchical structure as that specified on the ISA-95 automation pyramid was adopted [16]. To summarize the pyramid, the data from the field are collected using devices such as sensors and indicators and transferred to the PLC system in the first stage. SCADA shows the PLC values from the field. In the upper layer, the MES system integrates with the SCADA and PLC layers. In the top layer, the ERP system is connected to the bottom layers. The intention was to achieve objectives such as reducing wastage, ensuring end-to-end traceability, active recipe structures, high efficiency, effective supply chain management etc, through the integration of SAP ME/MII (Manufacturing Execution/Manufacturing Integration and Intelligence) in the MES layer. Operators communicate with the SAP system via ME/MII software using production front ends. This front ends, which facilitate the work of users at every point, are integrated with the data from the field. They also enable operators to initiate a work order, monitor and control production phases, enter wastage entry and submit a production confirmation.
3.1. ME/MII integration
In the proposed system design, the compound recipe data of the machines, product trees, raw material details, raw material warehouse entry management, and planning data are stored in the S4/HANA database in the SAP ERP system. The enterprise's R&D unit enters the recipes over ERP and makes necessary updates again over ERP. In addition, the calculation and control of the raw materials that are needed during planning can be done more accurately because of the active recipe structure available on ERP. In the MI/MII layer, process, operator, field, machine, and operation data are managed. Figure 3 shows the system setup.
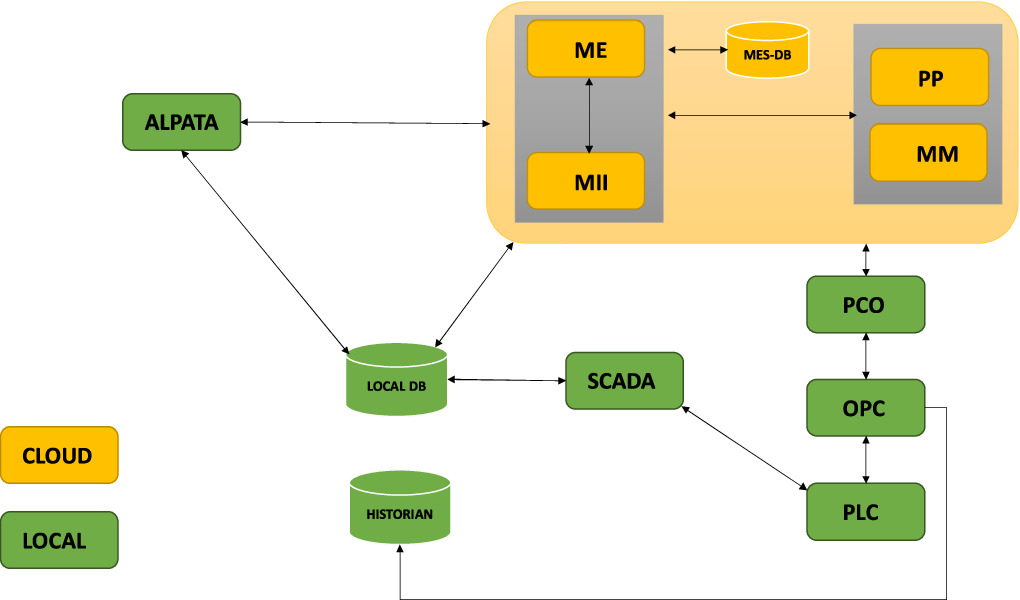
Figure 3. Designed system setup.
Download figure:
Standard image High-resolution imageIn the structure, the product recipes that are kept in the SAP ERP layer on the cloud are written directly to the PLC using ME/MII. ME/MII uses the PCo (Plant Connectivity) tool on the OPC server to write data to the PLC. SCADA provides traceability of the current unit and shows the operators the live status on machine schematics. No product recipe is sent via SCADA when the SAP systems are running.
In the ME/MII layer, data are stored in the SAP S/4 HANA database available inthe cloud. The Historian database is also defined, and instant field data are collected in the PCo/OPC local database. The Historian database keeps data such as instant pressure and temperature locally. These types of instant machine analog values are not transferred to the S4/HANA database on the cloud.
The function of SCADA on the structure is to show real-time data of the system to operators and download a recipe to the PLC in case the ME/MII is disconnected.For SCADA to perform this operation, updated recipe data are stored on a database available on the enterprise network. For this purpose, as soon as the recipe data are changed in the ME/MII layer, relevant data are also written to the database available in the local environment by synchronizing with the local network. In this way, the machine can be operated even when there is no ME/MII connection. In case there is a problem of network connection to the systems running on cloud servers or such systems cannot be connected for any reason, previous work orders can be operated without the need for a cloud connection. Thus, systemic dependencies are minimized. With the alternative recipe and product tree setup in this structure, recipes that need to be tracked in raw material variations are managed and raw material effects can be tracked as well.
3.2. Cloud structure
In the designed system, the servers on the cloud are connected to the factory network by side-to-side VPN. Both the factory network and the cloud network are on the same layer. The security gaps between the two networks are minimized with firewalls installed between them.
The cloud structure is built on three layers: the DEV (development) layer, the QA (test) layer and the Prod (live) layer. The DEV is the system where developments are made, the QA is the system where the developed applications and data are tested, and the Prod is the system where the live version is installed. Of these layers, the DEV layer is installed first. Then the QA is installed next to the DEV when the operations there are completed. The Prod layer is installed after the tests are completed. As a result, all three layers operate simultaneously. In this way, the software and the developments made do not affect the live environment. New developments follow this sequence and become part of an application in the live environment.
All three layers include an S4/HANA database. This is the server on which the database operates. Again, each layer includes one S4/HANA application and an MII application server. Applications run on these servers and users cannot directly connect to the database. However, they can connect through these servers to perform the defined operations. Thus, database security is provided with a layered structure.
3.3. Recipe structure and dynamic optimization
Many data are collected within the MES system operating in the Banbury mixing unit. The structures in the system work in harmony and are integrated with each other. The most important reason for this is the efficient use of the data pool known as 'big data' in the literature. This data pool contains 156 product tree recipes, 256 recipes when sub-product levels are included, and 430 recipes when all sub-levels and revisions are included. The system recipe structure is shown infigure 4. The main recipe structure and the working order recipe in the machine are separated. Authorized personnel can intervene in the working order machine recipe.
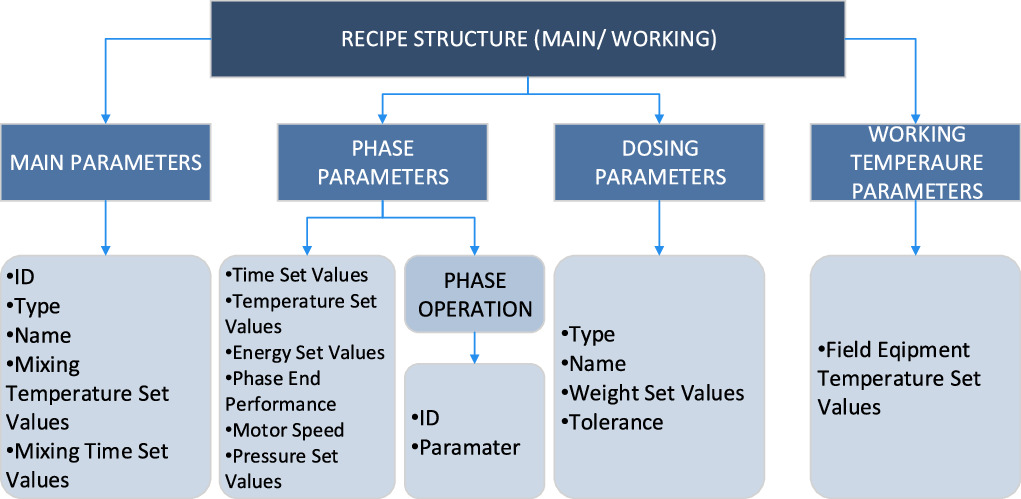
Figure 4. Recipe Structure.
Download figure:
Standard image High-resolution imageRecipe product trees are maintained in the ERP layer, machine recipes are maintained in the MES layer, and revisions are made. A live recipe can be implemented according to the quality of the data. The data in the production reports, test results, and employee prescription data are analyzed, and any necessary interventions are made based on the employee prescription. Only the running recipe is updated, and the master data are not changed. Thus, a dynamic recipe structure has been created.
It is essential to follow up whit the raw materials defined in the recipes for correct consumption. Therefore, it is necessary to follow the raw materials from their entrance into the warehouse to their consumption in the machine. Raw material goods' entry and exit movements, production area warehouse data, the number of rubber baskets entering the hot room and tracking data of entry and exit times, raw material consumption data managed by the barcode system in the machine, and consumption confirmations are the data that the raw material management includes in the large data pool.
Quality data, such as linking the blends produced by the test results from the laboratory, also feed this big data pool. In addition to quality tests, data such as pressure and temperature, which concern quality, production, and maintenance and are critical to follow, are stored on a Historian database. Analog signal data from 29 different sensors were collected and included in the data pool. Based on all these feedbacks, machine parameters can be accessed remotely, instant interventions can be made and their records are kept.
Reporting of the products produced is also a task in itself. Reports based on field data, such as batch reports, weighing reports, reporting of data collected about machine operation, reports of stops and malfunctions, and personnel movement reports are created in the PLC and delivered to the upper layers. Based on these reports, machine efficiency, OEE data, and personnel efficiency reports are created. Each report is accessible through the MES system. These data, which are used in the relevant layers of the automation pyramid, can be traced retrospectively and extracted from the big data pool. By analyzing the collected data retrospectively, the efficiency of the system and the process is increased.
It is ensured that standard mixing times are created and updated by analyzing the retroactive mixing times. When the standard time is exceeded for any reason which might occur in the machines, this situation is detected and an intervention in the recipe takes place. Instead of theoretical standard mixing times calculated on paper, the productivity of the machines and operators is calculated with higher accuracy using the standard mixing times created according to the analyzed big data.
Because the ambient temperature is different in summer and winter, the operating temperatures of the machines are also different. Whereas mixing times are longer in machines thatare warmed up later in winter, production is done with shorter mixing times in summer. Instead of the standard theoretical mixing times which are determined by the estimation method but sometimes cannot be entered into the recipes, optimal standard recipe data which change periodically according to the ambient temperature, are obtained. This situation occurs with the analysis of the collected data, and it continues to be a living structure. A similar situation exists in the process of keeping factors such as the duration of the rubber in the warm room and the room temperature at the optimal value.
3.4. Automation structure
Before the digital transformation, three separate PLCs were used in each of the three main parts of the system and no programmatic integrity existed. In the proposed automation design, a single PLC was used for the three main sections of the Banbury unit. Existing IO modules were still used in addition to the new modules added. The number of remote stations increased from four to nine. The hardware architecture is shown in figure 5.
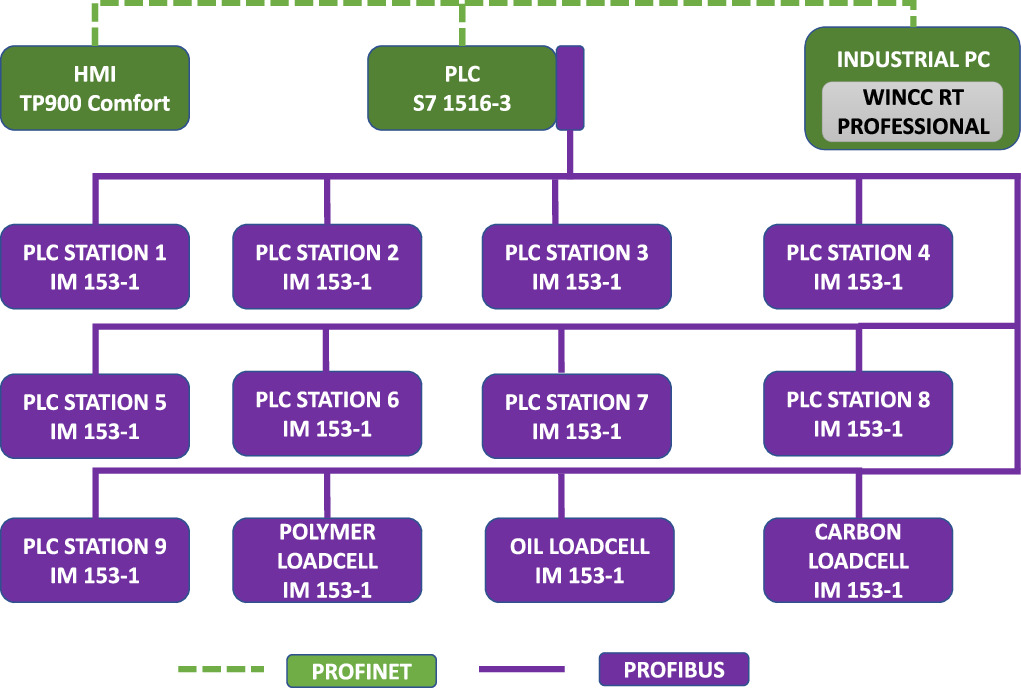
Figure 5. Automation hardware architecture.
Download figure:
Standard image High-resolution imageThe flowchart presented figure 6 shows, rubbers, chemicals or semi-products, carbon, and oil are weighed and recorded to the data read from the recipe in three different stages. Banbury recipe management is under the control of the ME/MII system. The recipes entered from SAP are sent to machine stations with work orders sent fromSAP. The recipe of a work order which is in order is automatically written on recipe data blocks in the PLC.
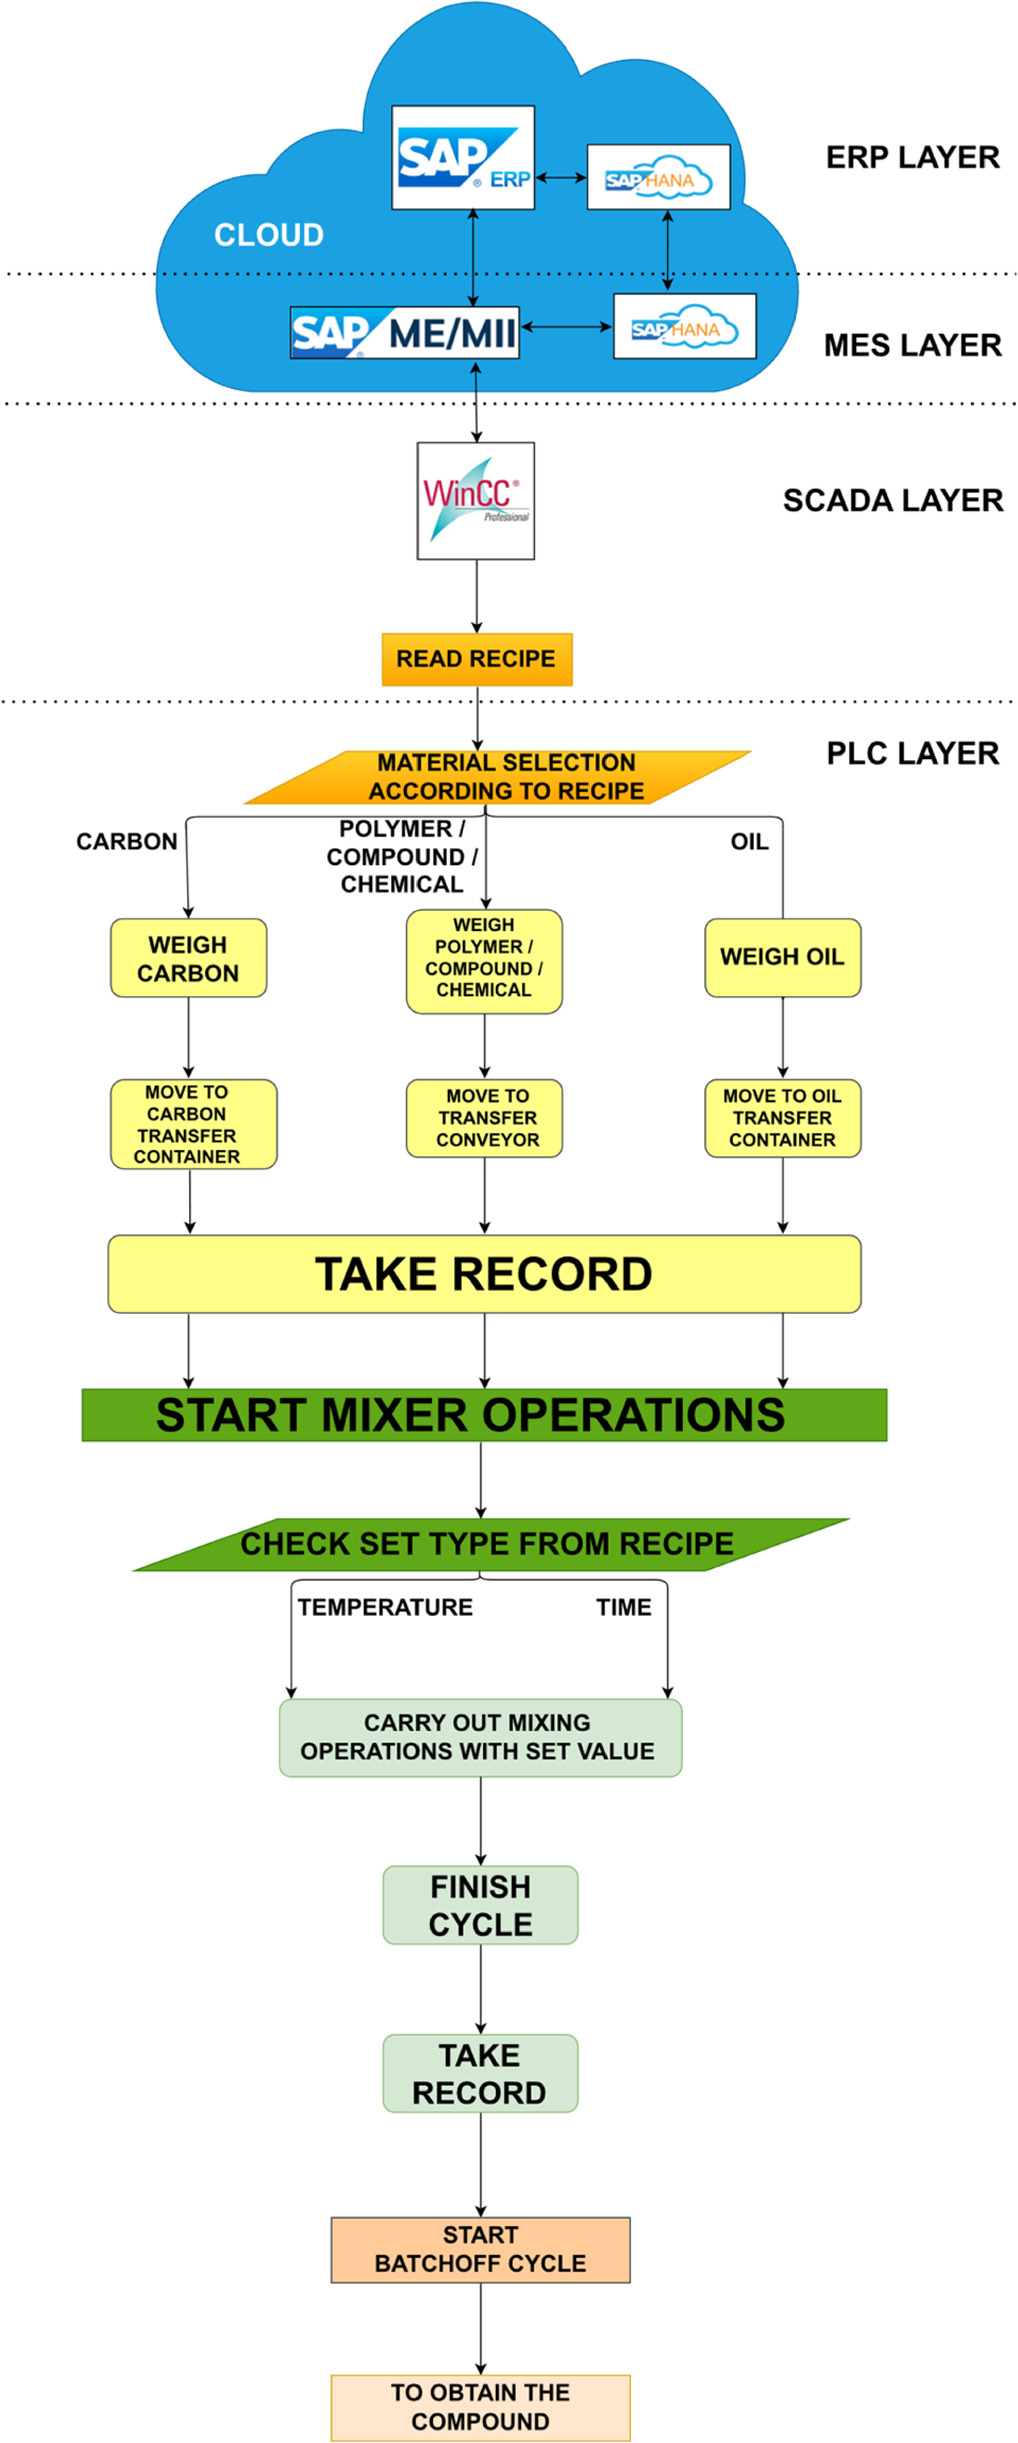
Figure 6. Flow chart of the system.
Download figure:
Standard image High-resolution imageIn the case of trying to start another work order instead of the next work order, or when the ongoing work order is interrupted and a new work order is desired, the work order which the operator chooses can be started. The alternative recipe structure of the SCADA system is used subject to authorization in cases when the MES system is disabled. SIEMENS TIA Portal-WinCC Professional V15.1 was used as the SCADA software. The SCADA screens of the Banbury system are shown in figure 7. The SCADA system maintains the Alarm, Trend, Recipe, and Report records and reports requested to the cloud.
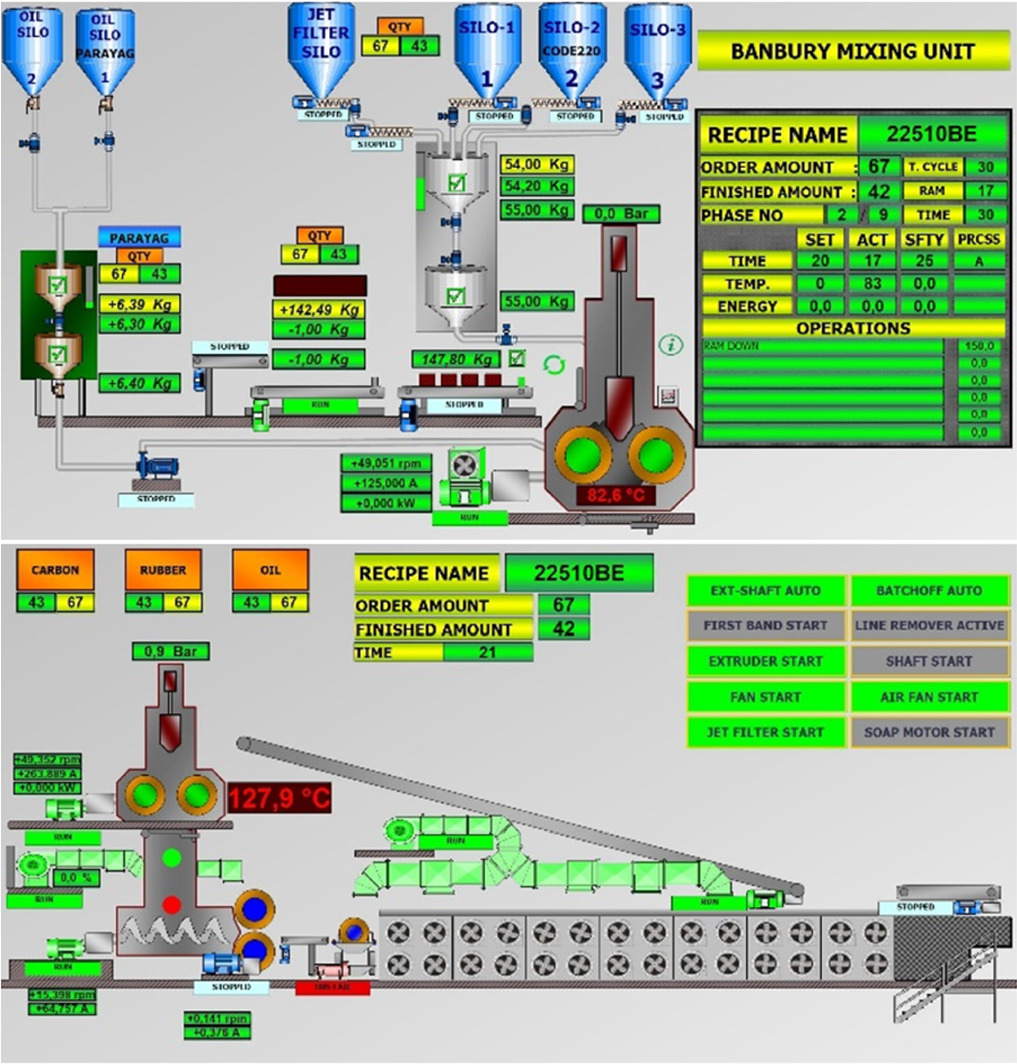
Figure 7. The SCADA screens of the banbury system.
Download figure:
Standard image High-resolution image3.5. Process control and organization
Some measures were taken in the designed system to perform traceability. A barcoding system was made until the last compound was received from the raw material inlet. The organization of the Banbury raw material warehouse material entry and the designed structure are shown in figure 8.
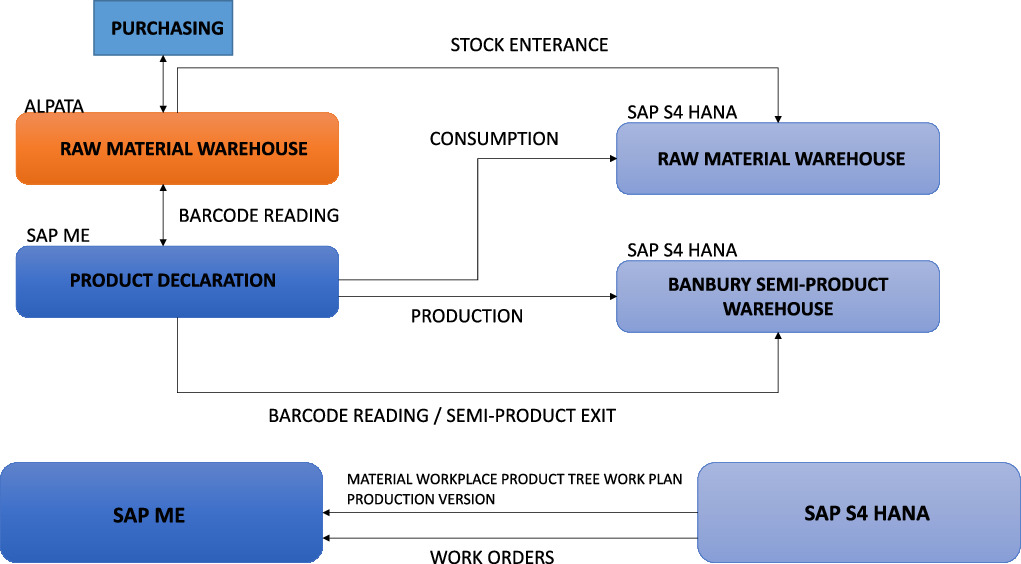
Figure 8. Material input barcode organization.
Download figure:
Standard image High-resolution imageRaw materials from the warehouse were scanned using barcode devices. This operation ensures that the correct raw materials are transferred from the enterprise ALPATA software to the Banbury material acceptance area. Thus, the SAP ME system obtains the raw material data via barcode reading. These materials are then barcoded again and transferred to the Banbury Production Warehouse area on the SAP/ME system. The Raw Material Warehouse is the place where consumption of raw materials is deducted when Banbury is working. Semi-finished or finished compound data are transferred to the Semi/Product Warehouse. The design of the raw material entry, preparation, loading, and subsequent operations is shown in figure 9. The rubber entering the raw material warehouse is barcoded and defined in the ME system. There is a requirement that natural rubbers must enter the hot room for one day whereas, unnatural rubbers can always be used in Banbury. The barcode reading process in the hot room is performed. The expired rubber is taken out of the room. Here, the FIFO (First in First out) approach is adopted. Chemical bags are defined and barcoded on the basis of recipe data in the ME system. The carbon bags that will be dosed in the machine are also subjected to a barcode check at the warehouse entrance and during material loading.
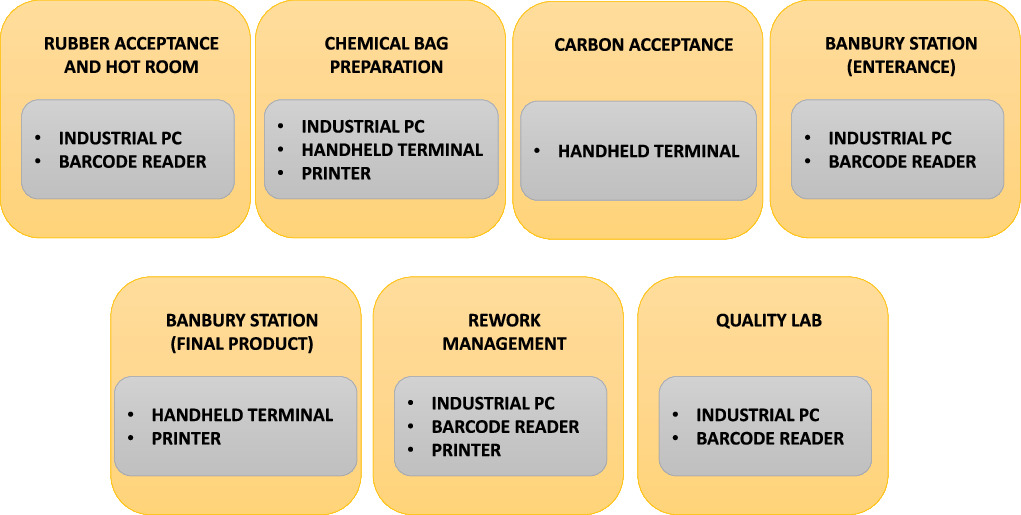
Figure 9. Control structure with raw material barcode and handheld terminal.
Download figure:
Standard image High-resolution imageAt the entrance of Banbury, the barcode system was used to control the raw material which was weighed on the conveyor to go to the mixer. Improper material entry is prevented and retrospective tracking isprovided. The final stage compounds were barcoded. The barcodes were read by a hand terminal and their data were transferred to the system. A rework management screen was designed to track the reuse of rework products. Reused rework products are also tracked using barcodes. The samples that are delivered to the laboratory are recorded by barcoding, and in this way, the results are linked with the sampled batch.
4. Result and discussion
In this section, the status of the Banbury mixing unit before and after digital transformation is compared in terms of performance data. Table 1 shows the statistics of the number of production batches, efficiency, effectiveness, working times and downtimes of the Banbury unit before the application of digital transformation and the statistics after the application of digital transformation. The data obtained represent the daily average values.
Table 1. Production performance comparison.
| Daily Avg. (Three shifts) | Before system commissioning | After system commissioning | Difference |
|---|---|---|---|
| Production Cycle Count | 309 | 420 | + 111 |
| Efficiency (%) | 85 | 92 | + 7 |
| Quality (%) | 96,76 | 98,6 | + 1,84 |
| OEE (%) | 60 | 80 | + 20 |
| Working Time (minutes) | 1397 | 1425 | + 28 |
| Stand-by Time (minutes) | 290 | 100 | − 190 |
According to the data collected, there was a noticeable increase in the number of batches of daily compound production in the three shifts. This was achieved because the efficiency of the machine working time was increased and unnecessary stops were prevented. Here, the machine working time is the sum of the production times of a batch. The production time of a batch therefore decreased in the new system. While the average production time of a batch in a similar product group was approximately 4.52 min in the old system, it was reduced to an average of 3.39 min in the new system. Machine efficiency was increased and operators worked longer in one shift and this which increased productivity in both aspects.
Table 2 shows a comparison of one-week average causes of stops. Comparisons of the current system with the new system were made in terms of stops for the same reason in energy intensive manufacturing. Accordingly, when we look at the stops for the same reason, a noticeable decrease was recorded in particular stops. Since the system was more autonomous, the carbon standby time decreased by 63%, the waiting time of the chemical bag by 100%, the waiting time at meal breaks by 78%, stops due to extruder failure by 100%, and power failure by 96%. This contributed to the efficiency and effectiveness of the unit and to the efficiency of the operators. A decrease was also observed in scrap products with a 79% decrease in stops. The total scrap product decreased by 5%.
Table 2. Comparison of the reasons for stops.
| Reason for stop | Current system | New system |
|---|---|---|
| Compound Jam/Wrap in Batch-Off | 23 | 25 |
| Carbon Standby | 27 | 10 |
| Power Failure | 258 | 10 |
| Preparation of chemical bag | 52 | 0 |
| Meal Break | 69 | 15 |
| Lower Cover Failure | 5 | 9 |
| Extruder Failure | 20 | 0 |
| Total | 454 | 94 |
The overall equipment effectiveness (OEE) of the Banbury system before and after digital transformation wasanalyzed using the data presented in table 1 and table 2. Figure 10 illustrates the stages of system efficiency improvement. In this context, the OEE value is calculated on the basis of three main factors: availability, Performance, and Quality, and can be determined using equation (1) [17]. The values of Availability, Performance, and Quality are determined using equations (2), (3), and (4), respectively [18]. It was revealed that the OEE value of the Banbury system improved by 33% after the digital transformation.


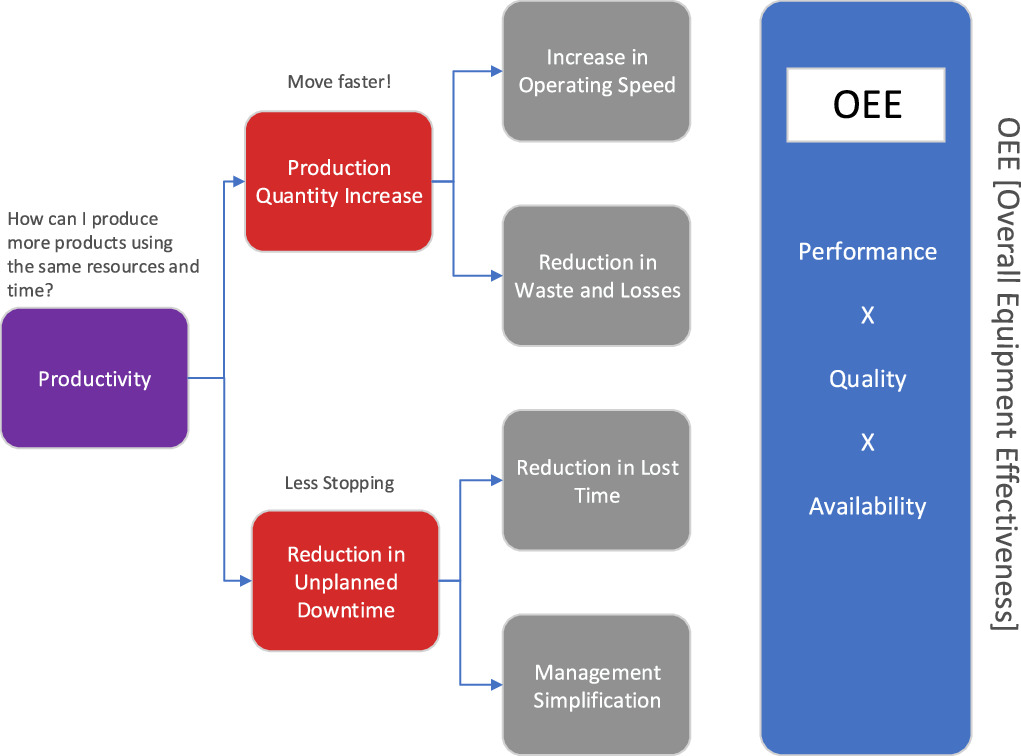
Figure 10. Stages of increasing efficiency.
Download figure:
Standard image High-resolution imageThe active power and active energy consumed by the Banbury unit in the measured time intervals in two different product groups are shown in figures 11 and 12. Instant active power received from the driver input of the unit for the first recipe (first stage product), batch focused power, active energy consumption and batch focused energy consumption are shown in figure 10 respectively. In the graphs shown in figure 9, P_L1, P_L2, P_L3 represent the phase active powers and E_L1, E_L2, E_L3 represent phase active energy. P_T and E_T represent total phase active power and energy consumption respectively.

Figure 11. First recipe driver input active power, instant active power in one batch, driver input active energy, active energy in one batch (respectively).
Download figure:
Standard image High-resolution image
Figure 12. Second recipe driver input active power, instant active power in one batch, driver input active energy, and active energy in one batch (respectively).
Download figure:
Standard image High-resolution imageThe instant supplied power went up to 1.2 MW, and the energy spent in one batch was around 23 kWh. Figure 12 shows the graphs of the instant active power supplied and the energy spent for the product produced with the second recipe. In the second recipe, the instant supplied power increased to 1.1 MW and the energy spent in one batch was around 22 kWh.
Although the power chart is similar in the first and second stage products, there are differences in the power consumed in real time by the system in the first stage products. This is because mixing the first stage product was more difficult than mixing the second stage product. Figure 13 shows the active power supplied from the process feed and the spent active energy consumption for the auxiliary units of the Banbury unit. Instantly, supplier power went up to 180 kW. The energy consumed in one batch was approximately 2 kWh. With the process supply, the energy supply of auxiliary units of the Banbury unit, including conveyor motors, main motor fan, and drive fans, is provided.

Figure 13. Auxiliary units active power, spent active energy (respectively).
Download figure:
Standard image High-resolution image
From a general perspective, efficiency has improved in the renewed system because the failures and failure-related stops decreased and traceability was provided. When we compared the time gained from the stops, which decreased by 79%, with the average batch time, a gain of 106 batches was found. Thus, an energy of approximately 2.4 MWh was converted into work. This decreased therework and scrap rates. An improvement of 355.465 kg was achieved in the rework losses. Considering the average costs of raw materials, an annual gain of $39,500 was achieved by eliminating raw material losses. When we consider the measured power and energy values, an active power up to 1.20 MW was observed to be drawn in a batch in Recipe 1. Also, the energy consumed was approximately 23 kWh. In Recipe 2, an active power was observed to be achieved at 1.1 MW levels in a batch. Again, approximately 22 kWh of active energy was consumed in a batch. According to the process feed measurements, the power drawn by the auxiliary components of the unit during production transiently exceeded 180 kW. The active energy consumed in a batch in the process feed was approximately 2 kWh. Considering that there will be losses in the mentioned values for each batch product, which will result in scrap or rework, such power and energy loses were eliminated in every scrap or rework product which was prevented thanks to digital transformation.
The cost-effectiveness of the production and energy efficiency provided by digital transformation also needs to be considered. Return on Investment (ROI), Financial Gain (FG), and Cost of Investment (CoI) are financial metrics used to evaluate the profitability and efficiency of an investment. ROI is a financial performance measure that calculates the percentage of return or profit generated from an investment relative to its cost. It provides insight into how effectively an investment is generating profits. The equation for ROI is given by equation (5). Financial Gain represents the total benefit obtained from the investment, while the Cost of Investment indicates the total expenditure incurred to make the investment [19].

In the proposed system, the investment costs include licenses, automation, and labor, totaling $277,500 as a one-time expense. The annual service cost,which covers Technical Team Salaries and Maintenance, amounts to $75,000, and the annual financial gain from scrap reduction is $237,000. To calculate the investment coverage ratio, we compare the annual financial gain from scrap reduction ($237,000) with the total costs (investment and annual service cost). By using equation (5) , the first-year ROI is calculated as 67.23%. In the second year, the ROI takes into account the initial investment and the savings achieved from the first year, resulting in a second-year ROI of 124%. By the third year, there are no additional investment costs, so the coverage ratio is simply the annual gain compared to the annual service cost, and the ROI is 316%.
Based on the calculations, we can see the investment costs are covered starting from the second year. In the third year and beyond, the investment coverage ratio is significantly higher, indicating substantial annual gains compared to the ongoing service costs. This analysis suggests that the digital transformation investment is financially viable and provides considerable returns in subsequent years. However, it's essential to consider other factors like market changes, technology advancements, and any potential changes in the cost structure over time to have a comprehensive understanding of the investment's long-term sustainability.
5. Conclusion
A digital transformation design and implementation of the Banbury mixing unit used in the tire production process was carried out. An ISA-95 automation pyramid was used as the basis when creating the structure. Execution of operations such as tracking raw materials and outgoing products, association of laboratory production test results, defining rework and scrap products, and providing traceability were realized using a barcoding system. Uninterrupted data flow was provided from the top to the bottom of the pyramid by MES and ERP integration. 430 recipes used in theproduction area were dynamically improved with the data coming from the system. In energy intensive production, total stops decreased by 79%, the effectiveness of the Banbury unit increased by 15%, and efficiency increased by at least 7%. In the digitally transformed plant, with the processing of collected data, end-to-end traceability was achieved, and with the effective use of the recipe structure, efficiency and performance improvement were achieved in the above-mentioned rates. The daily production rate was increased by 34%. In addition, wastage was reduced and maintenance operations were facilitated. The improvement which was observed in the scrap product at 5% led to a product saving of 355,465 kg per year and 1.25 kWh energy savings per batch. A financial gain of $39,500/year was achieved by eliminating raw material losses.
As a result, digital transformation has positively impacted the system by enhancing efficiency, reducing rework and scrapping, optimizing energy usage, and achieving cost savings. The integration of digital technologies has allowed the system to operate more effectively and has contributed to overall process improvement. The data and information provided by the digital transformation have enabled better decision-making, leading to a more sustainable and productive operation.
Overall, the cost analysis suggests that the digital transformation investment has been successful in improving profitability and efficiency in the system. The positive ROI and the coverage of investment costs by the second year indicate that the investment is paying off and providing considerable returns in subsequent years. However, continuous monitoring, adaptability to changing circumstances, and strategic planning are crucial to ensure the sustained success and profitability of the digital transformation initiative.
Acknowledgments
The authors would like to thank the tire manufacturing company called 'ÖZKA TYRE', for the kind support of this study, which is pioneering digital transformation projects in the market.
Data availability statement
All data that support the findings of this study are included within the article (and any supplementary files).