
Abstract
Nickel-based superalloys have numerous applications in automobile, aerospace, turbine blades, nuclear, oil refinery etc, due to their excellent properties like strength, wear resistance, corrosion resistance and higher creep strength. Because of these properties, modern manufacturing industries need help with the machining of nickel-based superalloys, i.e. hard-to-machine materials. In the present research, Ni-based X-750 alloy is machined with turning operation by a conventional lathe machine using a TiAlN PVD coated tungsten carbide tool at different rotational speed (TRS), depth of cut (DoC) and feed (F) values as input parameters whereas material removal rate (MRR) and tool wear (TW) are the responses of the study. The design of experiments (DoE) is prepared by response surface methodology-based Box-Behnken Design. Analysis of variance (ANOVA) was applied to investigate the percentage contribution of each machining parameter on responses. Non-dominated Sorting Genetic Algorithm-II (NSGA-II) simultaneously optimizes the developed empirical models of MRR and TW. The predicted solutions suggested by NSGA-II are the best solution, and confirmation experiments are conducted on randomly selected parametric settings from these solutions. The optimized set presented by NSGA-II is TRS: 900RPM; DoC: 0.06 mm; F: 0.1 mm rev−1, and the maximum relative error in the case of MRR and TW is in the permissible limit. Scanning electron microscopy (SEM) and Energy dispersive spectroscopy (EDS) are used to investigate the morphology of tool insert before and after machining at optimized value TRS: 900 RPM; DoC: 0.1 mm; F: 0.06 mm rev−1, and it shows the wear marks on the tool, and the Energy dispersive spectroscopy confirms the presence of coating and WC. SEM is used to investigate the morphology of chips formed at different optimized parametric settings.
Export citation and abstract BibTeX RIS
1. Introduction
During dry machining, high heat is generated because of the extreme friction produced at the interface of the tool chip [1]. As a result, the temperature at the interface increases, resulting in crater wear and flank wear and hence shorter tool life [2]. Cutting fluids overcome the heat and friction and flush the wear debris. Cutting fluids can increase the tribological circumstances between the two sliding surfaces. However, these are not good for the environment or the health of the operator [3]. Therefore, nowadays, researchers emphasize minimal cutting fluids used to develop sustainable and eco-friendly processes [4]. One of the possible solutions is to use dry machining to overcome environmental pollution, cleaning costs, treatment, health issues etc [5]. In such machining, high heat is generated due to extreme friction and adhesion between the workpiece's interfaces. This results in an increase in temperature during cutting and reduced tool life. Hence, some advanced cooling techniques or cutting tools are developed to overcome friction. Advanced tool materials, coating of the tool and solid lubricants added with the material of the tool are a few replacements to boost the functioning of dry machining [6]. When coated with TiN/TiAlN, tool surfaces can enhance the tribological characteristics during the dry machining of nickel-based alloys [7]. Another way to overcome the friction is to fill solid lubricant in micro-textures or add calcium fluoride (CaF2) solid lubricant into the tungsten ceramic /carbide [8–10]. Reducing abrasive and adhesive wear between the sliding surfaces can be an alternate approach instead of using WC without solid lubricant. It also emphasized increasing the practice of cutting tools to attain sustainable machining [11]. For lubrication and cooling, minimum quantity cutting fluid (MQCF) is widely utilized [12–14]. Following the traditional tribological viewpoint, smoother friction pairs demonstrate milder wear.
Nevertheless, many investigators from their work demonstrated that micro-textured surfaces might result in reduced friction and enhance the capabilities while dry machining under some specific circumstances [15–17]. Various processes, like laser peen, are used to texture the surface by developing a micro dimple array on the surface [18–20]. Micro-textured rake faces inserted with the cutting tool were fabricated using the laser to enhance the tribological properties when Ti-6Al-4V was drilled [21]. They conveyed that the friction was reduced to 16.33% and even 14.29% when micro-dimpled and micro-grooved surfaces were used. Jayal et al used cemented WC tools, which were uncoated and grounded rake faces [22]. The outcomes of their research demonstrated that when AISI 1020 steel is machined, various process parameters influence tool-chip cutting force and contact temperature. Four micro-holes were built on the cutting tool flank and raked face using micro-electrical discharge. These micro-holes are then burnished using molybdenum disulphide (MoS2). Research shows the existence of a solid lubricant between the chip-tool interfaces [23]. Though texturing of the surface is advantageous, it is also reported that when the thermal mean is utilized to texture, the surface causes many problems. The heat-affected zone during texturing was the chief problem, and also, poor quality of the textured surface generates abrasive wear [24].
A traditional mechanical approach can resolve the issues mentioned above. Conventional methods like a scratch tester and Vickers hardness can construct micro-textures. These traditional approaches are not only eco-friendly but also free from damaging gases. The textured form under these processes is MμTs (mechanical micro-textures). These MμTs are of superior quality of surface, thermal stresses or heat affected zone and are also easy to generate [25]. Here, traditional approaches, mainly scratch tester and Vickers hardness, are used to fabricate the texture on the WC tool. Several researchers [26–28] worked on machining Nickel-based Inconel alloys, but limited research has been observed on X-750 Nickel alloy. Table 1 depicts the recent work published by researchers on Nickel-based alloys.
Table 1. Recent work on nickel-based alloys.
| Authors | Material | Input parameters | Output parameters | Technique used | Outcomes |
|---|---|---|---|---|---|
| Singh et al [29] | Ni-based Alloy | — | — | Review | The coating on the tool plays a pivotal role in machining. |
| Tu et al [30] | Inconel 718 | Cutting speed, binders | Temperature and flank wear | FEM | BKN115P have longer tool life than BHC115P and BHC135P. |
| Ross et al [31] | Monel −400 | Dry, minimum quantity lubrication, CO2 and CMQL | Temperature, surface roughness, tool wear, chip morphology | Different cooling technique | CMQL is the best cooling technique, which reduces the coefficient of friction. Flank wear is reduced by 51%–55% using CMQL. |
| Saleem and Mehmood [32] | Inconel 718 | Cutting speed, feed rate, air pressure | Tool wear and surface roughness | Taguchi L9 | Cutting speed was the only significant parameter for tool wear, while feed rate was the most significant parameter for surface roughness. |
| Monaca et al [33] | Inconel 718 | Cutting speed, rake angle and shape edge radius | Cutting force and energy | One factor at a time | Small-scale behavior reduces the cutting force and energy by 25%–30% |
| Singh and Sharma [34] | Hastelloy C-276 | Dry, Flood, MQL and UAF | Microhardness, residual stress, Chip morphology | Different Cooling technique | Ultrasonics atomized cutting fluid outperform over other cooling technique. |
| Danish et al [35] | Inconel 718 | Dry, MQL, LN2 and CO2 | Cutting forces, Surface roughness, Tool wear | Cooling Technique | LN2 decreases the cutting force by 32.1%, energy consumption by 18% and tool wear by 33.33%. |
| Ross et al [36] | Nimonic 80A | Feed rate, MQL, CO2, CO2+MQL | Dynamometer, Cutting energy | Cooling technique | Hybrid cooling conditions reduces the temperature and cutting energy by 34%–53% and 17%–19%. |
The current study used TiAlN-coated WC cutting tools to machinate X-750 nickel alloy. The MRR and TW are investigated after varying the rotational speed (TRS), depth of cut (DoC) and feed (F). The elemental composition and surface morphology analysis is completed using energy dispersive spectroscopy (EDS) and scanning electron microscope (SEM). This research aims to machine the hard alloys using conventional machining processes using a coated WC tool. It is a footstep towards eco-friendly and sustainable manufacturing. The objective of the present work are (i) machining of X-750 nickel alloy using coated WC tool inserts, (ii) Investigation of variation of process parameters on MRR and TW (iii) development of empirical model for MRR and TW (iv) Prediction of solutions using developed empirical model and investigation of optimized setting.
2. Experimentations
2.1. Tool and workpiece material
In the present work, Tungsten carbide insert PVD coated with TiAlN is used as tool as shown in figure 1(a). The tool insert has the signature as the angle of approach: 91°; clearance angle: 0°; inclination angle: −6°; nose radius: 1.2mm, and rake angle: −6°. Tool holder Model number LI FENG JING MI WTJNR 25252M16 is used for holding the tool bit while experimentation on turning operation. Scanning electron microscopy (SEM) of the PVD coated tool insert before turning operation as shown in figure 1(b) to compare with SEM of tool insert after turning operation to investigate the morphology of insert, done at Chandigarh University, Chandigarh, India. Nickel based super alloy X-750 (crystallite size: 144°A according to Scherrer formulations) is used as workpiece, size 30 mm in diameter and 110 mm in length. The elements present in the work piece are provided in table 2 and it is observed that after Ni, Cr has the maximum contribution, followed by Fe, Ti and other elements that have a small content percentage.
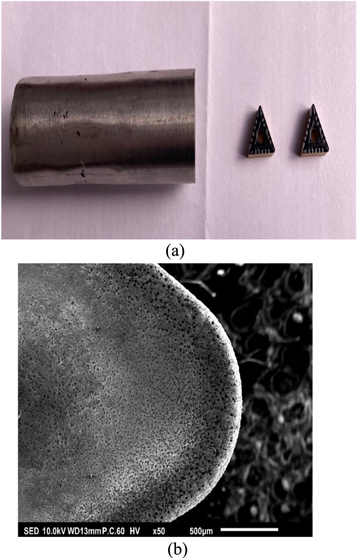
Figure 1. (a) Alloy X-750 material and PVD Coated TiAlN tool insert. (b) SEM of coated carbide tool before machining.
Download figure:
Standard image High-resolution imageTable 2. Elements present in the alloy X-750.
| Element | Content % |
|---|---|
| S | 0.01 |
| C | 0.08 |
| Al | 0.6 |
| Si | 0.5 |
| Cu | 0.5 |
| Nb | 0.8 |
| Mn | 0.7 |
| Ti | 2.35 |
| Fe | 7.2 |
| Cr | 15.7 |
| Ni | Balance |
2.2. Planning of experiments
The experiments were planned according to response surface methodology-based Box-Bhenken Design (BBD), is based on 12 mid edge nodes and three central nodes to satisfy the 2nd order equation and its prime benefit is to generate higher order response with fewer required experiments. The other benefit of the BBD is the reduction in the number of experiments (figure 2(a)). Additionally, CCD select one value lower and higher than the given range, due to which the search space is extrapolated, but BBD works in the given range. Thus, BBD is selected in the present work. The experiments are conducted within the polynomial region, and the design is rotatable (or near rotatable) [37]. A total of seventeen experiments were planned and performed as per the run order. NSGA-II is used to predict the solutions of MRR and TW at different parametric settings of tool rotational speed (TRS), depth of cut (DoC), and feed (F).

Figure 2. (a) Experimental points in BBD. (b) Experimental set up. (c) Weighing balance set up. (d) Optical microscope set up. (e) SEM and EDS set up. (f) Process adopted in the current work.
Download figure:
Standard image High-resolution image2.3. Experimentation
In the present work, Tungsten carbide inserts coated with TiAlN are used to machine, i.e. turning operation on Nickel based super alloy X-750 by a semi-automatic lathe machine named Bhilkhu, situated at Ambala, India. Machining parameters with their levels are shown in table 3. The 17 experiments are performed with different parameters selected in the present work are tool rotational speed (TRS), depth of cut (DoC) and feed (F) as suggested by (DoE) RSM. The experimental setup is shown in figure 2(b). The MRR (in mm3 min−1) is measured using weighting balance ((ViBRA/ESSAC with a tuning-fork sensor)), as shown in figure 2(c), and TW (Conation- SuXma) (in mm) is calculated using an optical microscope, as shown in figure 2(d). Three readings are recorded for both responses. The average of three is used for analysis. After machining, the morphology of tool insert and chips formed at optimised value is studied using a scanning electron microscope (SEM) as shown in figure 2(e) (SEM and EDS setup at NITTTR Chandigarh, India) (Jeol make JSM-IT100, Japan). Energy Dispersive Spectroscopy (EDS) is used for the elemental mapping of the rake face of the tool insert for the existence of different elements (F). The process implemented in the current work is represented in figure 2(f).
Table 3. Input machining parameters and their levels.
| Level/code | ||||
|---|---|---|---|---|
| Machining parameters | Symbols (units) | −1 | 0 | 1 |
| Rotational speed | TRS (RPM) | 900 | 1250 | 1600 |
| Depth of cut | DoC (mm) | 0.1 | 0.2 | 0.3 |
| Feed | F (mm rev−1) | 0.06 | 0.09 | 0.12 |
3. Results and discussion
The experimental matrix or Design of Experiment for the input parameters with corresponding values of responses i.e. MRR and TW are presented in table 4.
Table 4. Experimental matrix and corresponding results.
| Std Odr | Run Odr | A: TRS (RPM) | B: DoC (mm) | C: F (mm rev−1) | MRR (mm3 min−1) | TW (mm) |
|---|---|---|---|---|---|---|
| 1 | 5 | 900 | 0.1 | 0.09 | 765 | 0.26 |
| 2 | 12 | 1600 | 0.1 | 0.09 | 1359 | 0.37 |
| 3 | 4 | 900 | 0.3 | 0.09 | 2295 | 0.51 |
| 4 | 10 | 1600 | 0.3 | 0.09 | 4077 | 0.55 |
| 5 | 9 | 900 | 0.2 | 0.06 | 1020 | 0.27 |
| 6 | 7 | 1600 | 0.2 | 0.06 | 1812 | 0.34 |
| 7 | 13 | 900 | 0.2 | 0.12 | 2040 | 0.47 |
| 8 | 14 | 1600 | 0.2 | 0.12 | 3624 | 0.56 |
| 9 | 8 | 1250 | 0.1 | 0.06 | 708 | 0.27 |
| 10 | 17 | 1250 | 0.3 | 0.06 | 2124 | 0.43 |
| 11 | 6 | 1250 | 0.1 | 0.12 | 1416 | 0.44 |
| 12 | 1 | 1250 | 0.3 | 0.12 | 4248 | 0.54 |
| 13 | 16 | 1250 | 0.2 | 0.09 | 2124 | 0.27 |
| 14 | 2 | 1250 | 0.2 | 0.09 | 2124 | 0.43 |
| 15 | 11 | 1250 | 0.2 | 0.09 | 2124 | 0.4 |
| 16 | 15 | 1250 | 0.2 | 0.09 | 2124 | 0.32 |
| 17 | 3 | 1250 | 0.2 | 0.09 | 2124 | 0.37 |
3.1. Analysis of variance (ANOVA)
The ANOVA clarifies the significant input parameters in the process and their percentage contribution to the evaluation of the responses. The table 5 depicts the ANOVA for MRR and TW, and it is evident from the data that all the parameters have influential contributions to the computation of MRR. The two-factor interaction model was observed to be significant in the case of MRR. The P-values of all the input parameters are less than 0.05, which verifies the influential contribution of all the parameters. A high F-value of the input parameter corresponds to the highest contribution for the evaluation of the input parameter. From this, it is interpreted that DoC has the maximum contribution for MRR, followed by F and TRS because F-value has highest value 11985.78, 5327.01 and 3749.64 respectively. The value of R2, Pred-R2, and Adj-R2 also verifies the presence of a suitable ANOVA. In the present study the value of Adeq-Prec. is 201.068 i.e. greater than value 4 with condition if Adeq-Prec. is more than value 4 reflects good model. The present model is good one.
Table 5. ANOVA for MRR and TW.
| ANOVA for MRR | ||||||
|---|---|---|---|---|---|---|
| Source | SS | df | MS | F-value | P-value | |
| Model | 1.69E + 07 | 6 | 2.81E + 06 | 3734.22 | <0.0001 | Significant |
| A-TRS | 2.82E + 06 | 1 | 2.82E + 06 | 3749.64 | <0.0001 | |
| B-DoC | 9.02E + 06 | 1 | 9.02E + 06 | 11985.78 | <0.0001 | |
| C-F | 4.01E + 06 | 1 | 4.01E + 06 | 5327.01 | <0.0001 | |
| AB | 3.53E + 05 | 1 | 3.53E + 05 | 468.71 | <0.0001 | |
| AC | 1.57E + 05 | 1 | 1.57E + 05 | 208.31 | <0.0001 | |
| BC | 5.01E + 05 | 1 | 5.01E + 05 | 665.88 | <0.0001 | |
| Residual | 7527.88 | 10 | 752.79 | |||
| Lack of Fit | 542.68 | 6 | 90.45 | 0.052 | 0.9986 | not significant |
| Pure Error | 6985.2 | 4 | 1746.3 | |||
| Cor Total | 1.69E + 07 | 16 | ||||
| R2 : 0.9996 | Adj. R2 : 0.9996 | |||||
| Pred. R2 : 0.9995 | Adeq. Prec.: 201.068 | |||||
| ANOVA for TW | ||||||
| Source | SS | df | MS | F-Value | P-Value | |
| Model | 0.13 | 3 | 44 × 103 | 15.37 | 0.0001 | significant |
| A-TRS | 0.012 | 1 | 12 × 103 | 4.17 | 0.0619 | |
| B-DoC | 0.06 | 1 | 6 × 10² | 20.67 | 0.0005 | |
| C-F | 0.061 | 1 | 61 × 103 | 21.28 | 0.0005 | |
| Residual | 0.037 | 13 | 0.00288 | |||
| Lack of Fit | 0.021 | 9 | 0.00235 | 0.58 | 0.7735 | not significant |
| Pure Error | 0.016 | 4 | 0.00407 | |||
| Cor Total | 0.17 | 16 | ||||
| R2 : 0.780112 | Adj. R2 : 0.681934 | |||||
| Pred. R2 : 0.729368 | Adeq. Prec.: 13.35181 | |||||
The statistical summary of TW shows that the linear model fits the computation of the TW. The P-value, less than 0.05 for the parameters, signifies the influential role of all parameters in the TW. The F-values show that F has the maximum role in the TW, trailed by DoC and TRS. The lack of fit is non-significant, with a value of 0.7735. The importance of R2, Pred-R2, Adj-R2 and Adeq-Prec. suggests a good model and good ANOVA. The difference between Pred-R2 and Adj-R2 is observed within the permissible limit.
Figure 3(a) presents the predicted versus actual plot for MRR, and it has been observed that all the residuals fall along a straight line. For a suitable ANOVA, all the residuals should lie in a straight line, and it is true for the present work, which means that the ANOVA for MRR represents a good model for future outcomes. The value of MRR with all three varying input parameters is depicted in the cube plot for MRR in figure 3(b). The plot shows that MRR varies from 612.65 to 810.65 mm3 min−1 at F: 0.06 mm rev−1 and DoC: 0.1 mm, while TRS varies from 900 to 1600 rpm. In other events, when TRS varies from 900 to 1600 rpm, the MRR varies from 1434.65 to 2820.65 at F: 0.06 mm rev−1 and DoC: 0.3 mm. Similarly, when TRS varies from 900 to 1600 rpm, the MRR varies from 3162.65 to 5340.65 mm3 min−1 at F, and DoC is 0.12 mm rev−1 and 0.3 mm, respectively.
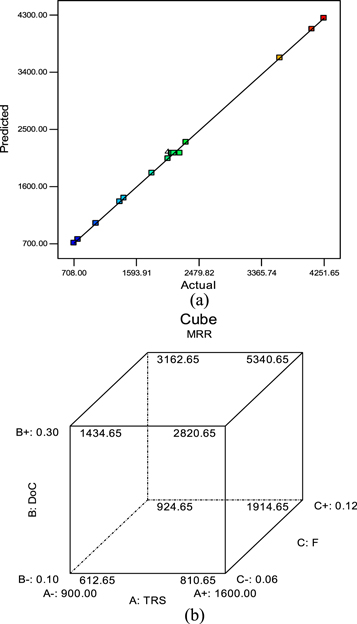
Figure 3. (a) Predicted versus actual for MRR. (b) Cube plot for MRR.
Download figure:
Standard image High-resolution imageAll the residuals falling along the straight line, representing uniform distribution, reveals suitable ANOVA for the present work, as shown in figure 4(a) actual versus predicted plot for TW. The TW at a different set of three input parameters may be interpreted from figure 4(b). The cube plot shows the variation of TW corresponding to all three input parameters. When TRS varies from 900 to 1600 rpm, then tool wear varies from 0.24 to 0.32 mm at F: 0.06 mm rev−1 and DoC: 0.10 mm. In another case, Tool wear increases from 0.58 to 0.67 mm when TRS increases from 900 to 1600 rpm at DoC: 0.30 mm and F: 0.12 mm rev−1. Similarly, TRS and DoC are kept constant at 1600 rpm and 0.1 mm, respectively, and changing the F value from 0.06 mm rev−1 to 0.12 mm rev−1; the TW changes from 0.42 mm to 0.5 mm
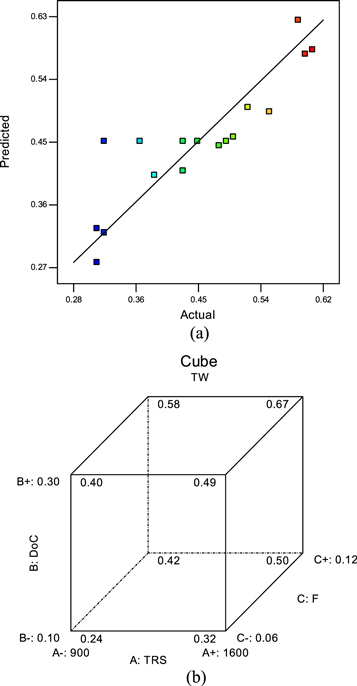
Figure 4. (a) Predicted versus actual for TW. (b) Cube plot for TW.
Download figure:
Standard image High-resolution imageThe models (empirical) developed for the MRR and TW are given in equations (1) and (2), respectively.


4. Implementation of NSGA-II and confirmation experimentation
4.1. NSGA-II
NSGA-II, Non-dominated sorting genetic algorithm, is suitable to assess the all points by mathematical calculations for optimization, and opted to generate the set of optimal solutions, known as Pareto set and also called nondominated solutions which makes compromise between all objectives without any biasing [30]. It provides the set of good quality solution, which gives more flexibility to users for the investigation of preferences in a particular situation. It is also found that NSGA-II provides better solution as compared to other optimization technique especially in the situation, where the responses are more than one and are of contradictory in nature. Although, there are other available methods, which are simple to implement, but still NSGA-II works better in multi-objective problems [38, 39]. In this the Pareto front is calculated according to the predicted optimal set of solution. A non-dominated solution is one in which a compromise has been set between the performance characteristics without degrading the other solutions. In this method, a solution (say f) is compared with all the predicted solution on that particular setting, if any solution does not dominate solution 'f'; then solution 'f' is termed as non-dominated solution and falls in the set of Pareto front. As compared to other available technique this technique is easy to apply and the results are comparable to other technique. In the current research work, two machining characteristics MRR and TW were considered with larger the better type quality and lower the better type quality respectively. Thus, MRR and TW are opposite, which means if MRR increases, then TW increase. Therefore, on one side production rate increases (with the rise in MRR) and another side, the operating cost also increases (with the rise in TWR). Hence, NSGA II is utilized to optimize two responses i.e. MRR and TW, simultaneously by setting the compromise between them [40, 41]. The machining response is provided in equations (3) and (4).


The flow diagram of the optimization process is depicted in figure 5. The below-mentioned working parameters are selected to investigate the solutions with minimum computational effect, (i) mutation probability: 0.2; crossover probability: 0.8; the maximum number of generations: 50; population size: 100. The empirical model developed as equations (3), and (4) are solved in the working range of machining parameters. The machining parameter range is given from equations (5)–(7).


The Pareto optimal front of both objectives is investigated using NSGA-II, as shown in figure 6. A total of thirty solutions were predicted and are mentioned in table 6. Table 6 shows that the whole range of solutions was predicted with no bias with the MRR or TW side. Both the machining responses are given equal importance, and all the Pareto fronts co-existed in the population. It is clear from the solutions that one solution is no better than another, and any solution can be considered acceptable. The choice of solution can be considered according to the solution obtained. If higher productivity is desired, then a solution with a higher MRR is selected. If a solution with the minimum operating cost is desired, then a low value of TW is chosen.
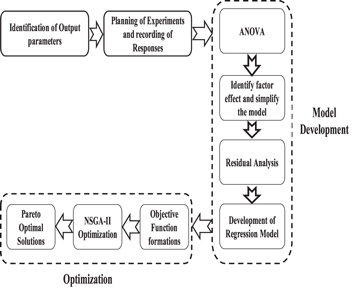
Figure 5. Process flow of optimization process in the present work.
Download figure:
Standard image High-resolution image
Figure 6. Pareto front plot for MRR and TW.
Download figure:
Standard image High-resolution imageTable 6. Solutions predicted using NSGA-II.
| Sr No. | TRS (RPM) | DoC (mm) | F (mm rev−1) | MRR | TW |
|---|---|---|---|---|---|
| 1 | 1600 | 0.3 | 0.12 | −5994.05 | 1.15166 |
| 2 | 900 | 0.1 | 0.06 | −467.449 | 0.37681 |
| 3 | 900 | 0.1 | 0.06 | −467.449 | 0.37681 |
| 4 | 1600 | 0.3 | 0.12 | −5994.05 | 1.15166 |
| 5 | 1599.988 | 0.121861 | 0.12 | −2295.85 | 0.617239 |
| 6 | 1600 | 0.185418 | 0.12 | −3615.32 | 0.807913 |
| 7 | 1573.851 | 0.148985 | 0.12 | −2803.26 | 0.693959 |
| 8 | 1324.66 | 0.1 | 0.118558 | −1491.82 | 0.501442 |
| 9 | 1597.483 | 0.233278 | 0.12 | −4599.53 | 0.951045 |
| 10 | 1345.2 | 0.101685 | 0.12 | −1561.43 | 0.51136 |
| 11 | 1600 | 0.125545 | 0.12 | −2372.37 | 0.628296 |
| 12 | 1600 | 0.141846 | 0.119996 | −2710.7 | 0.677195 |
| 13 | 1599.903 | 0.139239 | 0.12 | −2656.47 | 0.669361 |
| 14 | 900 | 0.100309 | 0.088384 | −719.259 | 0.401508 |
| 15 | 1599.91 | 0.118612 | 0.12 | −2228.29 | 0.60748 |
| 16 | 1600 | 0.239971 | 0.12 | −4747.84 | 0.971572 |
| 17 | 1600 | 0.236685 | 0.119998 | −4679.58 | 0.961714 |
| 18 | 1046.151 | 0.101598 | 0.119958 | −1189.68 | 0.457832 |
| 19 | 1600 | 0.235999 | 0.12 | −4665.38 | 0.959656 |
| 20 | 1592.988 | 0.188826 | 0.12 | −3665.86 | 0.816889 |
| 21 | 1600 | 0.297042 | 0.12 | −5932.64 | 1.142786 |
| 22 | 1598.438 | 0.183046 | 0.12 | −3561.76 | 0.80052 |
| 23 | 1599.939 | 0.151912 | 0.12 | −2919.62 | 0.707386 |
| 24 | 1599.999 | 0.287619 | 0.12 | −5737.02 | 1.114518 |
| 25 | 1600 | 0.16639 | 0.12 | −3220.31 | 0.75083 |
| 26 | 1599.991 | 0.112525 | 0.119992 | −2101.93 | 0.589227 |
| 27 | 900 | 0.1 | 0.081284 | −655.385 | 0.394635 |
| 28 | 1599.952 | 0.202003 | 0.12 | −3959.48 | 0.857661 |
| 29 | 1599.94 | 0.149439 | 0.12 | −2868.26 | 0.699965 |
| 30 | 1600 | 0.285815 | 0.12 | −5699.57 | 1.109106 |
4.2. Confirmation experiments
The optimization of machining parameters using NSGA-II shows the significant improvement in the response variable i.e. MRR and TW. The confirmation experiments are conducted on the randomly selected machining parameter setting from table 6.
The confirmation experiments (table 7) are repeated three times and the average of three is compared with the predicted solutions. The comparison between the predicted and experimental solution is made and the percentage variation is less than 7%, which shows the good result reproduction. In previous published results [42, 43], the percentage error is less than 7%. The error may occur because of the human error, procedural error or environmental error. Micro-structural images are captured at TRS900DoC0.06F0.1, and TRS1600DoC0.12F0.15 suggested by NSGA-II is shown in figure 7. There is remarkable abrasive mark, means visible crater wear is observed on the coated tungsten carbide tool by using Scanning Electron Microscopy (SEM) after machining as shown in figure 7. Figures 7(a) and (b) shows the minimum crater wear is 148.054 μm and 178.045 μm on TRS900DoC0.06F0.1, and TRS1600DoC0.12F0.15 respectively. Furthermore, maximum crater wear is 198.494 μm and 298.101 μm on TRS900DoC0.06F0.1, and TRS1600DoC0.12F0.15 respectively. Moreover, average crater wear is 196.24 μm and 254.95 μm on TRS900DoC0.06F0.1, and TRS1600DoC0.12F0.15 respectively.
Table 7. Confirmation experiments.
| Predicted solution | Experimental solution | |||
|---|---|---|---|---|
| Process parameters setting | MRR | TW | MRR (error in percentage) | TW (error in percentage) |
| TRS900DoC0.1F0.06 | 467.449 | 0.37681 | 482.53 (3.2%) | 0.392 (4.03%) |
| TRS900DoC0.1F0.09 | 719.259 | 0.401508 | 711.71 (1.049%) | 0.4271 (6.38%) |
| TRS1600DoC0.15F0.12 | 2868.26 | 0.699965 | 2851.93 (0.569%) | 0.7316 (4.52%) |

Figure 7. (a) SEM of tool insert on TRS900DoC0.06F0.1. (b) SEM of tool insert on TRS1600DoC0.12F0.15.
Download figure:
Standard image High-resolution imageTool wear is measured 0.392 and 0.7316 at TRS900DoC0.06F0.1, and TRS1600DoC0.12F0.15 respectively by Optical microscope as shown in figures 8(a) and (b), which signifies a significant tool wear. However, the EDS shows the presence of WC, Ti and N due to coating of TiAlN on the WC tool insert. Figure 8(c) depicts the optimal image of the tool insert, which signifies significant tool wear.
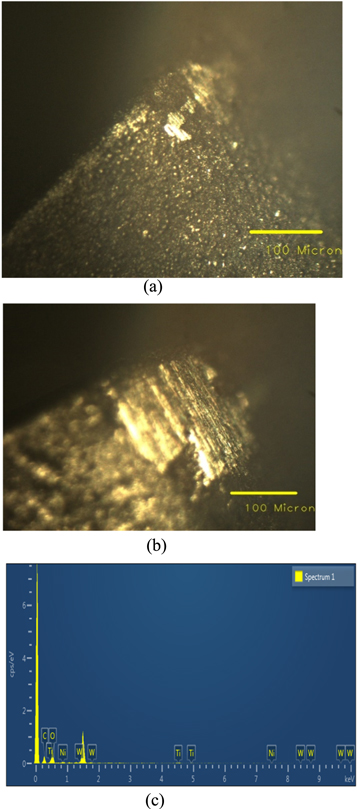
Figure 8. (a) Optical image of tool insert on TRS900DoC0.06F0.1. (b) Optical image of tool insert on TRS1600DoC0.12F0.15. (c) EDS of tool insert after wear.
Download figure:
Standard image High-resolution imageIt is observed that, at TRS1600DoC0.12F0.15 parametric setting material removal rate (2851.93) and tool wear (0.7316) is more than at TRS900DoC0.06F0.1 parametric setting with material removal rate (482.53) and tool wear (0.392) due to high friction produced because of high tool rotational speed, more depth of cut and more feed rate.
4.3. Chip morphology
The chip morphology or chip removal in the machining process indicates the nature of the tool-work interface. This morphology may be extruded, elongated, blocky or segmental/lamellar, which depends upon the status of the process. During the machining process, no lubricant is used, and the coated carbide tools are used for the machining process. The chips are collected after a particular gap with regular intervals of time. At the initial stage, chips are not uniform, and the materials sometimes come in contact with a tool, or sometimes a gap is formed due to deflection. Thus, once the machining process starts, the chips are collected after an interval of time. So that uniform chips are obtained and can be easily analyzed. Usually, the segmental chips are obtained at low speed. As the speed increases, the chips are serrated, and continuous status is obtained. Figure 9(a) shows the transition of the chip from serrated to continuous serrated. The serrated chips have just started forming at TRS: 900 RPM; DoC: 0.1 mm; F: 0.09 mm rev−1. The two arrows in figure 9(a) depict the two regions, representing the chips' inhomogeneity. These types of chips are formed in dry machining due to the high temperature. Also, the red path is drawn to check the serration status. This indicates the transition stage in which one triangular portion is complete, along with some irregularities. Once the speed is increased from this limit, continuous serration is observed, as in figure 9(b). The inhomogeneity in the chip is visible between the arrows. The formation of triangles is uniform due to high-temperature machining conditions, which are TRS: 1600 RPM; DoC: 0.15 mm; F: 0.12 mm rev−1.

Figure 9. (a) Chip morphology at TRS900DoC0.01F0.09. (b) Chip morphology at TRS1600DoC0.15F0.12.
Download figure:
Standard image High-resolution image
It is clear from the analysis that the input parameters plays major role in the deformation of the material. In the primary shear-zone, the shear localized instability is observed in the adjacent segments. With the increase in the cutting speed, a rapid decrement in the contact area is observed.
5. Conclusions
The nickel-based X-750 alloy has been machined using TiAlN-coated WC tool inserts at different settings of TRS, DoC and F. The following conclusions have been observed from the current research:
- 1.It is concluded that hard to machine material may be machined by coated carbide tool in dry condition as in the present study X-750 nickel alloy material has been successfully machined by TiAlN coated carbide tool.
- 2.ANOVA of MRR shows that TRS, DoC, F, the interaction of TRS and DoC, TRS and F; DoC (53.5%) plays a significant role in the investigation of MRR. DoC has the maximum contribution in the MRR, preceded by F (23.7%) and TRS (16.7%).
- 3.ANOVA of TW presents the significant contribution of F, DoC and TRS. In the TW, the F (35.88%) has the maximum influence, preceded by DoC (35.29%) and TRS (7.05%).
- 4.The optimized setting suggested by NSGA-II is TRS: 900 RPM; DoC: 0.1 and F: 0.06 mm rev−1. The predicted values of MRR and TW is 467.45 mm3 min−1 and 0.3768 mm at optimized setting and experimental value of MRR and TW corresponding to optimized setting is 482.53 45 mm3 min−1 and 0.392 mm respectively.
- 5.The morphological investigation depicts the presence of crater wear on the tool surface, and the EDS validates the presence of a coating on the tool insert. Also, the continuous serrated chips are observed at high CS parameters setting.
Data availability statement
The data used in this manuscript is already provided in the article. No extra data is availbale. The data that support the findings of this study are available upon reasonable request from the authors.